


Statement of Research Significance
Research Question(s) or Topic(s): How are specific home environment factors associated with cognitive functioning and school readiness in children with sickle cell disease (SCD)? Main Findings: After accounting for disease severity, the overall quality and quantity of cognitively engaging materials and interactions in the home was associated with overall intelligence, school readiness, and working memory (i.e., ability to mentally hold on to and manipulate information for brief periods of time). When more specific resources in the home were examined, learning materials, diversity of activities, and caregiver use of boundaries were found to be particularly important to fostering these early skills. Study Contributions: Cognitively engaging materials and interactions in the home are important to encouraging the development of cognitive and school readiness skills in young children with SCD. Specifically, helping caregivers set boundaries and provide access to learning materials and diverse activities has the potential to improve developmental outcomes in these patients.
Sickle cell disease (SCD) is an inherited blood disorder that alters the production of hemoglobin, which in turn results in increased risk for several complications including avascular necrosis, stroke, and recurrent episodes of acute pain (Kavanagh et al., Reference Kavanagh, Fasipe and Wun2022). Research estimates that about 500,000 infants are diagnosed with SCD per year globally, and approximately 100,000 people live with the condition in the United States (Kavanagh et al., Reference Kavanagh, Fasipe and Wun2022). Adults and children with SCD experience poor health-related quality of life attributable to a combination of medical (Kavanagh et al., Reference Kavanagh, Fasipe and Wun2022), and psychosocial factors including low socioeconomic status (SES), racial bias, and health-related stigma (Hood et al., Reference Hood, Crosby, Hanson, Shook, Lebensburger, Madan-Swain, Miller and Trost2022).
Individuals with SCD are at increased risk for a range of cognitive and academic deficits (Heitzer et al., Reference Heitzer, Schreiber, Yuan, Wang, Pan, Graff, Murphy, Rupff, Russell, Wang, Estepp, Hankins, Porter and Jacola2022; Ruffieux et al., Reference Ruffieux, Njamnshi, Wonkam, Hauert, Chanal, Verdon, Fonsah, Eta, Doh, Ngamaleu, Kengne, Fossati and Sztajzel2013), with challenges presenting as early as infancy and persisting into adulthood (Prussien et al., Reference Prussien, Jordan, DeBaun and Compas2019). A cross-sectional study in which children with SCD were compared to demographically matched controls found that the SCD group obtained significantly lower scores on measures of overall IQ, and verbal and nonverbal reasoning (Castro & Viana, Reference Castro and Viana2019). A meta-analytic study found that infants and preschool-age children had deficits in full-scale IQ (FSIQ), verbal reasoning, executive functioning, and attention, while school-age children and adults demonstrated deficits in each of these areas as well as in processing speed and perceptual reasoning (Prussien et al., Reference Prussien, Jordan, DeBaun and Compas2019). Despite these findings, underlying causes of cognitive challenges in SCD remain unclear. Concerns about potential bias in neuropsychological tests (e.g., Gasquoine, Reference Gasquoine2022; Reynolds et al., Reference Reynolds, Altmann and Allen2021) and the fact that the majority of individuals with SCD in the United States are Black raises possibility that measurement problems may explain lower cognitive test scores among SCD patients. However, research showing differences between SCD patients compared to siblings (Carlson et al., Reference Carlson, Al Ghriwati, Wolters, Anne Tamula, Tisdale, Fitzhugh and Martin2023) or demographically matched controls (Gasquoine et al., Reference Gasquoine2022) suggests that these concerns are not fully accounted for by cultural, familial, or test related factors.
The cause of cognitive deficits among individuals with SCD is likely multifactorial. Associations between biological characteristics and decreased cognitive functioning are well established; for example, a study of 96 sickle cell patients between the ages of 6–24 years old found that severe anemia, stroke history, low fetal hemoglobin, and cerebral blood flow were associated with various cognitive outcomes (Ruffieux et al., Reference Ruffieux, Njamnshi, Wonkam, Hauert, Chanal, Verdon, Fonsah, Eta, Doh, Ngamaleu, Kengne, Fossati and Sztajzel2013). At the same time, associations between environmental and psychosocial factors and cognitive functioning are well documented both in the general population (Peyre et al., Reference Peyre, Bernard, Hoertel, Forhan, Charles, De Agostini, Heude and Ramus2016) and in SCD specifically (Yarboi et al., Reference Yarboi, Compas, Brody, White, Rees Patterson, Ziara and King2017). King et al. (Reference King, Strouse, Rodeghier, Compas, Casella, McKinstry, Noetzel, Quinn, Ichord, Dowling, Miller. and DeBaun2014) found that among children with SCD, home environment characteristics such as parent education and household income, as well as disease-related factors (e.g., history of silent stroke,) both predicted FSIQ. In fact, parent education was associated with a greater change IQ than history of silent stroke. (King et al., Reference King, Strouse, Rodeghier, Compas, Casella, McKinstry, Noetzel, Quinn, Ichord, Dowling, Miller. and DeBaun2014).
Research examining the relationships between environmental factors and cognitive and academic development frequently focuses on the role of broad socioeconomic variables such as household income or parent education (Heitzer et al., Reference Heitzer, Schreiber, Yuan, Wang, Pan, Graff, Murphy, Rupff, Russell, Wang, Estepp, Hankins, Porter and Jacola2022; King et al., Reference King, Strouse, Rodeghier, Compas, Casella, McKinstry, Noetzel, Quinn, Ichord, Dowling, Miller. and DeBaun2014; Yarboi et al., Reference Yarboi, Compas, Brody, White, Rees Patterson, Ziara and King2017). While such variables are relatively easy to ascertain, it is important to consider that they are likely proxies for other environmental factors. Several features of the home environment, such as cognitive stimulation, physical characteristics of the home, and parenting style, have been found to mediate the relationship between SES and intellectual development (Guo & Harris, Reference Guo and Harris2000). A study by Whitaker et al. (Reference Whitaker, Yoo, Vandell, Duncan and Burchinal2023) provides compelling evidence supporting the particular importance of home environment factors in promoting long-term outcomes. Specifically, they found that cognitive stimulation in the home, but not in care/education settings outside the home was associated with increased academic functioning in adolescence and early adulthood, even when controlling for relevant demographic and environmental variables (Whitaker et al., Reference Whitaker, Yoo, Vandell, Duncan and Burchinal2023).
Given the unique interplay of medical, psychosocial, and cognitive risk factors in SCD, the identification of variables that support cognitive and academic development is particularly important and has the potential to inform interventions. A recent study by our group found that compared to demographically matched controls, preschool-age children with SCD performed significantly worse on tests of working memory and school readiness and had higher rates of parent-reported executive dysfunction. Subsequent analyses found that for the SCD group, caregiver education level was associated with school readiness after controlling for patient sex, age, genotype, and functional independence (Heitzer et al., Reference Heitzer, Schreiber, Yuan, Wang, Pan, Graff, Murphy, Rupff, Russell, Wang, Estepp, Hankins, Porter and Jacola2022). The current study expanded on the findings from Heitzer et al. (Reference Heitzer, Schreiber, Yuan, Wang, Pan, Graff, Murphy, Rupff, Russell, Wang, Estepp, Hankins, Porter and Jacola2022) by examining home stimulation data collected from a subset of participants in this same study. Specifically, the current study aimed to identify features of the home environment that are associated with overall cognitive ability, working memory, and school readiness among preschool-age children with SCD.
Method
Patients between 48 and 68 months old were recruited through the pediatric sickle cell program at St Jude Children’s Research Hospital to participate in a study with the primary aim of examining working memory and school readiness among children with SCD compared to demographically matched controls (i.e., the Heitzer et al., Reference Heitzer, Schreiber, Yuan, Wang, Pan, Graff, Murphy, Rupff, Russell, Wang, Estepp, Hankins, Porter and Jacola2022 study described above). In addition to age, inclusion criteria included a primary diagnosis of SCD (any genotype) and English as the primary language. Exclusion criteria included sensory/motor impairment that would preclude valid testing (e.g., blindness) and enrollment in kindergarten at the time of the assessment. The study was approved by an institutional review board at St Jude Children’s Research Hospital and all parents signed informed consent prior to data collection. This research was completed in accordance with the Helinski Declaration.
Measures
Patient/family demographic information including caregiver education, household income, and patient ethnicity was collected from a questionnaire completed by caregivers. Patient medical/treatment history was obtained from medical records.
Dependent Variables: cognitive and academic measures. The Stanford–Binet Intelligence Scales – Fifth Edition (SB-5; Roid, Reference Roid2005) is a performance-based measure that was used to assess overall cognitive ability (i.e., full scale IQ/FSIQ), and provide a composite score in working memory. On the SB-5, each composite score is comprised of one verbal and one nonverbal subtest. The FSIQ reflects the combined verbal and nonverbal subtest scores across all domains. For the nonverbal working memory section of the SB-5, initial items involve a “delayed response” task in which the examinee watches the examiner hide a small toy under one of three cups, and is then prompted to identify the cup hiding the toy after a brief delay. Later items involve a “block span” task in which the examinee observes and then replicates a block tapping sequence. For the verbal working memory section of the SB-5, the examinee is prompted to repeat a sentence spoken by the examiner. For later items, the examinee answers a set of questions and is then asked to recall the last word of each sentence. Higher FSIQ and working memory composite scores indicate better cognitive ability.
The Bracken Basic Concepts Scale – Third Edition: Receptive (BBCS-3: R; Bracken, Reference Bracken1984) is a performance-based measure that was used to assess pre-academic knowledge, including colors, letters, numbers/counting, sizes and comparisons, and shapes. Higher scores indicate better school pre-academic skills.
The Behavior Rating Inventory of Executive Function – Preschool Version (BRIEF-P; Gioia et al., Reference Gioia, Isquith, Guy and Kenworthy2000) is a caregiver-report measured that was used to assess executive functioning. The BRIEF-P is a 63-item questionnaire that provides scores for five clinical scales (Inhibit, Shift, Emotional Control, Working Memory, and Plan/Organize), three indices (Inhibitory Self-Control, Flexibility, and Emergent Metacognition), and one composite score (Global Executive Composite).
All dependent variables have established validity and reliability and are widely used to measure these skills in children in research and clinical settings. Each measure is standardized by age. On the SB-5 and the BBCS-3, raw scores are converted to standard scores (M = 100, SD = 15) and higher scores indicate better cognitive performance. On the BRIEF-P, raw scores are converted to t-scores (M = 50, SD = 10). Higher scores indicate higher levels of executive dysfunction and t-scores ≥65 are considered clinically significant.
Independent Variables: Stimulation in the Home Environment. The Early Childhood Home Observation for Measurement of the Environment (HOME) Inventory (Caldwell & Bradley, Reference Caldwell and Bradley2003) measures the quality and quantity of stimulation and support available in the home environment for children between ages 3 and 6 years. The measure consists of 55 yes/no items that are completed by collecting information during a 45–90-minute semi-structured observation and interview that takes place in the child’s home at a time when the child and his/her primary caregiver are both present. In addition to a total score, the HOME inventory includes the following subscales: Learning Materials (presence of several types of toys and activities), Language Stimulation (verbal communication between child and caregiver), Physical Environment (safety, cleanliness), Responsivity (caregiver’s emotional and verbal responsivity), Academic Stimulation (caregiver involvement and encouragement in child’s development), Modeling (caregiver encouragement of desirable behaviors by example and/or by setting limits for behaviors such as food and television use), Variety (indoors and outdoors activities available), and Acceptance (caregiver discipline). Higher scores indicate greater levels of stimulation in the home environment. The HOME inventory has demonstrated good internal consistency across racial/ethnic groups within the united states (Sugland et al., Reference Sugland, Zaslow, Smith, Brooks-Gunn, Coates, Blumenthal and Bradley1995).
Procedures
Upon enrollment, participants completed cognitive and pre-academic skills assessments, and caregivers completed questionnaires rating patient executive functioning. The HOME inventory was completed during an optional follow-up visit at the participant’s home within 6 months following the initial assessment. Two research assistants who administered and scored the HOME inventory collaboratively attended each in-home visit. Data was collected between September 2014 and February 2017. The average time between the initial assessment and the administration of the HOME inventory was 28.5 days (range: 4–182 days). Most (69%) HOME visits were completed within 30 days following the initial assessment, and all but one visit was completed within two months.
Statistical analyses
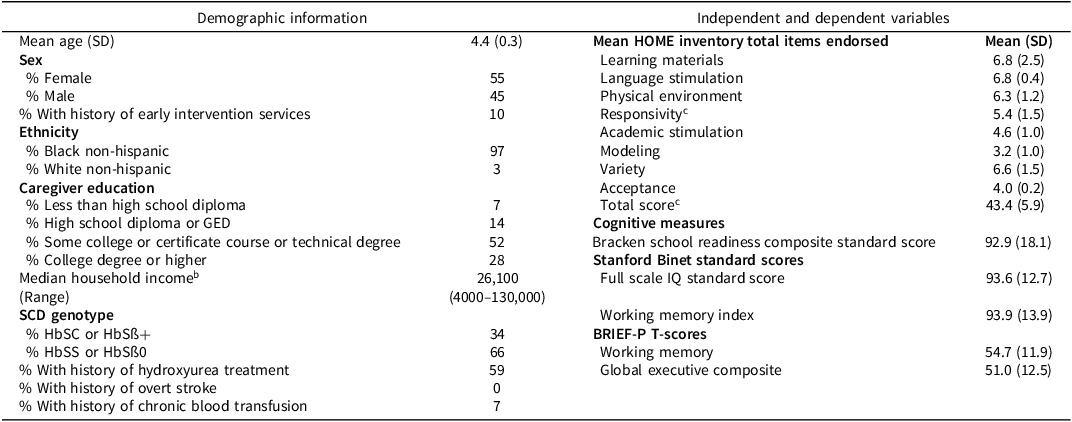
Descriptive statistics were calculated for participant demographic information, cognitive and academic testing scores, and HOME inventory scores (Table 1). Chi-Square and independent T-Tests were used to compare the group of participants who completed the HOME inventory to those who did not on demographic, medical, and cognitive/academic variables. Linear regression models were used to examine the relationship between each of the HOME inventory scales and each of the following variables: SB-5 FSIQ and working memory composite scores, BBCS-3 total score, BRIEF-P Working Memory scale and Global Executive Composite. Each regression model controlled for genotype (HbSC and HbSβ+ thalassemia vs HbSS and HbSβ° thalassemia).
Descriptive statistics for the samplea

Table 1. Long description
The table presents demographic information and cognitive measures for a sample. It has two main sections: Demographic information and Independent and dependent variables. The Demographic information section includes mean age, sex distribution, history of early intervention services, ethnicity, caregiver education, median household income, SCD genotype, history of hydroxyurea treatment, and history of chronic blood transfusion. The Independent and dependent variables section lists mean HOME inventory total items endorsed for various categories such as learning materials, language stimulation, physical environment, responsivity, academic stimulation, modeling, variety, acceptance, and total score. It also includes cognitive measures like Bracken school readiness composite standard score, Stanford Binet standard scores for full-scale IQ and working memory index, and BRIEF-P T-scores for working memory and global executive composite. The table provides specific values for each category and measure. For example, the mean age is 4.4 (0.3), with 55 percent female and 45 percent male participants. The ethnicity is predominantly Black non-Hispanic at 97 percent. Caregiver education levels vary, with 52 percent having some college or certificate course or technical degree. The median household income is 26,100 USD. The SCD genotype distribution shows 34 percent HbSC or HbS beta-thalassemia positive and 66 percent HbSS or HbS beta-zero thalassemia. History of hydroxyurea treatment is noted in 59 percent of participants. Cognitive measures include a Bracken school readiness composite standard score of 92.9 (18.1), a full-scale IQ standard score of 93.6 (12.7), and a working memory index of 93.9 (13.9). BRIEF-P T-scores are 54.7 (11.9) for working memory and 51.0 (12.5) for the global executive composite.
a n = 29 unless otherwise noted.
b Household Income, n = 24.
c HOME Responsivity and Total score, n = 28.
Linear regression assumptions, including normality of residuals and homoscedasticity, were evaluated using the Shapiro–Wilk and Breusch–Pagan tests, respectively, alongside assessments of Cook’s Distance to identify any highly influential observations. Furthermore, Variance Inflation Factors (VIF) were calculated across models. Results from these diagnostic assessments confirmed that the linear assumptions were adequately met for the analyzed models, and VIF values were uniformly low (<5), verifying the absence of problematic multicollinearity among regression predictors. Given the exploratory nature of this study and the relatively small sample size (N = 29), no formal correction for multiple comparisons was applied. All results are presented with exact p-values and should be interpreted as preliminary, pending replication in larger independent samples. Although visual scatterplot inspection revealed an outlier case for models with the HOME Acceptance scale and BRIEF scores, this case was retained to avoid introducing selection bias in a small sample.
Results
Sample characteristics
Out of eighty-four participants (n = 84) enrolled in the primary study, twenty-nine completed the optional visit for administration of the HOME inventory (n = 29). Comparisons between participants who completed the HOME inventory and those who did not, revealed that the HOME Inventory group reported more pain events requiring hospitalization (HOME group M events = 0.5, SD = 0.8 versus M events = 0.1, SD = 0.3). No other significant differences between the groups were found. The HOME Inventory group was 55% female (n = 16) and had a mean age of 4.4 years (SD = 0.3) at the time of the initial cognitive evaluation. Most caregivers had completed some college, certificate course, or technical degree (52%) or had a college degree or higher (27%). The median household income for the sample was $26,100, ranging from $4,000 to $130,000. For reference, the median household income in the United States during the years of data collection ranged from $53,660 in 2014 to $61,370 in 2017 (U.S. Census Bureau, 2024).
The majority (n = 19, 65.5%) of the sample had either HbSS or HbSβ0 – thalassemia with the remaining 10 participants (34.4%) having HbSC or HbSβ+thalassemia genotypes. Seventeen (59%) of the 29 participants received hydroxyurea. The mean number of pain events requiring hospitalization for the sample was 0.5 (SD = 0.8). None of the patients in the sample had a history of stroke. Mean standard scores were in the average range for the SB-5 scale (proportion of scores below −1.5z = 0.1) and the BBCS-3 (proportion of scores below −1.5z = 0.14). Mean t-scores were in the average range for the BRIEF-P Working Memory scale (proportion of scores in the clinically significant range = 0.17 and the BREIF-P Global Executive Composite (proportion of scores in the clinically significant range = 0.14).
Regression results
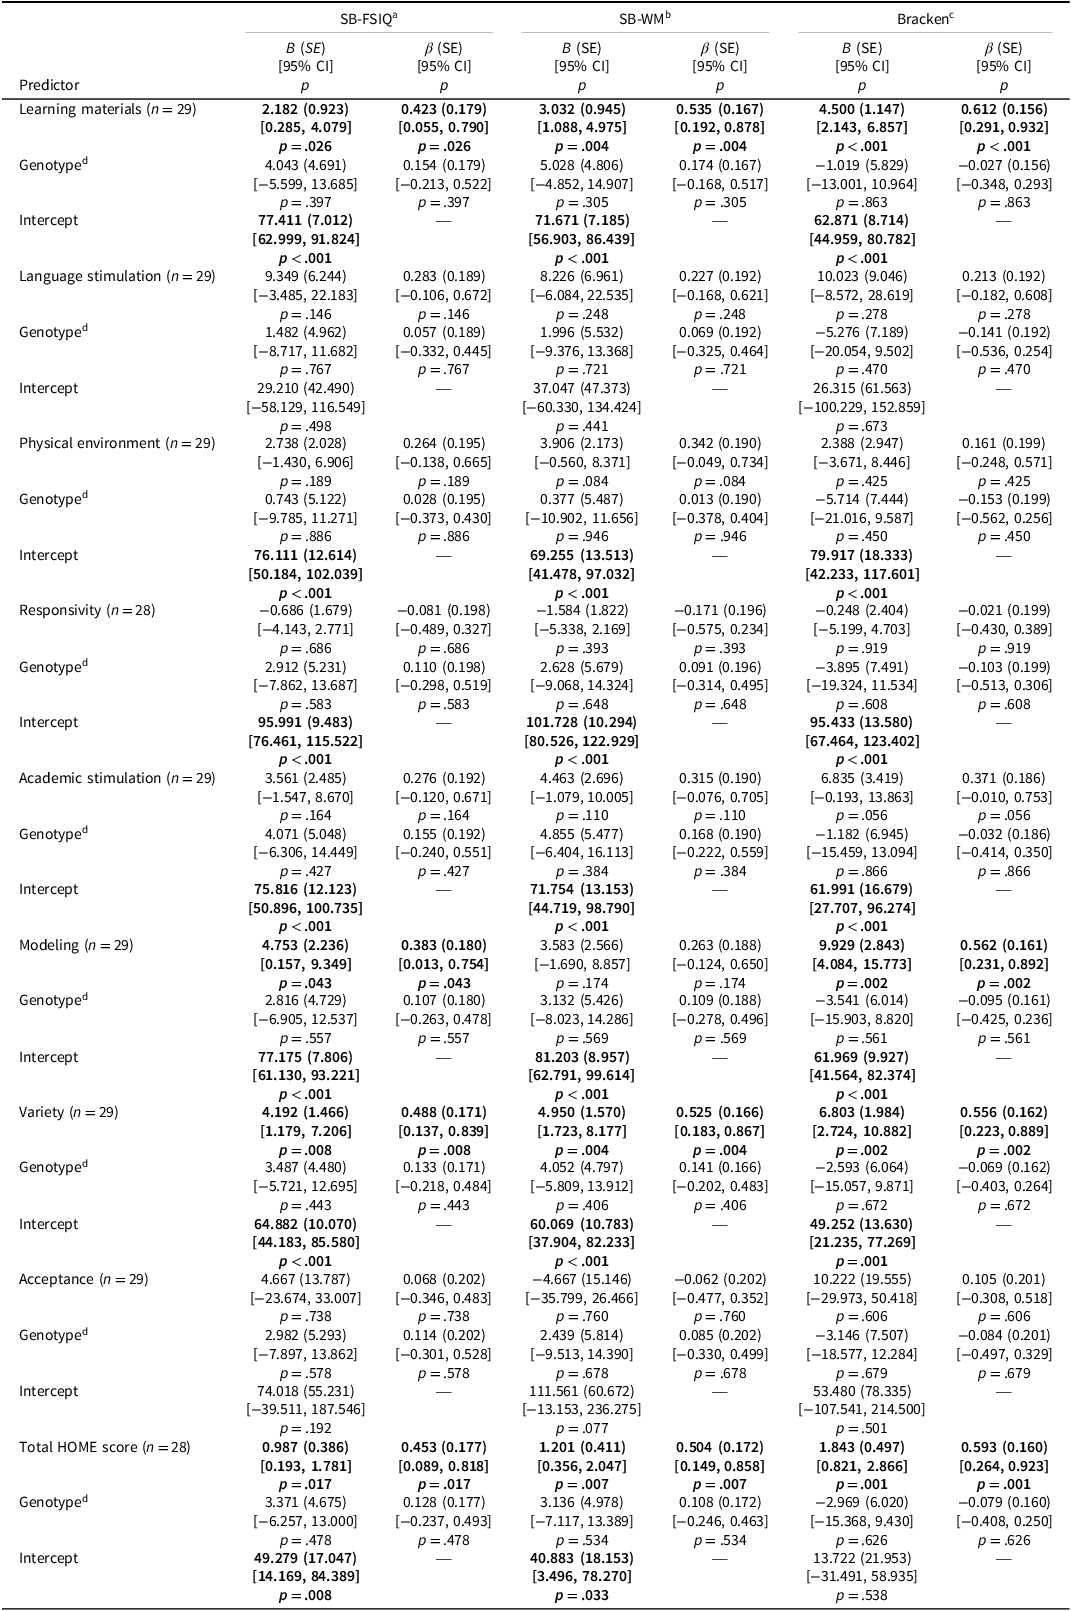
Please see Table 2 and Table 3 for comprehensive regression results. The total score from the HOME inventory was found to predict overall IQ (β = 0.453, p = .017), working memory (β = 0.504, p = .007), and school readiness (β = 0.593, p=.001).
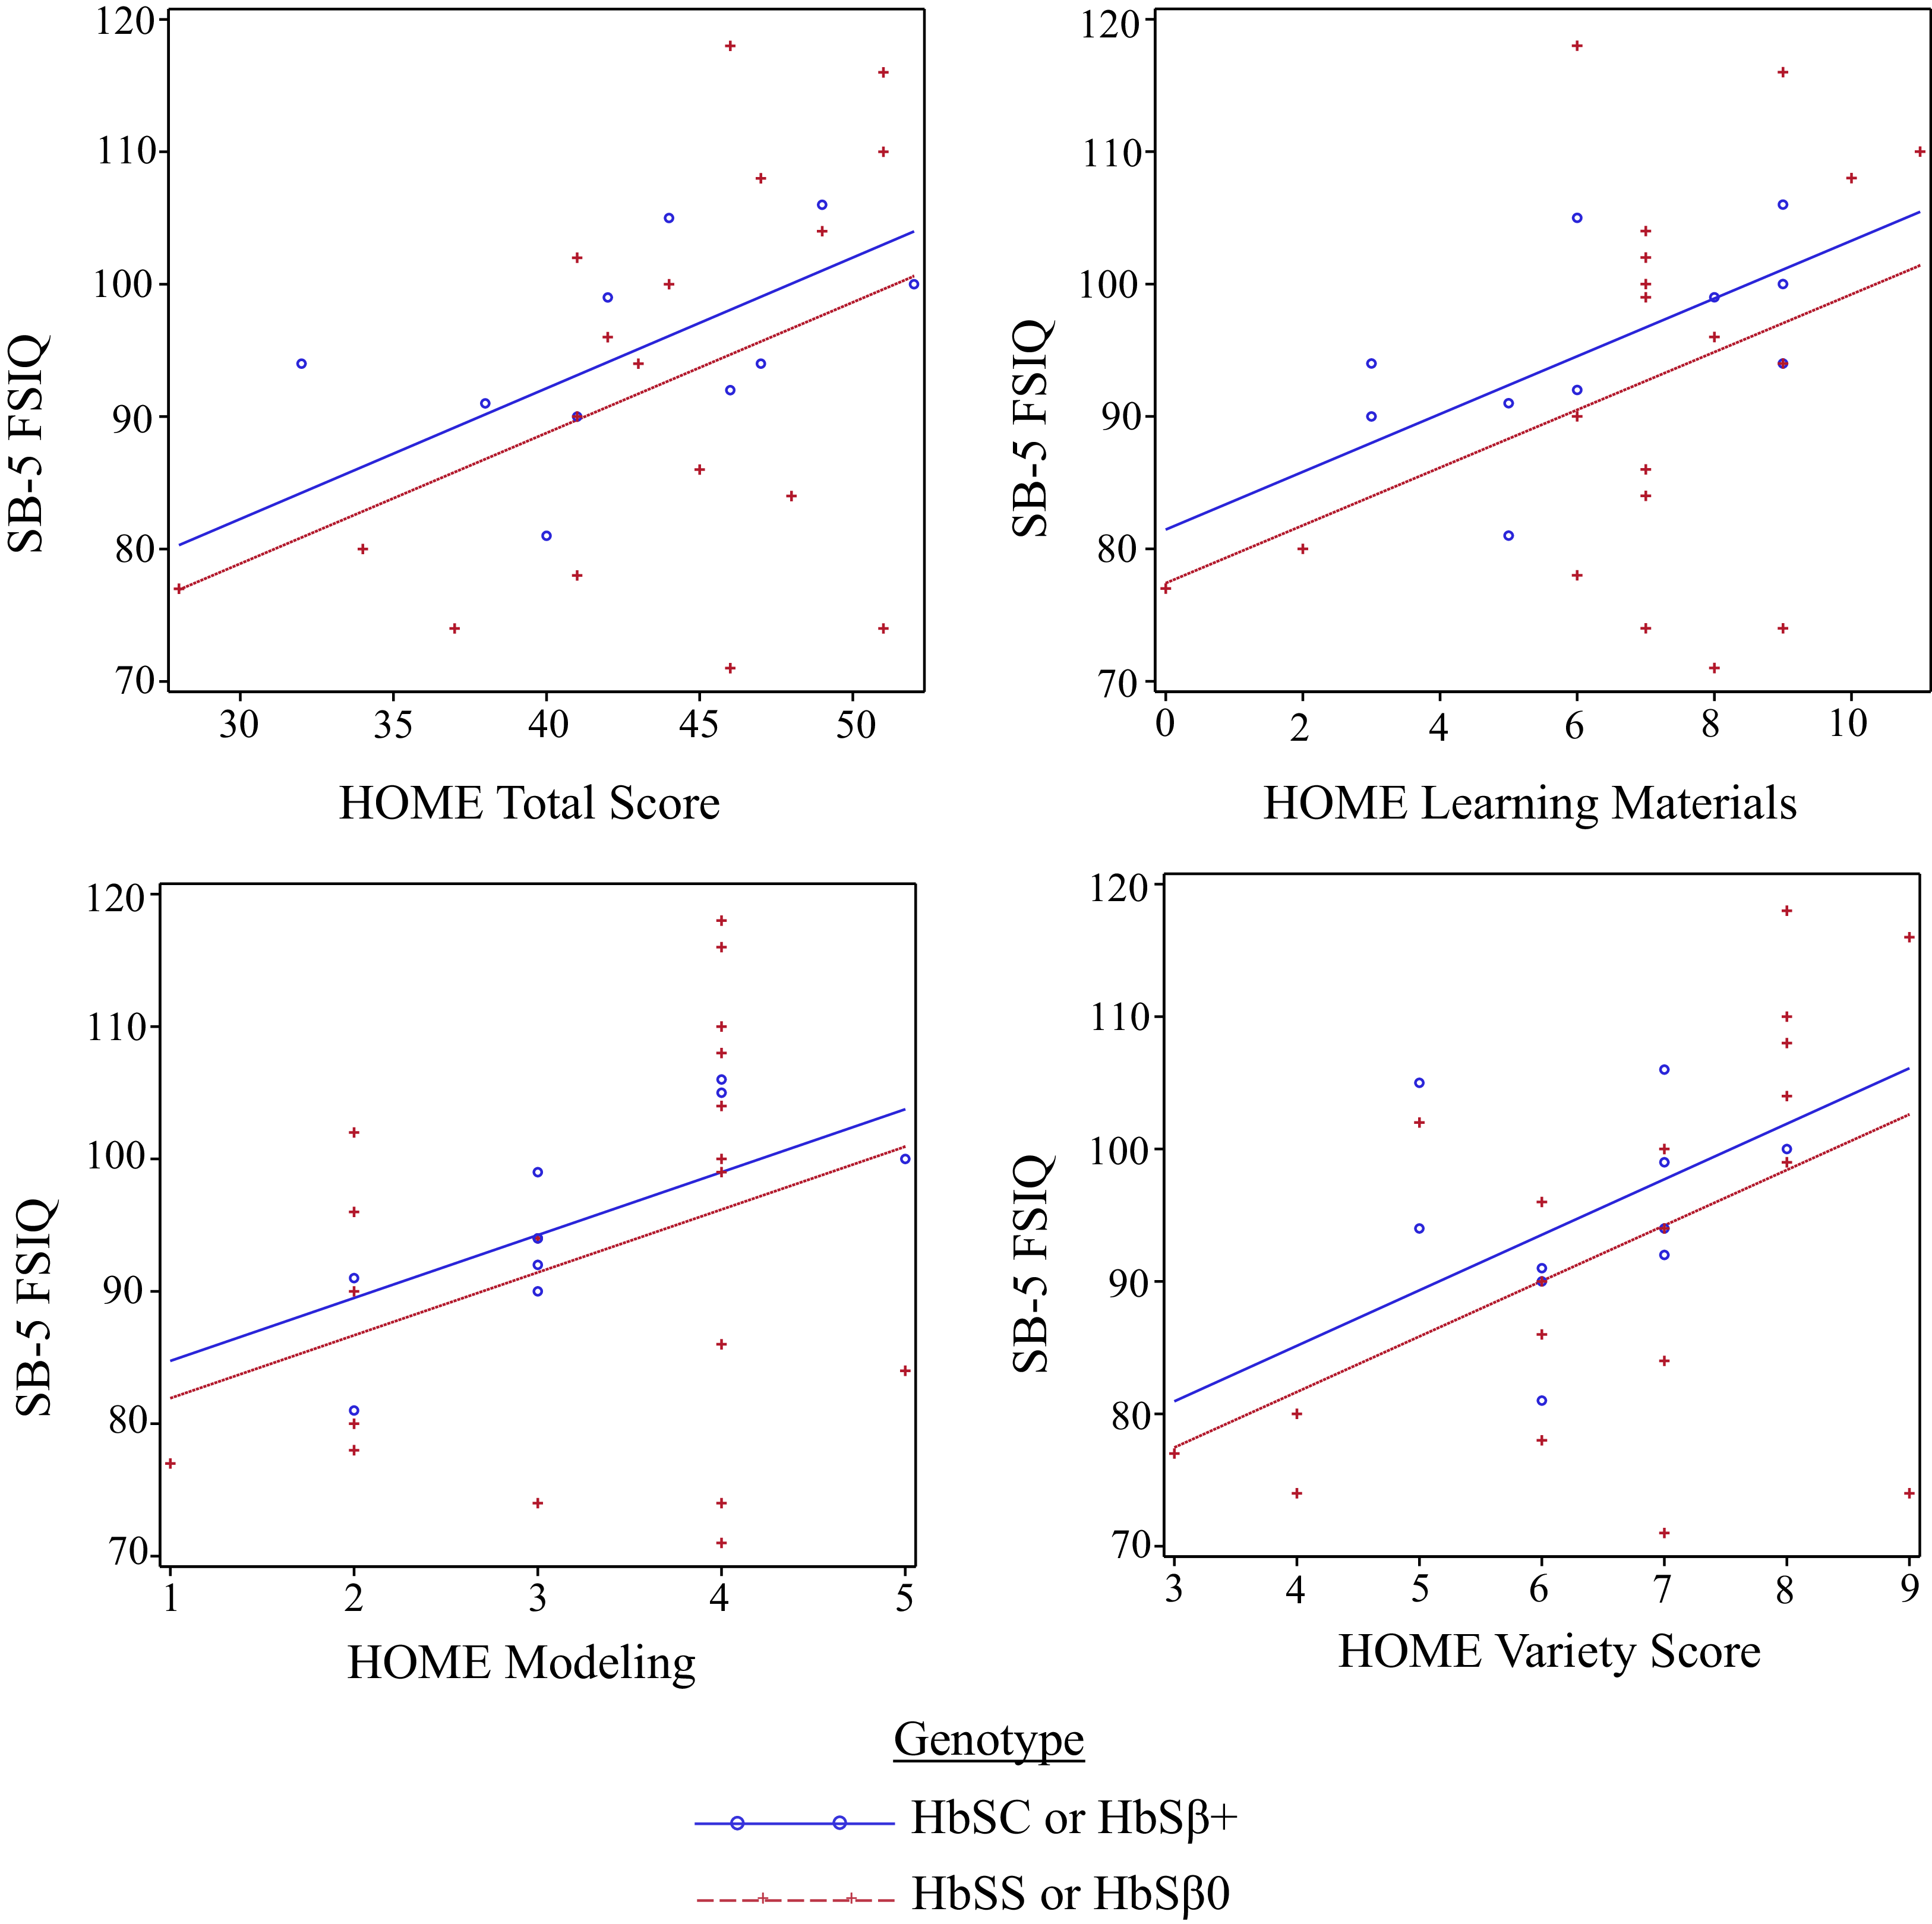
Among the subscales of the HOME inventory, Learning Materials (β = 0.423, p = .026), Modeling (β = 0.383, p = .043), and Variety (β = 0.488, p = .008) were each associated with IQ. Analysis of covariance plots of the models that were associated with FSIQ are shown in Figure 1.
Analysis of covariance plots for models that were associated with Stanford–Binet full scale IQ (FSIQ) Score.

Figure 1. Long description
Four scatter plots analyze the relationship between HOME scores and Stanford-Binet full scale IQ (FSIQ) scores, differentiated by genotype. Panel A: The scatter plot shows the relationship between HOME Total Score and SB-5 FSIQ. The x-axis represents HOME Total Score ranging from 30 to 50, and the y-axis represents SB-5 FSIQ ranging from 70 to 120. Two genotypes are represented: HbSC or HbSβ+ (blue circles) and HbSS or HbSβ0 (red crosses). The blue line indicates a positive correlation for HbSC or HbSβ+, while the red line shows a slightly less steep positive correlation for HbSS or HbSβ0. Panel B: The scatter plot shows the relationship between HOME Learning Materials and SB-5 FSIQ. The x-axis represents HOME Learning Materials ranging from 0 to 10, and the y-axis represents SB-5 FSIQ ranging from 70 to 120. The blue line indicates a positive correlation for HbSC or HbSβ+, while the red line shows a slightly less steep positive correlation for HbSS or HbSβ0. Panel C: The scatter plot shows the relationship between HOME Modeling and SB-5 FSIQ. The x-axis represents HOME Modeling ranging from 1 to 5, and the y-axis represents SB-5 FSIQ ranging from 70 to 120. The blue line indicates a positive correlation for HbSC or HbSβ+, while the red line shows a slightly less steep positive correlation for HbSS or HbSβ0. Panel D: The scatter plot shows the relationship between HOME Variety Score and SB-5 FSIQ. The x-axis represents HOME Variety Score ranging from 3 to 9, and the y-axis represents SB-5 FSIQ ranging from 70 to 120. The blue line indicates a positive correlation for HbSC or HbSβ+, while the red line shows a slightly less steep positive correlation for HbSS or HbSβ0.
The Learning Materials (β = 0.535, p = .004) and Variety (β = 0.525, p = .004) subscales were each associated with working memory. The Learning Materials (β = 0.612, p < .001), Modeling (β = 0.562, p = .002), and Variety (β = 0.556, p = .002) subscales were each associated with school readiness. Genotype was not significant in any regression analyses with performance-based measures.
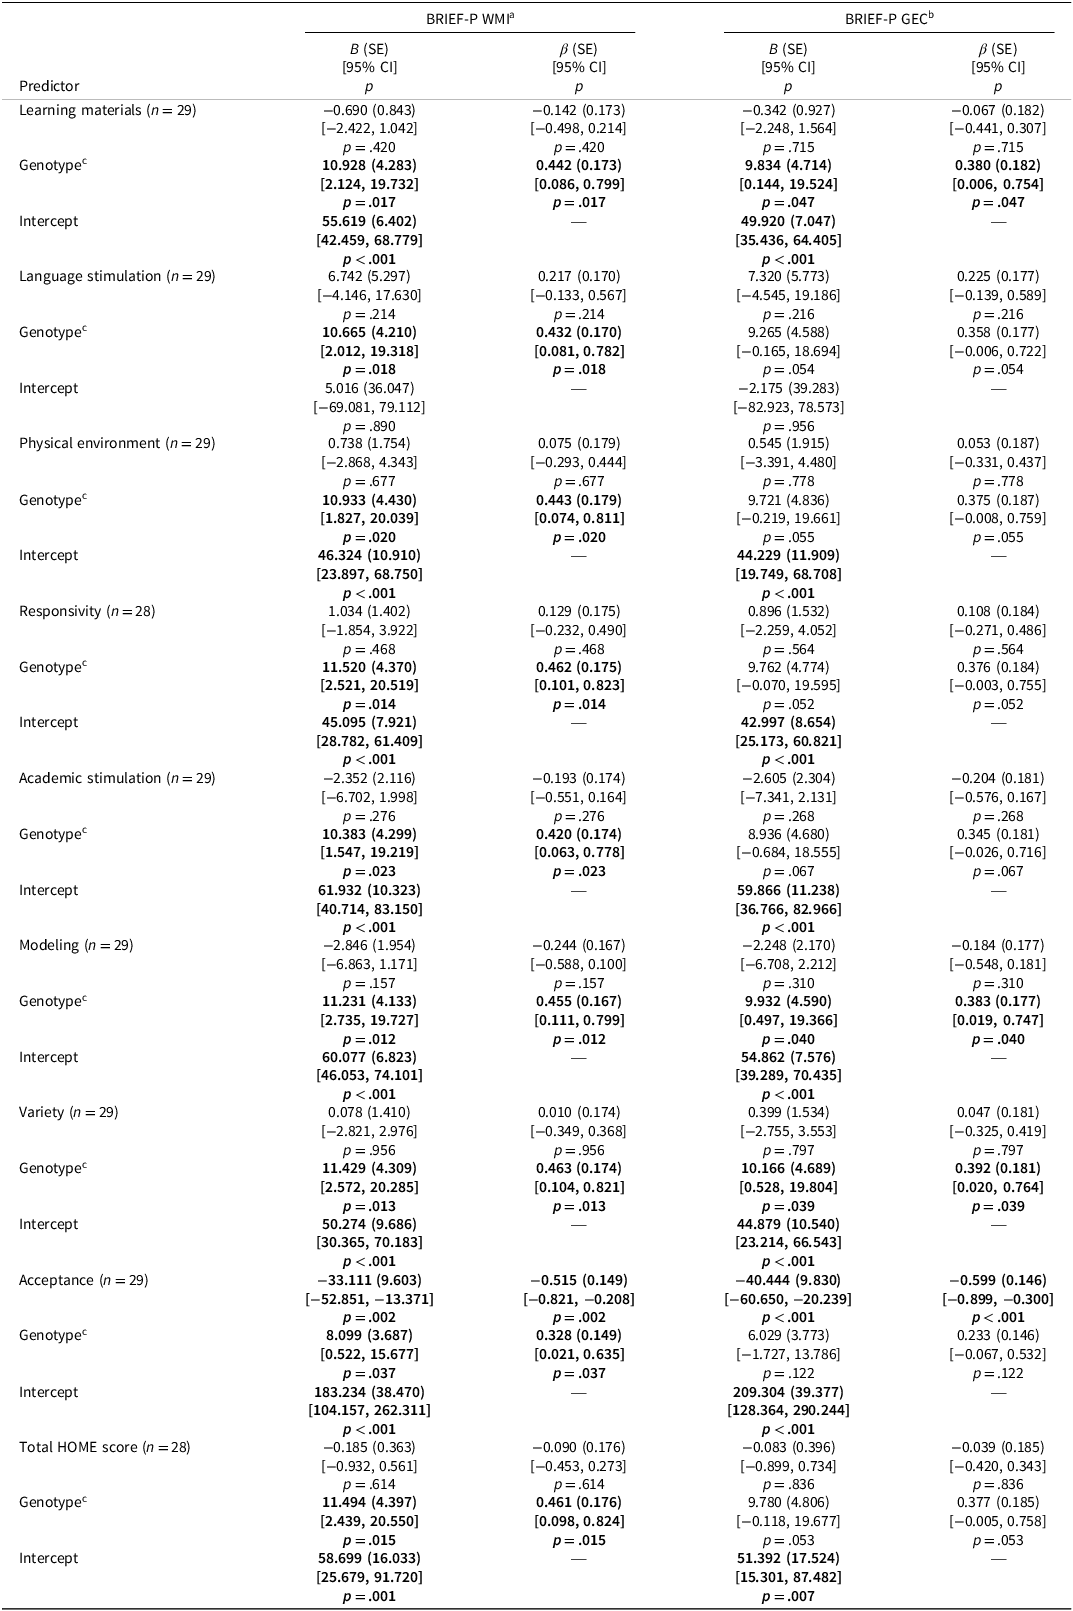
With regard to caregiver-reported executive functioning, the Acceptance subscale of the HOME inventory was associated with caregiver reported BRIEF Working Memory and BRIEF Global Executive Composite Scores (β = − 0.515, p = .002); (β = − 0.599, p < .001, respectively). Additionally, genotype was a significant covariate (β = 0.328, p = .037) in the model with HOME Acceptance and BRIEF Working Memory such that participants with a more severe genotype had fewer caregiver reported working memory problems. However, inspection of scatter plots indicated that models with the Acceptance subscale and the BRIEF Working Memory Global Executive Composite Scores were driven by an outlier case with a low score on the Acceptance subscale and high scores on the BRIEF-P scales.
Discussion
Individuals with SCD are at risk for deficits in working memory and academic development with cognitive difficulties emerging in infancy and early childhood (Prussien et al., Reference Prussien, Jordan, DeBaun and Compas2019). Environmental factors such as SES have been found to influence cognitive development, both in the general population (Peyre et al., Reference Peyre, Bernard, Hoertel, Forhan, Charles, De Agostini, Heude and Ramus2016) and among individuals with SCD (Yarboi et al., Reference Yarboi, Compas, Brody, White, Rees Patterson, Ziara and King2017). Given the wide range of psychosocial comorbidities in SCD, a thorough understanding of modifiable environmental factors that influence cognitive and academic development is key to understanding how to best mitigate cognitive risk.
Heitzer et al. (Reference Heitzer, Schreiber, Yuan, Wang, Pan, Graff, Murphy, Rupff, Russell, Wang, Estepp, Hankins, Porter and Jacola2022) found that caregiver education was associated with school readiness among preschool-age children with SCD. The current study provided a closer examination of the resource-based factors related to cognitive and preacademic outcomes in a subset of the Heitzer et al. (Reference Heitzer, Schreiber, Yuan, Wang, Pan, Graff, Murphy, Rupff, Russell, Wang, Estepp, Hankins, Porter and Jacola2022) sample. Specific aspects of the home environment were associated with school readiness, IQ, and working memory emphasizing the importance of cognitively engaging materials and interactions for preschoolers with SCD. Specifically, having a variety of activities available, and caregiver use of boundaries may be particularly important in supporting early cognitive and academic development, thus providing insight into potential targets for interventions.
In comparison to performance-based cognitive measures, findings were less clear on how home stimulation is associated with caregiver reported measures of executive functioning skills, as an outlier case accounted for one of the two HOME subscales associated with the BRIEF-P. Differences between caregiver-report and performance-based testing outcomes are not uncommon in the literature and may reflect discrepancies in subjective difficulties that parents notice in day-to-day life and isolated cognitive skills measured on standardized testing (Kim, Reference Kim2021). Furthermore, findings suggested that more severe genotype was associated with fewer working memory problems. However, Heitzer et al. (Reference Heitzer, Schreiber, Yuan, Wang, Pan, Graff, Murphy, Rupff, Russell, Wang, Estepp, Hankins, Porter and Jacola2022) did not find genotype to be a significant predictor of caregiver-reported working memory problems in the larger sample, suggesting that this finding may be unique to this smaller group.
Results of the current study support the idea that environmental factors may be particularly important for cognitive and academic development in young children with SCD. Longitudinal research on SCD indicated that younger patients have higher rates of treatment utilization and lower rates of SCD related complications (Blinder et al., Reference Blinder, Vekeman, Sasane, Trahey, Paley and Duh2013). Environmental factors may potentially have more impact on cognitive development at younger ages because of early neuroplasticity. For instance, Avants et al. (Reference Avants, Hackman, Betancourt, Lawson, Hurt and Farah2015) found that cortical thickness of the brain in adolescence was predicted by environmental stimulation (measured on the HOME inventory) at age 4 but not at age 8. Thus, for SCD patients in particular, early childhood may represent a period of opportunity for supporting optimal growth and building resilience against future medical and environmental disruptions. These findings also contribute to a broader body of research supporting the importance of household factors in mitigating medical risks for developmental disruption (e.g., McMahon et al., Reference McMahon, Treyvaud, Spencer-Smith, Spittle, Lee, Doyle and Anderson2022).
Several studies provide promising evidence that interventions targeting environmental/home stimulation factors can potentially improve cognitive functioning in young children. Suardi et al. (Reference Suardi, Anshari and Samad2019), developed an intervention package (i.e., a parent book and manual) that focused on helping mothers increase cognitive stimulation and interaction in play activities. Results showed increased cognitive functioning when comparing pre-and post-intervention skills. Another study found that infants and toddlers with SCD demonstrated improved cognitive functioning following a home visitation intervention focused on educating caregivers on child development, the parent–child relationship, and language acquisition. Consistent with findings from the current study, families who received this intervention demonstrated improvements in nearly all subscales, with learning materials showing the greatest improvement (Fields et al., Reference Fields, Hoyt-Drazen, Abel, Rodeghier, Yarboi, Compas and King2016). Based on the results of the current study, future research could examine the feasibility and efficacy of interventions that focus on providing caregiver education as well as resources to help families obtain tools (e.g., learning-based toys and museum passes) to promote cognitive stimulation in the home.
The primary limitation of this study is that the sample is relatively small (n = 29) and self-selected, as participation in the home-based administration of the HOME inventory was an optional component of the larger project. Future research with a more robust sample and a primary focus on assessing cognitive stimulation in the home will be important to provide further support for the current findings. Longitudinal studies of cognitive and academic development should include measures of home stimulation to provide insight into the continuing benefits of home-based stimulation. The inclusion of measuring the variety of cognitively engaging materials and caregiver use of boundaries may be especially useful given the current findings. In clinical settings, it will be useful for providers to educate families on the importance of these factors and connect them to relevant resources.
Finally, it would be beneficial for future research examining cognitive stimulation in young SCD patients to further explore caregiver education and household income. In the present study, five caregivers did not report household income, which is notable in this small sample. Further, the sample was somewhat unusual in that caregivers reported a low median income ($26,100) relative to caregiver education (52% with some college, certificate or technical degree, and 28% with a college degree or higher). It is possible that other factors such as regional differences in income and financial burdens associated with caring for a child with SCD may help explain this pattern. Indeed, recent research has demonstrated employment losses and subsequent economic costs associated with caring for a child with SCD (Gordon et al., Reference Gordon, Welkie, Quaye, Hankins, Kassim, Thompson and Cronin2024).
In conclusion, the current study revealed associations between aspects of cognitive stimulation in the home and cognitive and academic performance in young children with SCD. Research suggests that there are many factors that contribute to cognitive functioning in this population including biological and social–cultural variables (Peyre et al., Reference Peyre, Bernard, Hoertel, Forhan, Charles, De Agostini, Heude and Ramus2016; Ruffieux et al., Reference Ruffieux, Njamnshi, Wonkam, Hauert, Chanal, Verdon, Fonsah, Eta, Doh, Ngamaleu, Kengne, Fossati and Sztajzel2013). Results from this study suggest that environmental stimulation is also important. Thus, an early focus should be on developing interventions that provide caregiver education and family resources. The higher rate of health care resource utilization early in life creates more opportunities to provide such interventions.
Linear regression results for HOME subscales predicting cognitive outcomes (SB-FSIQ, SB-WM, Bracken), controlling for genotype

Table 2. Long description
A table with 29 rows and 12 columns presenting linear regression results for HOME subscales predicting cognitive outcomes (SB-FSIQ, SB-WM, Bracken), controlling for genotype. The columns are labeled with predictors and their respective B (SE) [95% CI] p values for SB-FSIQ, SB-WM, and Bracken. The rows are grouped by different subscales: Learning materials, Language stimulation, Physical environment, Responsivity, Academic stimulation, Modeling, Variety, Acceptance, and Total HOME score. Each subscale includes data for genotype f and intercept. Notable trends include significant p-values for various predictors across different subscales, indicating their impact on cognitive outcomes. For example, Learning materials show significant p-values for SB-FSIQ and Bracken, while Variety shows significant p-values for all three cognitive outcomes. The table provides a detailed comparison of how different HOME subscales and genotype influence cognitive outcomes.
Note: B = unstandardized regression coefficient; SE = standard error; 95% CI in brackets; p = p-value; β = standardized regression coefficient (all variables z-scored within each model’s complete-case sample).
“—” means not applicable (intercept).
Bold = p < .05.
a Stanford–Binet Full-Scale IQ Score.
b Stanford–Binet Working Memory composite score.
c Bracken Basic Concepts Scale.
d HbSC/HbSβ+ thalassemia vs HbSS/HbSβ° thalassemia.
Linear regression results for HOME subscales predicting executive function (BRIEF-P WMI, BRIEF-P GEC), controlling for genotype

Table 3. Long description
A table with linear regression results for HOME subscales predicting executive function (BRIEF-P WMI, BRIEF-P GEC), controlling for genotype. The table has 12 rows and 10 columns. Column headers are: Predictor, B (SE) [95% CI], p, B (SE) [95% CI], p, B (SE) [95% CI], p, B (SE) [95% CI], p. Row labels include Learning materials, Language stimulation, Physical environment, Responsivity, Academic stimulation, Modeling, Variety, Acceptance, Total HOME score. Each row provides regression coefficients, standard errors, 95% confidence intervals, and p-values for each predictor. Notable trends include significant p-values for Genotype f across various subscales, indicating its impact on executive function. Specific values and detailed trends are visible in the table.
Note: B = unstandardized regression coefficient; SE = standard error; 95% CI in brackets; p = p−value; β = standardized regression coefficient (all variables z-scored within each model’s complete-case sample).
“—” means not applicable (intercept).
Bold = p < .05.
a BRIEF-P Working Memory Index.
b BRIEF-P Global Executive Composite.
c HbSC/HbSβ+ thalassemia vs HbSS/HbSβ° thalassemia.
Supplementary material
The supplementary material for this article can be found at https://doi.org/10.1017/S1355617726102136.
Acknowledgements
This work was supported by the American Lebanese Syrian Associated Charities (ALSAC) and the National Cancer Institute (P30 CA21765 and GM92666 to St Jude Children’s Research Hospital), Andrew M. Heitzer was supported by K23HL166697 (National Heart, Lung, and Blood Institute) during the time of this study. Competing interests: None.


 Open access

