Introduction
Traditionally, cereals were harvested at a moisture concentration less than 200 g/kg and either treated with propionic acid or dried prior to storage for subsequent feeding to beef and dairy cattle. Previous studies have clearly shown that wheat and barley have a similar feed value when offered to beef cattle (Steen, Reference Steen1993). Higher yields of grain are achievable from wheat, particularly winter wheat, relative to barley. Many studies undertaken in northern latitudes have reported that harvesting grain crops at dry matter (DM) concentrations of 600 to 700 g/kg increases the yield of grain (Marx, Reference Marx1973; Kennelly et al., Reference Kennelly, Dalton and Ha1988a). However, Stacey et al. (2003) concluded from studies undertaken in Ireland that harvesting wheat within the DM range of 580 to 818 g/kg did not effect grain DM yield. Traditionally, grain is either rolled or milled prior to feeding. Alternative systems of storing and processing grain are currently available, which enable grain to be harvested at higher moisture concentrations. Two such methods, which involve the grain being harvested at a moisture concentration of approximately 300 g/kg and ensiled are crimping and treating with an additive prior to ensiling, and whole grain treated with urea.
During the indoor feeding period in Ireland and the United Kingdom, beef cattle are predominantly offered grass silage as the sole forage. The feeding value of grass silage can vary dramatically (Keady, 2000) due to variations in harvest date (Gordon, Reference Gordon1980; Keady et al., Reference Keady, Mayne, Fitzpatrick and Marsden1999; Steen et al., Reference Steen, Kilpatrick and Porter2002), additive treatment (Keady, 1991 and 2000) and wilting (Patterson et al., Reference Patterson, Yan and Gordon1998; Keady et al., Reference Keady, Mayne, Fitzpatrick and Marsden1999). Consequently, when offered silage-based diets finishing beef cattle are supplemented with concentrate to achieve optimum growth rate. While many feedstuffs are available for supplementing beef cattle, a large proportion of the supplement is made up of cereals. Considerable progress has been made in the prediction of silage intake when offered as the sole diet to beef cattle (Steen et al., Reference Steen, Gordon, Dawson, Park, Mayne, Agnew, Kilpatrick and Porter1998). In order to incorporate data on silage intake prediction into feed rationing programmes, it is necessary to obtain information of how silages of differing intake characteristics and feed value interact with grain supplementation, when offered at contrasting feed levels and stored and processed using differing systems, which may have an impact on its chemical and physical composition.
The objective of the present study was to examine possible relationships in food intake and animal performance between grain treatment post harvest, grain feed level and silage feed value to examine if there is justification in storing and processing grain using different techniques to compliment individual grass silage types. The study examined the effects of grain treatment post harvest, grain feed level and silage feed value, and their possible interactions, on feed intake, animal performance, diet digestibility and meat eating quality from finishing beef cattle.
Material and methods
Two grass silages were harvested from the primary growth of predominantly perennial ryegrass swards between 15 and 17 May, and 2 and 3 June, respectively, and ensiled following treatment with a bacterial inoculant (Ecosyl; Ecosyl Products Ltd, Stokesley, North Yorkshire, England) at the rate of 3 l/t after a 24-h wilting period. The herbage was mown using a mower fitted with a V-spoke grass conditioner, harvested using a self-propelled precision-chop forage harvester and ensiled in trench silos. During filling each silo was consolidated between loads by rolling with an industrial loader and for a further 60 min after filling was completed. Following consolidation, two polythene sheets were used to seal each silo. The entire surface was then weighted down with a layer of tyres.
Representative areas of a winter wheat crop (variety Claire) were harvested with a conventional combine harvester on 13 August and ensiled either crimped or urea treated. Grain for crimping was passed through a crimping machine (Korte; SAS, Kelvin Cave Ltd, Drayton, Langport, Somerset, England) and was treated with 4.5 l/t of a proprietary acid-based additive (Crimpstore 2000; SAS, Kelvin Cave Ltd, Langport, Somerset, England). After crimping, the grain was loaded in layers into a trench silo and compacted for storage prior to feeding (crimped). Grain for urea treatment was loaded into a feed wagon and was mixed with 20 kg feed-grade urea and 30 l of water per t of grain for 5 min. After mixing the grain mixture was loaded into a trench silo and was not compacted for storage prior to feeding (urea). Each silo was covered with two polythene sheets and the entire surface area was weighted down with a layer of tyres.
The remaining areas of the wheat crop were harvested, using the same combine harvester on 27 August. The grain was treated with 3.0 l/t of a proprietary acid-based additive (Propcorn Trouw Nutrition, Belfast, Northern Ireland) prior to storage. The grain was rolled within 7 days prior to feeding.
Animals and management
Each grass silage was offered as the sole forage supplemented with either conventional, urea-treated or crimped-treated grain-based concentrate offered at either 3.5 or 6 kg DM per steer per day. The 12 treatments were offered to 132 continental crossbred beef steers (mean age = 704 days) with mean initial live weight (LW) of 510 ± 50.8 kg for 111 days. Eleven cattle were allocated to each of the 12 treatments at random and housed in pens of three or four balanced with respect to breed, LW and conformation classification (European Carcass Classification Scheme (Kempster et al., Reference Kempster, Cuthbertson and Harrington1982) undertaken on the live animals). For 2 months prior to the experiment the cattle received a medium-feed value grass silage supplemented with 3 kg concentrate per steer daily. The cattle were housed in slatted pens in two groups of four and one group of three per treatment.
The silages were offered once daily in sufficient quantities to allow a refusal of 50 to 100 g/kg offered and were supplemented with either 3.5 or 6 kg concentrate DM per steer per day. Concentrates were offered as a loose mix, unpelleted, in two meals daily, separate from the silages. The concentrates consisted of 850 and 150 g/kg DM of grain and citrus pulp, respectively. All cattle received 100 g of a beef mineral and vitamin mix per day (calcium 221 g/kg; phosphorus 40 g/kg; sodium 120 g/kg; magnesium 8 g/kg; cupric sulphate 1600 mg/kg; sodium selenite 20 mg/kg; vitamin A 400 000 IU/kg; vitamin D3 80 000 IU/kg; α-tocopherol IU/kg) with the concentrate offered in the afternoon.
Measurements
Grain was sampled at harvest for the determination of oven DM at 100°C. Silage and concentrate intakes were recorded daily for the duration of the study. Silage DM intakes were calculated as described by Keady et al. (Reference Keady, Steen, Kilpatrick and Mayne1994). Grain treatments were sampled daily for the determination of oven DM at 85°C and dried samples were bulked weekly for the determination of crude protein (CP), acid-detergent fibre (ADF), neutral-detergent fibre (NDF) and gross energy (GE). A further composite sample of fresh grain from each treatment was obtained once weekly and dried at 60°C for 48 h and analysed for water-soluble carbohydrate (WSC) and starch concentrations.
Silages offered and refusals were sampled daily for determination of oven DM and dried samples of offered silage were composited weekly for the determination of ADF, NDF and ash. A further composite sample of fresh offered silage was taken twice weekly and analysed for alcohols, GE, CP, ammonia nitrogen (N), acetate, propionate, butyrate, valerate and lactate concentrations and pH.
Steers were weighted on two consecutive days at the beginning and end of the experiment and live-weight gain (LWG) of each steer was calculated by difference using the mean of the two values. Four steers per treatment, consisting of one pen of four, were slaughtered when the treatments had been imposed for 98 and 128 days and the remaining three steers per treatment, consisting of one pen of three, were slaughtered when the treatments had been imposed for 105 days. The animals were stunned using a pneumatically operated captive bolt stunning system and bled immediately after stunning at an EU-approved abattoir which had routine veterinary inspection provided by the Department of Agriculture for Northern Ireland. Carcass weight was recorded for each steer immediately after slaughter. Daily carcass gain and LWG were calculated for each steer, the initial carcass weight of each steer derived by using the relationship between LW and carcass weight developed using similar steers (Keady and Kilpatrick, 2005). Carcass conformation and fat classification were determined by visual assessment according to the European Carcass Classification Scheme as described by Kempster et al. (Reference Kempster, Cuthbertson and Harrington1982). The weights of kidney, cod and channel fat were recorded for every animal during the dressing procedure. All carcasses were changed from Achilles suspension at 45 min post mortem to suspension from the aitch bone (tender stretch) and chilled under standard commercial conditions. The carcasses were placed in a chill subjected to an air temperature of 10°C for 10 h after which the air temperature was reduced to 1°C for 24 h. Subsequently, the carcasses were stored at 2°C to 4°C. At 48 h post mortem the carcasses were quartered between the 10th and 11th ribs and the depth of subcutaneous fat was measured at three points over the longissimus dorsi (LD) as described by Keady et al. (Reference Keady, Lively, Kilpatrick and Moss2007). The amount of marbling over the LD and the area of the LD muscle were determined as described by Keady et al. (Reference Keady, Lively, Kilpatrick and Moss2007). Sarcomere length was determined as described by Keady et al. (Reference Keady, Lively, Kilpatrick and Moss2007).
The sample joint (termed fore-rib in the UK) was removed from the left forequarter as described by Keady et al. (Reference Keady, Lively, Kilpatrick and Moss2007). A 3-cm steak of LD was removed at the 11th rib, and lean and fat colour was measured at 7 days post mortem as described by Keady et al. (Reference Keady, Lively, Kilpatrick and Moss2007). Muscle pH was measured at 7 days post mortem, and cooking loss and shear force were assessed at 7 and 21 days post mortem as described by Keady et al. (Reference Keady, Lively, Kilpatrick and Moss2007).
Twenty-four additional steers (two per treatment) of similar LW to the experimental steers that had been given the diets for 20 days, were used to determine the total tract digestibilities, N retention and grain egestion for the total diets. Procedures for the determination of digestibilities were as described by Steen (Reference Steen1984). The metabolisable energy (ME) concentrations of the diets were calculated as described by Keady et al. (Reference Keady, Steen, Kilpatrick and Mayne1994). At the end of the digestibility study, for each animal, 1 kg of faeces was taken from the composited daily samples and washed through a 2.75-mm screen until only the undigested grain remained. The grains were dried at 100°C for 24 h. Subsequently, egested grain was determined as the weight of grain DM in the 1 kg sample of faeces multiplied by total faecal output expressed as a proportion of grain DM intake. Apparent digestibilities of the forages were also determined using four castrate male sheep (Texel × Greyface, 1.5 years old) per silage. The silage for the apparent digestibility study using sheep was removed from the silo, as described by Keady et al. (Reference Keady, Mayne and Marsden1998).
Volatile-corrected silage DM was determined as described by Porter and Murray (Reference Porter and Murray2001). Chemical analysis of silage, concentrates, urine and faeces were as described by Keady et al. (Reference Keady, Mayne and Marsden1998 and Reference Keady, Mayne, Fitzpatrick and Marsden1999).
Statistical analysis
Animal performance and carcass data were analysed by analysis of variance using a factorial model to test for the main effects of silage type, grain treatment and grain feed level plus their interactions. For the ANOVA of feed intake, LWG, carcass gain, carcass data and meat quality assessments the mean values obtained for each pen (which was the experimental unit) of three or four steers were analysed. Animal performance and feed intake data were adjusted by covariance analysis using initial LW as a covariate and carcass conformation and fat classification were adjusted by covariance analysis using pre-experimental conformation and fat classification, respectively. Silage and total ration digestibilities were analysed using each sheep and steer as an individual, respectively. When significant (P < 0.05) main effects were found, differences between the individual factor levels were tested using Student’s t-test.
Results
Chemical composition of the silages and grains
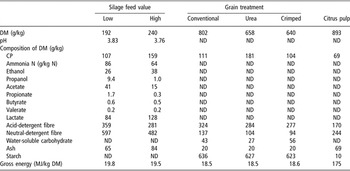
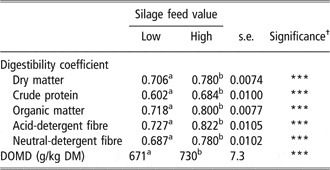
The chemical composition of the silages offered in the present study is presented in Table 1. The silages were well preserved as indicated by their pH and concentrations of ammonia N and butyrate. The silage digestibilities as determined through sheep at maintenance level are presented in Table 2. The high-feed value silage had higher (P < 0.001) DM, organic matter (OM), CP, ADF and NDF digestibility coefficients and digestible OM in the DM (DOMD) than the low-feed value silage.
Chemical composition of the feeds as fedFootnote †

† Abbreviations are: DM = dry matter; ND = not determined.
Silage digestibilities determined through sheep at maintenance level

Abbreviations are: s.e. = standard error; DOMD = digestible organic matter in the DM; DM = dry matter.
†NS P > 0.05; *P < 0.05; **P < 0.01; ***P < 0.001.
a,bMean values within a row having a different superscript letters differ (P < 0.05).
The chemical composition of the grain treatments offered in the present study are presented in Table 1. Relative to the conventional treatment, the urea and crimped treatments had numerically lower DM, ADF and NDF concentrations. Urea treatment had a higher CP concentration. The grain treatments had similar starch, GE and ash concentrations.
Steer performance
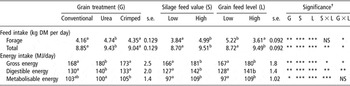
The effects of grain treatment and feed level, and silage feed value on feed and energy intake are presented in Table 3. Relative to the conventional treatment, urea treatment increased forage DM (P < 0.01), total DM (P < 0.01), GE (P < 0.01) and digestible energy (DE) (P < 0.01) intakes and tended (P > 0.05) to decrease ME intake. Increasing silage feed value and grain feed level both increased (P < 0.001) forage DM, total DM, GE, DE and ME intakes. There was a significant silage feed value × grain feed level interaction for total DM (P > 0.01), ME (P < 0.001), DE (P < 0.01) and GE (P < 0.005) intakes. For the low-feed value silage, increasing grain feed level increased total DM, GE, DE and ME intakes. However, for the high-feed value silage, increasing grain feed level did not alter (P > 0.05) total DM, GE, DE or ME intakes. There was a significant grain treatment × grain feed level interaction for forage DM (P < 0.05), total DM (P < 0.05), GE (P < 0.05) and DE (P < 0.05) intakes. At the low grain feed level, grain treatment did not alter forage DM, total DM, GE or DE intakes. However, at the high grain feed level urea treatment increased total forage Dry Matter, GE and DE intakes relative to the conventional and crimped treatments. There were no grain treatment × silage feed value or grain treatment × silage feed value × grain feed level interactions (P > 0.05) for feed or energy intakes.
Effects of grain processing method and feed level, and silage feed value on feed and energy intakes

Abbreviations are: s.e. = standard error; DM = dry matter.
†There were no significant grain treatment by silage feed value or silage feed value × grain treatment × grain feed level interactions.
a,bMean values within a row having a different superscript letters differ (P < 0.05). NS P > 0.05; *P < 0.05; **P < 0.01; ***P < 0.0013.
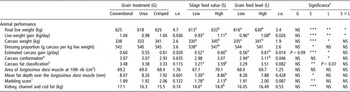
The effects of grain treatment and feed level, and silage feed value on animal performance and carcass characteristics are presented in Table 4. Relative to the conventional treatment, urea treatment tended (P = 0.09) to decrease estimated carcass gain, whereas crimping had no effect (P > 0.05). Grain treatment did not alter (P > 0.05) final LW, LWG, carcass weight, dressing proportion, carcass conformation, carcass fat classification, mean fat depth over the LD muscle, marbling score or kidney, channel plus cod fat weight.
Effects of grain processing method and feed level, and silage feed value on animal performance and carcass assessments

Abbreviation is: s.e. = standard error.
†There were no significant silage feed value by grain feed level, grain treatment by grain feed level or silage feed value × grain treatment × grain feed level interactions.
‡EUROP scale: 5 (best), 4, 3, 2, 1 (worst), respectively.
§Five-point scale: 1 = leanest, 5 = fattest.
∥Eight-point scale: 1 = leanest, 8 = fattest.
a,bMean values within a row having a different superscript letters differ (P<0.05), NS P > 0.05; *P<0.05; **P<0.01; ***P<0.001.
Increasing grain feed level increased final LW (P < 0.01), LWG (P < 0.01), carcass weight (P < 0.05), estimated carcass gain (P < 0.05) and carcass conformation (P < 0.05), and tended (P = 0.07) to increase carcass fat classification. Grain feed level had no effect on dressing proportion, mean fat depth over the LD muscle, marbling score or kidney, channel plus cod fat weight.
Increasing silage feed value increased final LW (P < 0.001), LWG (P < 0.001), carcass weight (P < 0.001), dressing proportion (P < 0.05), estimated carcass gain (P < 0.001), carcass fat classification (P < 0.01), mean fat depth over the LD muscle (P < 0.05), marbling score (P < 0.01) and kidney, channel plus cod fat weight (P < 0.001). Silage feed value had no effect (P > 0.05) on carcass conformation.
There was a significant silage feed value × grain feed level interaction for final LW (P < 0.05) and LWG (P < 0.05). Increasing grain feed level significantly increased final LW by 24 kg (P < 0.05) and LWG by 0.2 kg/day (P < 0.05) with the low-feed value silage and tended to alter final LW by 4 kg (P > 0.05) and LWG by 0.03 kg/day (P > 0.05) with the high-feed value silage. There were no significant (P > 0.05) silage feed value × grain feed level or silage feed value × grain treatment × grain feed level interactions for animal performance or carcass characteristics.
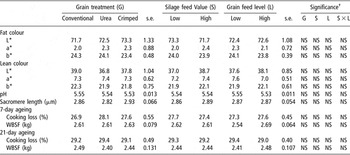
The effects of grain treatment, grain feed level, and silage feed value on fat and lean colour and meat quality are presented in Table 5. Grain treatment, silage feed value or grain feed level did not alter (P > 0.05) pH, sacromere length, fat colour, lean colour, or cooking loss and Warner Bratzler shear force after 7 and 21 days aging. There were no grain treatment × silage feed value, grain treatment × grain feed level, silage feed value × grain feed level or grain treatment × silage feed value × grain feed level interactions (P > 0.05) for fat or lean colour, or meat quality after 7 and 21 days aging.
Effects of grain processing method and feed level, and silage feed value on fat and lean colour and meat quality

Abbreviations are: s.e. = standard error; WBSF = Warner Bratzler sheer force.
†There were no significant grain treatment by grain feed level, grain treatment by silage feed value or grain treatment × grain feed level × silage feed value interactions (P > 0.05).
NS P > 0.05; *P < 0.05; **P < 0.01; ***P < 0.001.
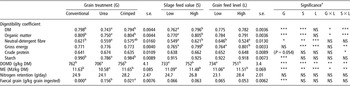
The effects of grain treatment, grain feed level and silage feed value on total diet digestibility, and N retention are presented in Table 6. Relative to conventional and crimped treatments, urea treatment decreased DM (P < 0.001), OM (P < 0.001) and starch (P < 0.001) digestibility coefficients, DOMD (P < 0.001) and ME concentration (P < 0.001) of the diet. Urea treatment decreased NDF digestibility (P < 0.05) while crimping increased energy digestibility (P < 0.001) relative to conventional treatment. Grain treatment did not alter (P > 0.05) CP digestibility or retention. Increasing grain feed level increased DOMD (P < 0.01), ME concentration (P < 0.001) and GE digestibility (P < 0.001), and decreased NDF digestibility (P < 0.001). Grain feed level did not alter (P > 0.05) the digestibility of DM, OM, CP and starch or N retention. Increasing silage feed value increased the digestibility of DM (P < 0.001), OM (P < 0.001) and NDF (P < 0.01), and DOMD (P < 0.001) and ME concentration (P < 0.01) of the diet. Silage feed value had no effect (P > 0.05) on the digestibility of CP and starch, or N retention. There was a significant grain treatment × grain feed level interaction for the digestibility of DM (P < 0.05), OM (P < 0.05) and GE (P < 0.01), and DOMD (P < 0.01) and ME concentration (P < 0.05) of the diet. Relative to the conventional treatment regardless of grain feed level, crimping did not alter (P > 0.05) the digestibility of DM or OM, DOMD and ME concentration of the diet. However, urea treatment decreased the digestibility of DM and OM, and DOMD and ME, with a greater negative effect at the high grain feed level. There was a significant interaction between silage feed value and grain feed level for DM (P < 0.001), OM (P < 0.001), GE (P < 0.01) and CP (P < 0.05) digestibilities, and DOMD (P < 0.01) and ME concentration (P < 0.01) of the diet. Grain feed level did not alter (P > 0.05) DM, OM, GE or CP digestibility, DOMD or ME concentration of the diet when offered with the high-feed value silage. However, with the low-feed value silage, increasing grain feed level increased DM, OM, GE and CP digestibility coefficients, DOMD and ME concentrations of the diet.
Effects of grain treatment and feed level, and silage feed value on diet digestibility, nitrogen retention and grain egestion

Abbreviations are: s.e. = standard error; DOMD = digestible organic matter in the DM;DM = dry matter; ME = metabolisable energy.
†There were no grain treatment by silage feed value or grain treatment × grain feed level × silage feed value interactions.
a,bMean values within a row having a different superscript letters differ (P < 0.05). NS P > 0.05; *P < 0.05; **P < 0.01; ***P < 0.001.
The effects of grain treatment and feed level and silage feed value on faecal grain output is presented in Table 6. Urea treatment significantly increased (P < 0.001) the proportion of grain intake recovered in the faeces relative to the untreated and crimped treatments. Silage feed value and grain feed level did not alter (P > 0.05) the proportion of grain intake recovered in the faeces. There were no grain treatment × grain feed level, grain treatment × silage feed value, grain feed level × silage feed value or grain treatment × silage feed value × grain feed level interactions for faecal grain output.
Discussion
The primary objective of the present study was to evaluate the effect of grain treatment post harvest on feed intake, animal performance and meat quality of finishing beef cattle offered two levels of grain and two contrasting grass silages. The grass silages offered in the present study differed substantially in feed value as determined by digestibility, intake characteristics and the levels of performance achieved. While the feed value of silages used in the present study were not as extreme as those produced in Ireland (Keady, 2000), they were more representative of the silages offered to finishing beef cattle on commercial farms. In the current study, increasing silage feed value increased animal performance, as determined by carcass gain, by 27%. The two levels of grain feeding offered in the current study ranged from 40% to 62% of total DM intake representative of the range of concentrate used in Ireland and the UK by commercial beef finishers offering grass silage-based diets.
The second objective of this study was to evaluate if there were any interactions between grain treatment, grain feed level and silage feed value. It is interesting to note that in terms of animal performance, the only interactions that occurred were silage feed value × grain feed level interactions for LWG, final LW and total DM intake and grain treatment × grain feed level for forage DM intake. For the low- and high-feed value grass silages supplemented with the low and high grain feed levels, total DM intakes were 8.13, 9.27, 9.31 and 9.71 kg DM per head per day, respectively. Increasing grain feed level had a lower substitution effect with the low-feed value silage than with the high-feed value silage. Similarly, McNamee et al. (Reference McNamee, Kilpatrick, Steen and Gordon2001) observed that substitution rate increased as silage intake potential and concentrate feed level increased. Furthermore Keady et al. (Reference Keady, Mayne, Offer and Thomas2004), in developing a model to predict feed intake of dairy cows concluded that increasing silage feed value and concentrate feed level increased substitution rate in silage based diets. Increasing concentrate feed level had a greater effect on LWG and final LW when offered with the low-feed value grass silage, relative to the high-feed value grass silage which is a reflection of the greater impact on total DM intake and consequently ME intake.
There was a significant interaction between grain treatment and feed level for silage DM intake. At the low grain feed level, grain treatment did not alter silage DM intake. However, at the higher grain feed level urea treatment increased silage intake by 0.92 and 0.82 kg DM per head per day relative to the conventional and crimped treatments, respectively. Urea treatment decreased diet digestibility and increased grain egestion. Previously, Drennan et al. (Reference Drennan, Almiladi and Maloney1995) concluded that relative to processing barley and wheat prior to feeding, offering whole grain increased grain egestion. The reduction in grain digestion due to urea treatment probably altered rumen fermentation patterns consequently increasing feed intake. Laksesvela (Reference Laksesvela1981) concluded that relative to ground barley, moist barley treated with ammonia and whole untreated barley increased rumen pH and decreased the concentrations of volatile fatty acids (VFA) in the rumen.
Effect of crimping treatment on animal performance
Crimping altered the composition of grain similar to the observations of Pettersson and Martinsson (Reference Pettersson and Martinsson1994) and Pettersson et al. (Reference Pettersson, Bernes and Martinsson1998). The reduction in starch concentration is possibly due to the action of amylolytic enzymes or microbes producing glucose. The lower concentrations of NDF and ADF due to crimping are probably associated with the cellulolytic properties of ammonia that was included in the additive applied at ensiling.
The absence of an effect of crimping on animal performance is similar to the results of previous studies using ensiled moist barley offered to dairy cows (Marx, Reference Marx1973; Ingalls et al., Reference Ingalls, Clark and Sharma1974; Gibson et al., Reference Gibson, Kennelly and Mathison1988) and beef cattle (Gibson et al., Reference Gibson, Kennelly and Mathison1988; Kennelly et al., Reference Kennelly, Mathison and deBoer1988b). However, Pettersson et al. (Reference Pettersson, Bernes and Martinsson1998) reported that crimping grain reduced milk yield due to a combination of reduced silage intake and a reduction in the feed value of barley. The absence of an effect of crimping on feed intake and performance of beef cattle in the current study is probably due to one or more of the following. Firstly, crimping did not alter any of the digestibility coefficients determined or the ME concentration of the diet. Similarly, Huhtanen (Reference Huhtanen1984), Kennelly et al. (Reference Kennelly, Dalton and Ha1988a) and Pettersson and Martinsson (Reference Pettersson and Martinsson1994) concluded that crimping did not alter diet digestibility. Secondly, crimping of grain prior to feeding did not alter the quantity of grain egested in the faeces relative to the conventional treatment. Thirdly, crimping did not alter feed intake and consequently ME intake. Fourthly, while the effect of grain treatment on rumen fermentation characteristics were not assessed in the current study, it is likely that the crimped wheat treatment did not alter VFA concentrations. Ingalls et al. (Reference Ingalls, Clark and Sharma1974) and Kennelly et al. (Reference Kennelly, Dalton and Ha1988a) observed no effect of ensiling grain on rumen fermentation parameters using maize silage- and hay-based diets, respectively. Using grass silage-based diets, Keady and Mayne (Reference Keady and Mayne2001) concluded that relative to concentrate composition, silage type had the greater effect on rumen fermentation. Furthermore, Keady and Mayne (Reference Keady and Mayne2001) reported that there was no evidence of any effect of level of intake on rumen fermentation patterns. Finally, crimping did not alter the feeding value of wheat as determined by kg DM intake per kg carcass or g carcass output per MJ ME intake (Table 7). Similarly, Kennelly et al. (Reference Kennelly, Mathison and deBoer1988b) concluded that ensiled moist barley rolled prior to feeding had a similar feeding value as rolled dried barley.
Effects of grain treatment and feed level, and silage feed value on estimated efficiency of gain

Abbreviations are: DMI = dry matter intake; ME = metabolisable energy.
Effect of urea treatment on animal performance
The reduced NDF and ADF concentrations due to urea treatment of wheat are probably associated with the alkaline environment produced by the release of ammonia, which prevailed within the silo rendering the fibrous portion of the seed coat more soluble (Low and Kellaway, Reference Low and Kellaway1983). Russell et al. (Reference Russell, Lin, Thomas and Mora1988) observed that urea treatment caused the seed coat to fissure and become softer.
The increased silage DM intake due to urea treatment was probably associated with changed rumen fermentation patterns. While rumen fermentation patterns were not determined in the current study, Laksesvela (Reference Laksesvela1981) reported lower concentrations of total VFAs in the rumen indicative of reduced ruminal grain degradation when ammoniated barley or whole barley was offered to sheep relative to ground barley. Furthermore, in the current study the increased forage intake occurred at the higher level of grain feeding but did not occur at the low level of grain feeding.
The tendency for urea treatment to reduce animal performance is similar to previous studies (Mowat et al., Reference Mowat, McCaughey and Macleod1981; Yaremcio et al., Reference Yaremcio, Mathison, Engstorm, Rogh and Caine1991) using urea and ammonia treatment of whole grain. The tendency for urea treatment to reduce animal performance is probably due to one or more of the following. Firstly, urea treatment reduced diet digestibility. The decreased digestibility is probably due to the inadequate degradation of the seed coat by ammonia deriving from hydrolysis of the applied urea. Rode et al. (Reference Rode, Cheng and Costerton1986) concluded that relative to whole moist barley, urea treatment did not alter DM digestibility, while Drennan et al. (Reference Drennan, Almiladi and Maloney1995) concluded that relative to whole grain, rolling increased digestibility. Secondly, although urea treatment increased total DM intake, ME intake was reduced due to a lower ME concentration of the diet. The reduced ME concentration of the diet due to urea treatment is associated with 15.6% of the grain DM intake being egested in the faeces. Thirdly, the feed conversion ratio (FCR), as determined by kg DM intake per kg carcass gain, was increased by 16% due to urea treatment (Table 7). Similarly, Yaremcio et al. (Reference Yaremcio, Mathison, Engstorm, Rogh and Caine1991) reported that moist urea-treated barley increased FCR (kg DM intake per kg ADG) by 30% relative to rolled dried barley.
Effect of silage feed value on animal performance
Silage feed value is determined by its intake characteristics and digestibility. Steen et al. (1998) concluded that digestibility and the protein and fibre fractions are the major forage factors affecting silage DM intake. More recently, Keady et al. (Reference Keady, Mayne, Offer and Thomas2004) concluded that forage intake potential was a major variable in a model developed, from a data base of 3337 observations of lactating dairy cattle offered a wide range of diets, to predict feed intake of lactating dairy cows offered silage based diets. In the present study, the digestibility and concentrations of DM, CP, NDF and ADF differed between the silages illustrating differences in intake characteristics and consequently feed value.
Increasing silage digestibility has been shown to increase the performance of beef cattle (Steen, 1987; Steen et al., Reference Steen, Kilpatrick and Porter2002) and dairy cows (Gordon, Reference Gordon1980; Keady et al., Reference Keady, Mayne, Fitzpatrick and Marsden1999). From a review of the literature, Steen (1987) concluded that a 10 g/kg increase in DOMD resulted in an increase in carcass gain of beef cattle of 33 g/day when silage was offered as the sole diet and 28 g/day when concentrate constituted 20% to 37% of total DMI. More recently, Steen et al. (Reference Steen, Kilpatrick and Porter2002) reported that a 10 g/kg increase in DOMD resulted in an increase in carcass gain of beef cattle of 29, 30 and 13 g/day when concentrates constituted proportionally 20%, 40% and 60% of total DM intake, respectively. In the current study, when concentrate was offered at a mean of 4.6 kg DM per head per day, constituting 52% of total DM intake, each 10 g/kg increase in DOMD resulted in an increase in carcass gain of 23 g/day, which is similar to the response reported by Steen et al. (Reference Steen, Kilpatrick and Porter2002) when concentrate constituted similar proportions of the diet.
Although, increasing silage feed value and grain feed level had similar effects on ME intake, increasing silage feed value increased efficiency of feed utilisation, as determined by g carcass gain per MJ ME intake and decreased FCR (kg DM intake per kg carcass gain), while increasing concentrate feed level had no effect (Table 7). Similarly, Steen et al. (Reference Steen, Kilpatrick and Porter2002), using grass silages of greater contrasting feed values than in the present study, reported that increasing silage feed value improved efficiency of utilisation of feed.
Effect of concentrate feed level on animal performance
The increased digestibility of grass silage based diets due to increasing concentrate feed level has been well documented (Steen et al., Reference Steen, Kilpatrick and Porter2002; Keady and Gordon, 2006; Keady and Kilpatrick, 2006; Keady et al., Reference Keady, Lively, Kilpatrick and Moss2007). The reduction in fibre digestibility due to increased concentrate feed level has been reported previously (Steen et al., Reference Steen, Kilpatrick and Porter2002; Keady and Gordon, 2006; Keady and Kilpatrick, 2006) and is probably due to the effect of fermentation of starch on rumen pH. While previous studies (Steen et al., Reference Steen, Kilpatrick and Porter2002; Keady et al., 2005; Keady and Kilpatrick, 2006;) reported increased dressing proportion due to increased concentrate feeding, it should be noted that in those studies the concentrate portion of the diet increased from 20% to 80% or greater. Meanwhile, other studies (Keady and Gordon, 2006; Keady et al., Reference Keady, Lively, Kilpatrick and Moss2007) in which concentrate proportion was increased by 40% or less, concentrate feed level did not alter dressing proportion.
Keady et al. (Reference Keady, Mayne, Offer and Thomas2004) and McNamee et al. (Reference McNamee, Kilpatrick, Steen and Gordon2001) reported that concentrate feed level and silage feed value are major factors affecting concentrate substitution rate. Increasing concentrate supplementation resulted in a mean substitution rate of 0.68 kg silage DM per kg increase in concentrate DM intake which is within the ranges quoted by Keady and Gordon (2006), Keady et al. (Reference Keady, Lively, Kilpatrick and Moss2007) and McNamee et al. (Reference McNamee, Kilpatrick, Steen and Gordon2001) using similar grass silages supplemented with similar levels of concentrate. However, Keady and Kilpatrick (2006) and Steen et al. (Reference Steen, Kilpatrick and Porter2002) using high-feed value grass silages reported substitution rates of 0.91 and up to 1.00, respectively.
The level of animal performance in the current study and the improvement due to increased level of concentrate feeding were similar to those observed in previous studies (Steen et al., Reference Steen, Kilpatrick and Porter2002; Keady et al., 2005; Keady and Gordon, 2006; Keady et al., Reference Keady, Lively, Kilpatrick and Moss2007) using steers of similar breeds offered grass silage based diets supplemented with concentrate. While previous authors (Steen and Robson, Reference Steen and Robson1995; Steen and Kilpatrick, Reference Steen and Kilpatrick2000) have reported improvements in the efficiency of feed utilisation as determined by g carcass per MJ ME intake, Steen et al. (Reference Steen, Kilpatrick and Porter2002) and Keady et al. (Reference Keady, Lively, Kilpatrick and Moss2007) using silages of similar feed value as in the current study concluded that increasing concentrate by a similar proportion as in the current study had no effect on efficiency of utilisation of ME.
Effects of treatments on meat quality
Tenderness, colour and flavour are the major factors affecting meat quality (Buckley et al., Reference Buckley, Morissey and Gray1995). Cattle grown rapidly prior to slaughter have been shown in some studies to produce more tender beef (Fishell et al., Reference Fishell, Aberle, Judge and Perry1985). In the current study, increasing silage feed value and concentrate feed level increased daily carcass gain. Daily carcass gain varied from 0.44 to 0.74 kg/day between the treatments. Increased growth rate prior to slaughter increases the rate of protein turn over, resulting in higher concentrations of proteolytic enzymes in the carcass tissues at slaughter, which in turn may effect collagen solubility and/or myofibril fragmentation (Aberle et al., Reference Aberle, Reeves, Judge, Hunsley and Perry1981). More recently, French et al. (Reference French, O’Riordan, Monahan, Caffrey, Mooney, Troy and Moloney2001) concluded that carcass growth rate accounted for 0.10 of the variation in Warner Bratzler shear force and 0.03 of the variation in sensory tenderness in 14 day-aged steaks. Recent studies have reported no effect of forage feed value (Keady and Gordon, 2006; Keady et al., Reference Keady, Lively, Kilpatrick and Moss2007) or concentrate feed level (Keady and Gordon, 2006; Keady and Kilpatrick, 2006) on tenderness of beef cattle. The Warner Bratzler shear force in the present study indicated meat of acceptable tenderness based on the 100% tenderness acceptable of less than 3.0 kg/cm2 shear force by Miller et al. (Reference Miller, Corr, Ramsey, Crockett and Hoover2001). The absence of an effect on meat tenderness in the present study is probably due to the method by which the carcasses were hung. Lively et al. (2006) concluded that carcasses suspended tender stretched were more tender than those suspended by the Achilles tendon. Furthermore, Lively et al. (2006) concluded that differences between breeds that existed when carcasses were suspended by the Achilles tendon were greatly reduced relative to carcasses suspended tender stretched.
In some markets, customers discriminate against beef depending on fat or lean colour. Previous studies have shown that fat whiteness increased as concentrate feed level increases due to the lower β-carotene concentration in concentrates relative to green forages (Knight and Death, Reference Knight and Death1999). While ensiled grass was offered in the present study, no effects were observed on fat colour even though β-carotene losses are small in well preserved grass silages (McDonnell et al., Reference McDonnell, Henderson and Heron1991). Previous studies have reported no effect of nutritional treatments on fat (Keady and Gordon, 2006; Keady and Kilpatrick, 2006; Keady et al., Reference Keady, Lively, Kilpatrick and Moss2007) or lean (Keady and Gordon, 2006; Keady and Kilpatrick, 2006) colour. The mean lean L* and lean b* values in the present study were 37.8 and 22.0, respectively. Hopkins et al. (Reference Hopkins, Fogarty and Mencies1996) quoted a value of 34 for lean L* values below which Australian consumers regard lamb meat as dark. While information on critical values for lean colour in European markets are lacking, the mean L* values for the different treatments are in line with previous published results.
Conclusions
It is concluded that urea treatment of grain tended to decrease carcass gain due to increased grain egestion in the faeces and consequently a reduction in the ME concentration of the diet. Crimping did not alter carcass gain and thus provides a biologically equally effective method to store grain as conventional methods which involved harvesting at higher DM concentrations, treating with an acid-based additive and processing prior to feeding. Increasing silage feed value increased animal performance, the response being greater than increasing grain feed level by 2.4 kg DM per day.