

1 Introduction
Upon reaching the age of 62, most Americans face an important decision: when to claim Social Security benefits. While the vast majority of individuals claim immediately upon reaching age 62 or stopping work, claiming may be delayed until age 70. As Social Security benefits are paid as a life annuity, delayed claiming reduces the expected length of time over which benefits are received. Thus, the benefit calculation rules call for an actuarial adjustment so that individuals who claim later receive larger monthly payments. Delaying Social Security is equivalent to purchasing an annuity. An individual who delays forgoes benefits during the delay period in exchange for an increase in monthly benefit payments for life.
Conventional wisdom has long held that the adjustments made for delaying Social Security benefits are actuarially fair. In other words, the average individual receives the same expected present value regardless of when benefits begin. In this paper, we revisit the question of actuarial fairness in light of the dramatic mortality improvements of the past several decades, as well as historically low interest rates. Both of these factors can be expected to increase the gains from delaying Social Security. In addition, as a result of law changes since the 1960s, the terms for delaying Social Security have become substantially more generous. Couples can now delay benefits on more advantageous terms between ages 62 and 65 due to changes in the rules for calculating survivor benefits. Moreover, for both couples and singles, the terms for delaying beyond full retirement age have become more generous over the years: members of the 1924 birth cohort could earn 3% of their base benefit per year of delay beyond full retirement age, while members of cohorts born in 1943 and later can earn 8% of their base benefit per year of delay beyond full retirement age.Footnote 1
We also investigate how the gains from delay vary across demographic groups and household structures. Even if the adjustments to Social Security benefits were actuarially fair for the population on average, they would not be so for every individual. For example, those who expect to live longer than average could benefit from delaying, while those who expect to live shorter than average could benefit from claiming early. In addition, the spousal and survivor benefits offered by Social Security make delaying benefits a particularly attractive option for married couples. One member of a two-earner married couple may claim spousal benefits upon reaching full retirement age, leaving the benefit based on his or her own earnings record to accumulate through deferral. The secondary earner in a couple also receives a survivor benefit that is equal to the primary earner's benefit. Thus, delaying the primary earner's benefit is equivalent to purchasing a second-to-die or joint life annuity. In contrast, a single personFootnote 2 who delays claiming only receives a single life annuity based on his or her own earnings record.
Our analysis is based on detailed simulations of claiming strategies for stylized households (single males, single females, one-earner couples, and two-earner couples) that vary by race, education, and health status. These simulations suggest that delaying is likely to be actuarially advantageous for most people. The gains from delay are greater at lower interest rates, for married couples relative to singles, for single women relative to single men, and (at most interest rates) for two-earner couples relative to one-earner couples. In addition, within a married couple, the gains from deferring the primary earner's benefit are greater than the gains from deferring the secondary earner's benefit. We find that at today's near-zero real interest rates, primary earners with average life expectancy should delay benefits to age 70 to maximize expected present value. Singles with average life expectancy should delay beyond their full retirement age as well. Couples in all groups benefit from delaying the primary earner's benefit, though for some groups with lower-than-average life expectancy, the couple maximizes present value when the secondary earner claims at age 62. At real interest rates that are closer to their historical average, singles with substantially worse-than-average mortality no longer benefit from delays. However, even in this case couples in all groups gain from delaying the primary earner's benefit.
Comparing across time, we find that in the early 1960s, the terms for delay between ages 62 and 65 were slightly actuarially disadvantageous for single men and couples in average health. They were actuarially advantageous for single women. Rule changes since that time have made delays slightly less attractive for singles and substantially more attractive for couples. The other two factors affecting the gains from delay – mortality improvements and lower real interest rates – have substantially increased the attractiveness of delay for both singles and couples. Overall, if the goal is to maximize net present value (NPV), some delay in commencing Social Security beyond age 62 is the right thing to do for the vast majority of retirees. As mortality continues to improve, we can expect the gains from delay to increase even further unless there is a change in the actuarial adjustment to benefits. In particular, by 2050, the gains in present value from delaying from age 62 to 66 will be about one to two percentage points higher than in 2013, evaluating the present value with a 2.9% real interest rate for both years.
This paper is organized as follows. Section 2 summarizes the relevant literature. Section 3 describes the relevant rules for computing benefits, and presents our methodology. Section 4 presents our main results. Section 5 investigates the extent to which the gains from delay have changed since 1962, and how they might continue to evolve in the future. Section 6 offers policy implications and conclusions.
2 Literature
Earlier studies have consistently found that, for real interest rates in the 2–3% range, delaying Social Security is actuarially advantageous for primary earners, mostly through its impact on survivor benefits (Coile et al., Reference Coile, Diamond, Gruber and Jousten2002; Munnell and Soto, Reference Munnell and Soto2005; Mahaney and Carlson, Reference Mahaney and Carlson2007; Sass et al., Reference Sass, Sun and Webb2007, Reference Sass, Sun and Webb2013; Meyer and Reichenstein, Reference Meyer and Reichenstein2010). Additionally, primary earners can collect benefits on the lower earning spouse's record while they delay their own benefit (Munnell et al., Reference Munnell, Golub-Sass and Karamcheva2009). Delay can also have tax advantages (Mahaney and Carlson, Reference Mahaney and Carlson2007). However, the gains from delay are small at best for singles, particularly for single men (Jivan, Reference Jivan2004; Munnell and Sass, Reference Munnell and Sass2012). While studies of actuarial fairness focus on the expected present value of Social Security benefits at different claiming ages, Sun and Webb (Reference Sun and Webb2009) show that the utility value of delaying claiming may exceed the gain in expected present value because the additional Social Security benefits are paid as a real life annuity, insuring households against longevity and inflation risk.Footnote 3
Despite the potential gains from delaying Social Security, most individuals appear to claim Social Security soon after they reach age 62 or stop work. Most empirical studies conclude that some claiming patterns are consistent with present-value maximizing behavior (e.g., married people are more likely to delay). But overall, there is not much evidence to support this hypothesis. For example, Coile et al. (Reference Coile, Diamond, Gruber and Jousten2002) find that individuals with a longer life expectancy and a younger spouse (i.e., longer expected widow period) are more likely to delay; however, a large number of individuals claim at age 62, a finding that is inconsistent with the general prediction that delays are often actuarially advantageous. Munnell and Soto (Reference Munnell and Soto2005) show that married women are most likely to claim early, followed by single men, married men, and single women, a finding that is consistent with the fact that secondary earners and single men derive the least benefit from delay. Beauchamp and Wagner (Reference Beauchamp and Wagner2012) find that claiming age is positively correlated with an individual's actual age at death. However, several other studies have found little relationship between claiming behavior and factors that influence the gains from delay (Hurd et al., Reference Hurd, Smith and Zissimopoulos2004; Sass et al., Reference Sass, Sun and Webb2007, Reference Sass, Sun and Webb2013). Field experiments suggest that informing people about the gains from delay does not change claiming behavior (Liebman and Luttmer, Reference Liebman and Luttmer2011). However, the way in which the claiming decision is framed has a significant impact on individuals' self-reports of their intended claiming age (Brown et al., Reference Brown, Arie Kapteyn and Mitchell2011).
As delaying Social Security is equivalent to buying an annuity, this paper is also related to the extensive literature on the demand for annuities. A recurring theme in this literature is the fact that most people do not convert their retirement savings into annuities, even though annuities would appear to increase their utility by insuring them against outliving their savings (e.g., Yaari, Reference Yaari1965; Mitchell, et al., Reference Mitchell, Poterba, Warshawsky and Brown1999; Bütler and Teppa, Reference Butler and Teppa2007; Brown et al., Reference Brown2007). There are a number of explanations for limited annuity demand, such as adverse selection, large administrative costs, bequest motives, cognitive bias, or lack of financial knowledge; Brown (Reference Brown2007, Reference Brown2008) provides a survey. The failure to delay Social Security when it is actuarially advantageous – in effect turning down an actuarially advantageous annuity – may be a different aspect of the same puzzle. A related point is that if delaying Social Security is actuarially advantageous relative to private annuities, we should expect individuals to delay Social Security as much as possible before buying private annuities. In other words, buying a private annuity without delaying Social Security is suboptimal.
Relative to the previous literature, our analysis highlights the considerable increase in the gains from delay due to historically low interest rates, mortality improvements, and changes in the law. In addition, we quantify the expected future increases in the gains from delay due to further improvements in mortality, and we present detailed calculations of the current gains from delay for different demographic groups. Some prior studies have explored the sensitivity of the gains from delay to different discount rate assumptions (Coile et al., Reference Coile, Diamond, Gruber and Jousten2002; Sun and Webb, Reference Sun and Webb2009; Sass et al., Reference Sass, Sun and Webb2013). In addition, Sass et al. (Reference Sass, Sun and Webb2013) and Sun and Webb (Reference Sun and Webb2009) examine the gains from delay using race and education-differentiated mortality; Coile et al. (Reference Coile, Diamond, Gruber and Jousten2002) also explore the implications of varying mortality assumptions. However, we believe it is worth revisiting this issue in detail by placing it in the context of the considerable economic and demographic changes in recent decades. A few earlier studies (Jivan, Reference Jivan2004; Munnell and Sass, Reference Munnell and Sass2012) have also compared how the gains from delay have changed since the early 1960s when delays were first introduced. However, these studies focus on singles. Most of the rule changes that have occurred since then have affected survivor benefits, and these changes have made delay particularly advantageous for couples. In addition, we are not aware of any calculations of how the gains from delay are likely to evolve in the future.
3 Mortality, interest rates, and the gains from delay
3.1 Benefit rules
Social Security benefits for a single individual are based on average indexed monthly earnings (AIME), which is defined as average monthly earnings over the highest 35 years of a person's career, indexed to reflect average wage growth in the economy. The individual's base monthly Social Security benefit, called the Primary Insurance Amount (PIA), is derived by applying a progressive benefit formula to the AIME.Footnote 4 An individual is entitled to receive his or her PIA at full retirement age, which is 66 for individuals in the 1943–54 birth cohorts. Benefits may be claimed as early as 62, but the benefit amount is reduced for each month of early claiming. An individual claiming at age 62, for example, receives only 75% of his or her PIA.Footnote 5 Delaying benefits beyond full retirement age – up to age 70 – results in a benefit increase of 8% of PIA per year of delay for individuals born in 1943 and later. Thus, claiming at age 70 results in a benefit amount that is 132% of PIA. The credit for delayed retirement has increased gradually over time. For example, individuals born in 1931–32 receive only 5% of PIA per year of delay. In all cases, benefits are paid as an inflation-indexed life annuity.
A primary earner in a couple receives a benefit based on his or her work record that is calculated in the same way as for singles. In a one-earner couple, the non-earner is entitled to a base benefit equal to 50% of the primary (only) earner's PIA at the non-earner's full retirement age. The spousal benefit may be claimed as early as age 62, but the amount is reduced to 35% of the primary earner's PIA. There are no delayed retirement credits for spousal benefits. A spousal benefit may be claimed after the primary earner has claimed his or her worker benefit, or reached full retirement age, whichever is sooner.Footnote 6 In two-earner couples, both spouses can claim a benefit based on their own work record. In addition, one spouse (but not both) can claim a benefit based on the other spouse's record, subject to the same rules as the non-earner in one-earner couples. An individual who claims both a spousal benefit and a benefit based on his or her own work record receives the higher of the two amounts. Upon reaching full retirement age, individuals are allowed to ‘separate’ their own benefits from their spousal benefits. That is, they may claim a spousal benefit at age 66, then switch to their own benefit later, taking advantage of delayed retirement credits.
A widow is also entitled to collect a survivor's benefit based on the deceased spouse's earnings record. Individuals who claim both a worker and a survivor benefit receive the higher of the two amounts; thus, survivor benefits are typically only relevant to secondary earners.Footnote 7 A widow can receive 71.5% of the primary earner's benefit (the primary earner's PIA plus any delayed retirement credits) at age 60.Footnote 8 If the widow delays claiming, this amount is increased linearly – by 4.75% of the primary earner's benefit per year – until it reaches 100% of the primary earner's benefit amount at the widow's full retirement age (age 66 for individuals born between 1945 and 1956).Footnote 9 However, if the primary earner claimed benefits before full retirement age – and was therefore receiving a reduced benefit at the time of death – the widow's benefit is limited to the actual benefit received by the primary earner, or to 82.5% of the primary earner's PIA, whichever is larger. This rule is known as the ‘widow limit provision.’ For example, suppose the primary earner claims at age 62, begins receiving 75% of his PIA, and then dies. The widow can collect 71.5% of the primary earner's PIA if she claims at age 60, 76.25% of the primary earner's PIA if she claims at age 62, and 81% of the primary earner's PIA if she claims at age 63. However, as the widow's benefit cannot rise above 82.5% of the primary earner's PIA, the widow receives only 82.5% of the primary earner's PIA if she claims at age 64 or beyond. Now suppose the primary earner claims at age 64, begins receiving 86.7% of his PIA, and then dies. In this case, the widow can still collect 71.5% of the primary earner's PIA at age 60. This amount still rises by 4.75% of the primary earner's PIA for each year that the widow delays claiming. However, it cannot rise beyond 86.7% of the primary earner's PIA.Footnote 10 While the rules are complex, it should be clear that when a primary earner delays claiming, it increases survivor benefits for the secondary earner in the event of widowhood.
Delayed claiming requires one to forgo benefits during the delay period in exchange for higher benefits for life. In addition, as the higher benefits are indexed for inflation, those who delay Social Security are effectively buying an incremental real-life annuity, which is virtually unavailable in the private market. When a single person delays claiming, he or she effectively purchases a single life annuity, which pays benefits over the remainder of the individual's life. When the primary earner in a couple delays claiming, he or she purchases a joint life annuity with a 100% survivor benefit. That is, the annuity payments continue until the second person in the couple dies. When the secondary earner in a couple delays claiming, he or she purchases a first-to-die annuity, which pays benefits until either the primary earner dies (after which the secondary earner switches to a widow benefit) or the secondary earner dies. All three kinds of annuities are offered on the same terms, even though a joint life annuity on average pays more benefits than a single life annuity, which on average pays more benefits than a first-to-die annuity. Moreover, the terms of these annuities do not vary based on a person's life expectancy, or on prevailing interest rates. In contrast, the terms of a private annuity typically vary based on life expectancy, interest rates, and the type of annuity (joint life, single life, or first-to-die) purchased. Thus, delaying Social Security is especially beneficial – relative to private annuities – when real interest rates are low, when an individual has above-average life expectancy, and when delay purchases a relatively generous joint life annuity.
3.2 Methodology
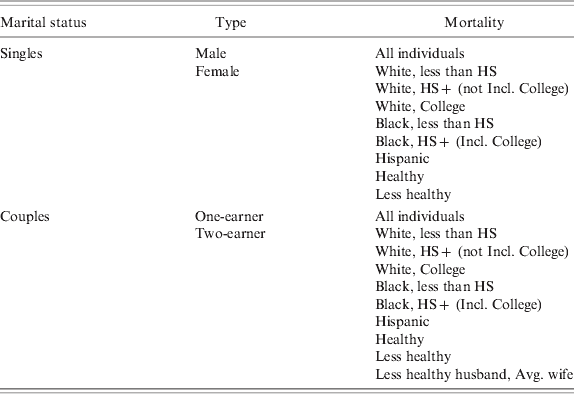
We simulate the gains from different delay strategies for a variety of stylized households differentiated by structure (single, one-earner couple, and two-earner couples) and mortality (based on either race and education, or on health status). For couples, the primary earner is assumed to be a male who turns 62 in 2013 (i.e., from the 1951 birth cohort), and the secondary earner is assumed to be a female who turns 60 in 2013 (i.e., from the 1953 birth cohort). In two-earner couples, the secondary earner's PIA is assumed to be 75% of the primary earner's PIA.Footnote 11Table 1 provides a list of the stylized households that we consider in our analysis. For singles, we consider males and females born in 1951 with mortality determined by the race/education and health categories given in the third column of the table. For couples, we consider one-earner couples and two-earner couples with mortality given by the race and health categories given in the third column of the table. Both members of the couple are assumed to have the same race/education or health status, with the exception of the final case, in which the husband is assumed to be less healthy and the wife is assumed to be in average health. The last case is intended to illustrate that even if a primary earner faces higher-than-average mortality, the household can still benefit – through increased survivor benefits – if the primary earner delays claiming. We emphasize that our race-and-education differentiated mortality does not control for health status, and our health-differentiated mortality does not control for race or education. That is, some of the observed race/education differences in mortality arise from differences in health, and vice versa. Thus, to estimate how much a particular household would gain from delay, one should use either the race-and-education differentiated mortality rates or the health-differentiated mortality rates, but not both.
Stylized households

We base our race-and-education differentiated mortality rates on the data presented in Brown et al. (Reference Brown, Liebman, Pollet, Feldstein and Liebman2002). These data consist of mortality ratios for the race and education categories given in Table 1, broken down further by gender, based on matching data from the National Longitudinal Mortality Survey and the Current Population Survey. For each race-education-gender group, the mortality rate at age a is equal to the probability of a group member dying before reaching age a+1 conditional on surviving to age a. The mortality ratio at age a for a group is defined as the group's mortality rate at age a relative to the mortality rate at age a for the general population of the same gender. Figure 1 depicts mortality ratios for males aged 62 and older. For example, a mortality ratio of 1.95 for 62-year-old black males with less than a high school education indicates that individuals in this group have a probability of dying before reaching age 63, conditional on reaching their 62nd birthday, that is 1.95 times that of all males aged 62. Figure 2 provides the same information for females. The mortality rates calculated by Brown et al. (Reference Brown, Liebman, Pollet, Feldstein and Liebman2002) are period mortality rates. If we assume that each group's mortality ratios remain constant over time, we can compute cohort life tables for each group by applying the mortality ratios to cohort life tables for the general population.Footnote 12 Our cohort life tables come from the Social Security Administration, and are provided for men and women born on January 1 of each year. The cohort life tables include mortality rates through age 119, while the mortality ratios (Brown et al. Reference Brown, Liebman, Pollet, Feldstein and Liebman2002) are provided through age 100. We set each group's mortality ratio equal to 1 for ages greater than 100.
(colour online) Mortality ratios for race-education groups – males. Notes: Ratios are from Brown et al. (Reference Brown, Liebman, Pollet, Feldstein and Liebman2002).

(colour online) Mortality ratios for race-education groups – females. Notes: Ratios are from Brown et al. (Reference Brown, Liebman, Pollet, Feldstein and Liebman2002).
In our simulations that differentiate mortality by health status, we assume that ‘less healthy’ individuals have a mortality rate at each age that is twice that of the general population of the same gender. ‘Healthy’ individuals have a mortality rate at each age that is 75% of that of the general population of the same gender. These assumptions are roughly consistent with available data on health-differentiated mortality. A report by the Society of Actuaries (2000) projects mortality rates for healthy and disabled individuals in the year 2000 based on data from company pension plans. For example, according to the Society of Actuary mortality tables, disabled males aged 62 have a mortality rate of 4.5%. In comparison, according to Arias et al. (Reference Arias, Rostron and Tejada-Vera2010), the overall mortality rate for males aged 62 in 2000 was 1.5%, suggesting a mortality ratio of 2.9 for disabled men aged 62. At age 90, this mortality ratio falls to roughly 1. Similarly, the healthy individuals in the Society of Actuaries mortality tables have mortality ratios of roughly 0.6 at age 62, rising to roughly 1 at age 89. The ratios for women follow the same pattern, with the ratio for disabled women falling from roughly 2.5 at age 62 to 1 at age 89, and the ratio for health women rising from roughly 0.7 at age 62 to 0.9 at age 89.
For each of our stylized households, we compute the expected present value of benefits from every possible claiming strategy. We only consider claiming strategies that involve claiming on birthdays, although adjustments to benefits are made on a monthly basis. For singles, a claiming strategy is straightforward, consisting only of an age at which to claim benefits. For couples, a claiming strategy is more complex. For one-earner couples, a claiming strategy includes an age for the primary earner to claim worker benefits and an age for the secondary earner to claim spousal benefits. For two-earner couples, a claiming strategy includes an age for each individual to claim worker benefits. In addition, whenever possible, one member of the couple claims spousal benefits starting at full retirement age. For example, if both members of a two-earner couple delay worker benefits to age 70, then the primary earner can start receiving spousal benefits as early as age 68, when the secondary earner is 66.Footnote 13 Alternatively, the secondary earner can start receiving spousal benefits as early as age 66, the point at which she can ‘separate’ her spousal benefit from her worker benefit. As we show subsequently, the latter strategy generates more income for the couple over their lifetimes. Another example of a two-earner strategy involves the primary earner claiming worker benefits at age 70, the secondary earner claiming worker benefits at age 62, and the primary earner claiming a spousal benefit at age 66, as soon as he can ‘separate’ his spousal benefit from his worker benefit. On the other hand, if a strategy involves both members of the two-earner couple claiming worker benefits before age 66, then neither is able to claim a spousal benefit. Deaths are assumed to occur halfway through the year, and the widow is assumed to claim survivor benefits immediately. The widow is also assumed to follow through on his or her original plan for collecting worker benefits, and is paid the higher of the worker and survivor benefits if both have been claimed.Footnote 14
In computing present values, we use three alternative real discount rates – 0%, 2.9%, and 4% (for singles) or 5% (for couples). The safe real interest rate has been close to zero for much of the first half of 2013. In particular, the interest rate on 20-year Treasury Inflation Protected Securities (TIPS) averaged 0.19% in the first quarter of 2013, although it has risen to about 1% more recently.Footnote 15 The long-term average of safe real interest rates is closer to 2.9% – indeed, this is the long-run real interest rate assumed by the Social Security actuaries in their projections of the program's finances. Finally, a real interest rate of 4% is large enough to dissipate the gains from delay for many of our stylized singles, and a real interest rate of 5% is large enough to dissipate the gains from delay for many couples. The required interest rate is higher for couples than singles because couples tend to have larger gains from delay compared to singles.
As monthly benefits are always proportional to PIA, the present value of benefits for singles can be expressed as a constant multiple of PIA, where the constant depends on the interest rate and mortality. For couples, the relative values of the two PIAs matter as well. The present value of benefits can be expressed as a constant multiple of the primary earner's PIA, where the constant depends on the interest rate, mortality rates, and the ratio of the secondary earner's PIA to the primary earner's PIA. Importantly, this design implies that the strategy that maximizes NPV does not depend on income (for example, measured by AIME), except to the extent that mortality varies by income.Footnote 16 In addition, while the monetary gain from delay depends on the level of the PIA, the percent gain does not depend on PIA, AIME, or any other measure of income. Of course, higher income individuals may be better prepared for retirement, making it easier for them to delay benefits and take advantage of the gains from delay.
4 Results
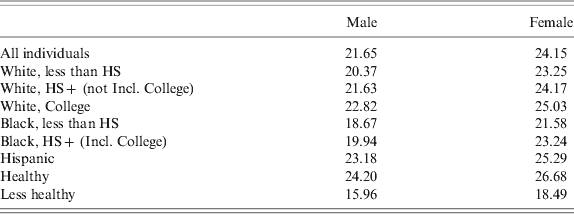
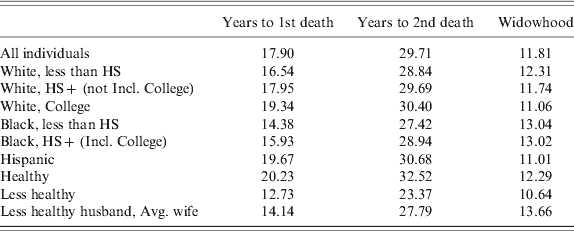
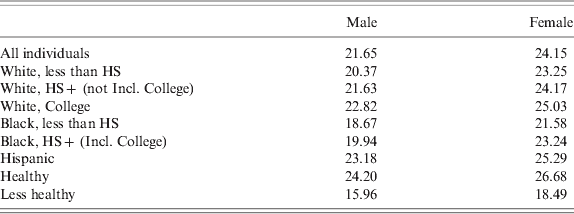
Intuitively, longer life expectancies should increase the gains from delaying Social Security. Thus, to frame our results, Table 2 indicates the remaining life expectancy for men and women in the 1951 birth cohort in each race-education and health status group, conditional on reaching age 62. From this table, it should be clear that of the race-education groups we consider, Hispanic women benefit the most from delay, while black men with less than a high school education benefit the least. For couples, the benefit from delay depends not only on the life expectancy of the primary earner, but also on the potential length of widowhood for the secondary earner. For our hypothetical couples (consisting of a male from the 1951 birth cohort and a female from the 1953 birth cohort), Table 3 presents the expected number of years to the first and second deaths, as well as the expected length of widowhood. The relative gains from delay are not as obvious for couples as for singles. For example, while black couples with less than a high school education have the shortest expected time to the first and second deaths, the expected length of widowhood is greater than average. In addition, while less healthy couples have a shorter-than-average expected time to the first and second deaths, as well as a shorter-than-average expected widowhood length, a less healthy husband and an average-health wife face a longer-than-average expected widowhood length.
Remaining life expectancy at age 62
Average length of time until first- and second-to-die (couple aged 62/60)
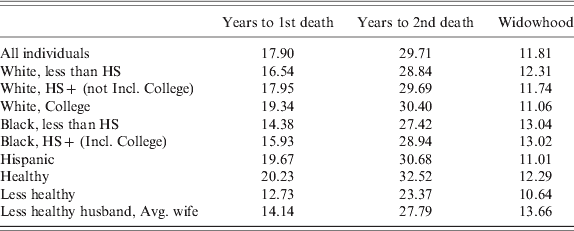
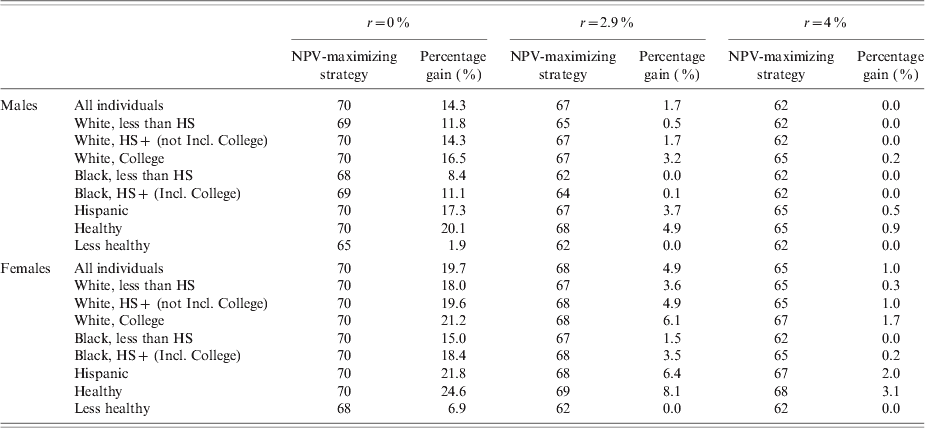
Table 4 presents the claiming strategies that maximize the net expected present value (NPV) of benefits for each of our stylized singles, as well as the percent gain in NPV relative to claiming at age 62. At a 0% real interest rate, all singles – even those with mortality rates that are twice the average (the less healthy group) – benefit from delay. Of course, the NPV-maximizing delays are shorter for groups with higher mortality rates. While the average woman maximizes NPV by delaying to age 70, a less healthy male maximizes NPV by delaying only to age 65. As expected, healthy women gain the most from delay, while less healthy men stand to gain very little.
NPV-maximizing strategies for singles
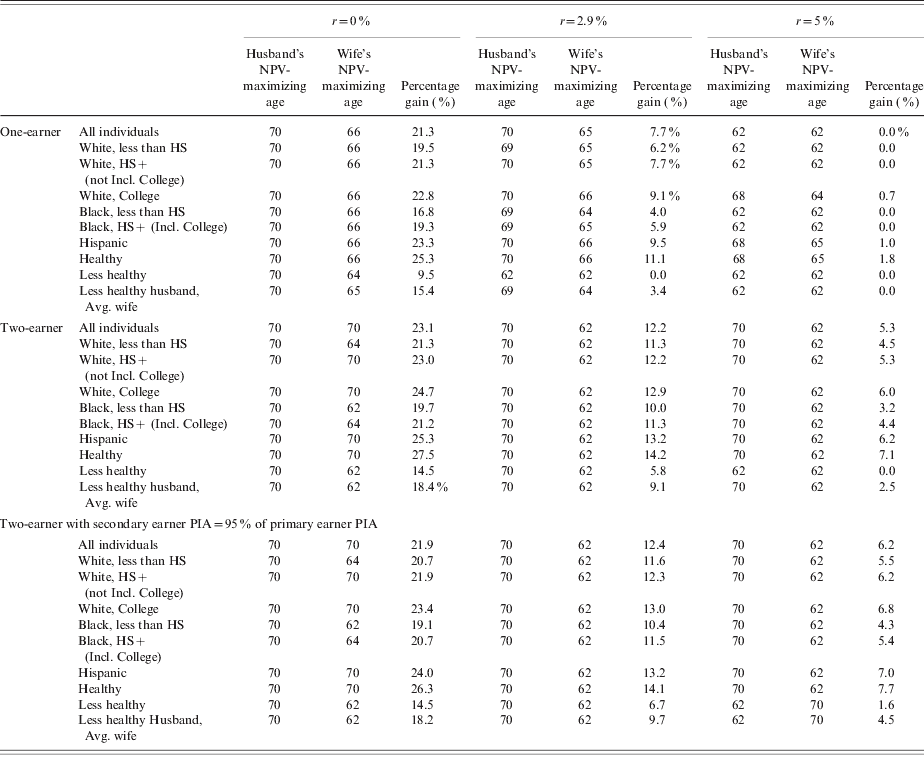
Table 5 presents the NPV-maximizing claiming strategies for each of our stylized couples, as well as the percent gain in NPV relative to both members of the couple claiming at age 62. Although not shown in the table, for every strategy involving delays beyond age 66, one member of each two-earner couple starts spousal benefits at age 66. For example, at a 0% real interest rate, both members of two-earner couples with average (or better) mortality should delay to age 70 to maximize NPV. In addition, the secondary earner should begin spousal benefits at age 66. On the other hand, if the primary earner delays to age 70, while the secondary earner collects benefits earlier, and then the primary earner should begin spousal benefits at age 66.
NPV-maximizing strategies for couples
One striking result from Table 5 is that primary earners in two-earner couples – even those with life expectancies that are far below average – should always delay to age 70 to maximize NPV. This result applies even if interest rates are close to their historical average. The gains from delaying are so large for primary earners for two reasons. First, delays by the primary earner boost the survivor benefits of the secondary earner; that is, when a primary earner delays benefits, he is effectively buying a second-to-die or joint life annuity, which is much more valuable than the single-life annuity that a single receives from delay (this is a benefit that applies to one-earner couples as well). Second, primary earners who delay beyond full retirement age can collect a spousal benefit during the delay period (this benefit applies only to two-earner couples). In contrast, when a secondary earner delays benefits, she is effectively buying a first-to-die annuity, whose benefit ends when either she dies or when her husband dies (and she switches to widow benefits). A first-to-die annuity is much less valuable than either a single-life or a second-to-die annuity. Thus, when interest rates are close to their historical average (2.9%), secondary earners do not gain from delay at all. In one-earner couples, primary earners still benefit substantially from delay due to the higher survivor benefits. However, the gains are not as large due to the fact that they cannot claim a spousal benefit during the delay period. At an interest rate of either 0% or 2.9%, almost all of our one-earner couples (with the exception of the less healthy couple with twice the average mortality) gain from delaying the primary earner's benefit. However, the NPV-maximizing delays are shorter at 2.9%. When the interest rate reaches 5%, most one-earner couples no longer benefit from delay, although many two-earner couples still enjoy modest gains.
The percent gain figures in Tables 4 and 5 do not convey how much money is at stake in adopting an NPV-maximizing strategy rather than collecting Social Security as soon as possible. In order to translate these possible percentage gains into actual dollars, one needs to know the expected present value of Social Security for the base case of commencing benefits at 62. Assuming a 0% real interest rate and average life expectancy, the NPV of Social Security (commenced at age 62) is around 200 times the PIA for singlesFootnote 17 and around 350 times the PIA of the primary earner for couples.Footnote 18 The average PIA is around $1,500. Therefore, the average single can expect to receive around $300,000 from Social Security, while the average couple can expect to receive $525,000. A single person who improves his or her NPV by 10–20% through delay stands to gain $30,000–60,000. A couple stands to gain even more – roughly 20–25%, which translates into dollar gains of around $100,000–$130,000. Higher-earning individuals – who have higher PIAs – obviously stand to gain even more. We emphasize that the amounts of money involved are substantial. Many of these gains are larger than the average 401(k) balance at the time of retirement.
For households with average life expectancy, and at an interest rate of 2.9%, our results are consistent with those of Meyer and Reichenstein (Reference Meyer and Reichenstein2010) and Munnell and Soto (Reference Munnell and Soto2005). Similar to Sun and Webb (Reference Sun and Webb2009), we find that our results hold across socioeconomic groups. Compared to Coile et al. (Reference Coile, Diamond, Gruber and Jousten2002) and Sass et al. (Reference Sass, Sun and Webb2007), we find that delay has a greater monetary payoff, and therefore, our present value maximizing delays are longer. The main reason our results are different is that these other two studies focus on older cohorts, while we focus on the 1951 birth cohort. The terms for delay beyond full retirement age are more generous for the 1951 birth cohort – they earn a credit of 8% of PIA per year, compared with 4.5% of PIA per year for the 1930 cohort.Footnote 19 Moreover, the 1951 cohort has lower mortality than older cohorts, making delay even more favorable. Nevertheless, our results are qualitatively similar: delays are actuarially advantageous for a large subset of the population, particularly at low real interest rates.
Earlier studies (reviewed in Section 2) have pointed out that households do not appear to follow NPV-maximizing strategies. Indeed, most people appear to claim benefits immediately upon turning 62 or stopping work. Thus, our simulations of the gains from delay suggest that most people are missing the opportunity to gain from delaying the commencement of their Social Security benefits.
5 Evolution of the gains from delay: 1962 versus 2050
The terms for delaying Social Security have not always been this attractive. Prior to 1956, all individuals had to claim Social Security at age 65. The 1956 amendments to the Social Security act allowed women to claim a reduced worker or spousal benefit starting at age 62 (Schottland, Reference Schottland1956). The same provision began to apply to men starting on August 1, 1961 (Cohen and Mitchell, Reference Cohen and Mitchell1961). Worker benefits claimed at age 62 were reduced to 80% of the individual's PIA, and spousal benefits claimed at age 62 were reduced to 37.5% of the working spouse's PIA. The benefit reduction formulas for worker and spousal benefits that were introduced in 1956 and 1961 are essentially the same as the ones in place today, although the normal retirement age has risen to 66. However, survivor benefits did not depend on the claiming age of either the widow or the deceased spouse. Under the 1961 amendments, a widow could receive 82.5% of the deceased spouse's PIA starting at age 62 (Cohen and Mitchell, Reference Cohen and Mitchell1961). Credits for delaying Social Security beyond full retirement age were not introduced until 1972 (Ball, Reference Ball1972). In addition, real interest rates were higher in the early 1960s than they are today. The average real interest rate over 1960–1965, as reported by the Social Security Trustees, was 2.5%.Footnote 20
To provide an idea of how the terms for delay have changed over time, we compute the gain from delaying benefits from age 62 to age 65 under current conditions (rules, interest rates, and life expectancy), and under the conditions that prevailed in 1962. We perform this calculation for single men and women, as well as for a single-earner couple and a two-earner couple. The singles are assumed to be 62 in the year of computation. The husband in each couple is assumed to be 62, and the wife 60, in the year of computation. For couples, we consider the gains from delaying both individuals’ benefits, as well as the gains from delaying only the primary earner's benefit. All individuals are assumed to face average mortality risk for their cohort.
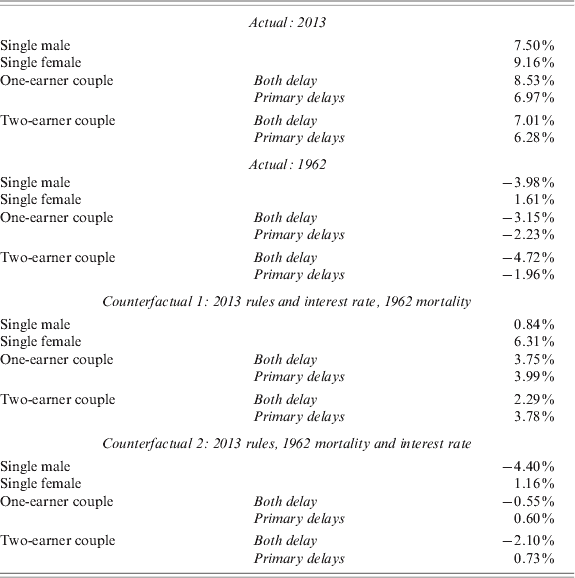
The top panel (‘Actual: 2013’) of Table 6 indicates the gains from delay under 2013 rules, life expectancy, and real interest rates (0%). The gains are substantial in all cases, but particularly for one-earner couples and single women. In this calculation, the gains are greater for one-earner couples than two-earner couples because we are considering only delays to age 65. The main advantage for two earner couples – as seen in Table 5 – occurs for delays after full retirement age, as one individual can claim a spousal benefit during that delay period. One earner couples gain the most when both spouses defer their benefit, as the gains from delaying a spousal benefit to age 65 are particularly large. The second panel (‘Actual: 1962’) of Table 6 indicates the gains from delay under 1962 rules, life expectancy, and interest rates (2.5%). While delays were slightly advantageous for single females, single males and couples actually benefited from claiming early.
Gains from delaying to Age 65
To tease out the effects of life expectancy improvements, interest rates, and rule changes, the third panel (‘Counterfactual 1’) of Table 6 presents the gains from delay under 2013 rules and real interest rates (0%) combined with 1962 mortality. Comparing the third panel with the first panel shows the impact of life expectancy improvements between 1962 and 2013. The gains from delay have increased most dramatically for men, with women and couples realizing moderate increases. This result is consistent with the fact that male mortality has improved more than female mortality over the period. The fourth panel (‘Counterfactual 2’) of Table 6 presents the gains from delay under 2013 rules, combined with 1962 real interest rates and life expectancy. Comparing the third and fourth panels isolates the impact of the higher real interest rate in 1962, which sharply reduces the gains from delay for both singles and couples. Finally, comparing the fourth panel (‘Counterfactual 2’) with the second panel (‘Actual: 1962’) reveals the effects of the rule changes that occurred between 1962 and today. The only rule change affecting singles has been a modest increase in the full retirement age, from 65 to 66. This change slightly reduced the gains from delay. For couples, rule changes have significantly increased the gains from delay. The generosity of the survivor benefit was increased in 1972, allowing a widow to receive up to 100% of the deceased spouse's PIA. However, the maximum benefit a widow could receive was constrained by the actual benefit the deceased spouse was receiving (the widow limit provision). Thus, widow benefits became sensitive to the claiming decision of the deceased spouse.
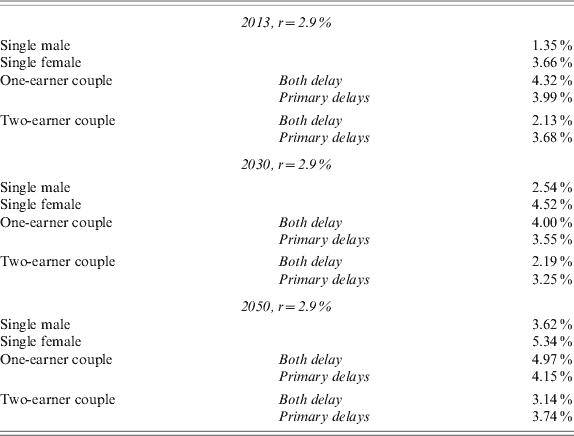
In the future, further improvements in mortality are likely to make delaying even more beneficial. In Table 7, we present the gains from delaying to age 66 for individuals and couples turning 62 in 2013, 2030, and 2050. For all calculations, we assume a 2.9% real interest rate. For the 2013 calculations, singles are assumed to be born in 1951, and couples are assumed to consist of a husband born in 1951 and a wife born in 1953. For all of these individuals, the full retirement age is 66. For the 2030 calculations, singles and husbands are assumed to be born in 1968, and wives are assumed to be born in 1970. For the 2050 calculations, singles and husbands are assumed to be born in 1988, while wives are assumed to be born in 1990. For all of the individuals in the 2030 and 2050 calculations, the full retirement age is 67. The results in Table 7 suggest that singles will experience an increase in the gains from delay in both 2030 and 2050 compared to today. If couples choose the better of the two delay strategies shown in Table 7, the gains from delay are somewhat smaller in 2030 than today as a result of the increase in the full retirement age. However, for all households, improvements in mortality can be expected to increase the gains from delay in 2050. Of course, given the state of Social Security's finances, it is likely that major reform will be adopted before 2050. However, if reform reduces the level of benefits without changing the adjustment for early or delayed claiming, then our results would still hold after reform.
Gains from delaying to age 66
How much would the adjustment for early claiming need to be changed to restore actuarial fairness in the future? Under current law, claiming a worker benefit up to 36 months before full retirement age results in a benefit reduction of 5/9 of 1% of PIA for each month. Beyond 36 months, benefits are reduced by 5/12 of 1% of PIA per month. For spousal benefits, claiming up to 36 months before full retirement age results in a reduction of 25/36 of 1% of the full benefit amount per month. Beyond 36 months, the benefit is reduced by 5/12 of a percent of the base amount per month. To make the adjustment for claiming at 62 versus 66 roughly actuarially fair in 2050, our calculations suggest that these reduction factors would need to be scaled down by around 13% for singles and 20% for couples. For example, using the current reduction factors, an individual claiming a worker benefit at age 62 in 2050 would receive 70% of his or her PIA. Similarly, an individual claiming a spousal benefit would receive 32.5% of the primary earner's PIA. If the reduction factors were 13% smaller, the worker benefit at age 62 would be 73.9% of PIA. If the reduction factors were 20% smaller, the worker benefit at age 62 would be 76% of PIA, and the spousal benefit at age 62 would be 36% of PIA. With these modified reduction factors, the change in NPV resulting from delay is <1% in absolute value for our stylized couples and singles with average life expectancy.Footnote 21
6 Conclusions
We have shown that in light of recent improvements in average mortality and declines in the real interest rate, delaying receipt of Social Security is actuarially advantageous for a large fraction of households, even those with mortality rates that are twice the average. At real interest rates closer to their historical average, delay is not actuarially advantageous for single individuals with mortality that is substantially above average; however, for married couples, primary earners with above-average mortality can gain from delay by passing on a higher survivor benefit to their spouses. The gains from delay have increased dramatically since the early 1960s, when delay first became available. This increase is due to three factors. First, life expectancy has increased markedly. Second, changes to Social Security's rules have made delay more advantageous for couples (although slightly less advantageous for singles). Third, real interest rates have fallen. We expect the gains from delay to continue to increase in the future as a result of improvements in mortality.
In terms of the empirical evidence, it is not clear why we do not see more claiming delays. One possibility is that individuals do not fully understand Social Security's rules, or that they underestimate their own life expectancy. However, Liebman and Luttmer (Reference Liebman and Luttmer2011) present survey evidence suggesting that on average, individuals are generally too optimistic about life expectancy. Furthermore, respondents have a fairly reasonable understanding of the gains from delay, at least for delays between ages 62 and 66. Alternatively, individuals may fear that legislation to address Social Security's financial shortfall could reduce their own benefits and therefore claim early to maximize benefits received before any cuts occur. While this might partly explain the failure to delay, we feel that these fears are unfounded, at least for individuals approaching retirement today. Other than proposals to change the cost-of-living index used to adjust benefits for inflation (which would affect existing beneficiaries as well), we are not aware of any serious Social Security reform proposal that reduces legislated benefits for individuals close to retirement age. Yet another possibility is that individuals may face liquidity constraints as they lack the assets required to finance a delay of Social Security. This explanation seems unlikely, however, as Hurd et al. (Reference Hurd, Smith and Zissimopoulos2004) find little relationship between wealth and delayed claiming. Finally, as we have noted, the failure to delay Social Security is closely related to the annuitization puzzle. In the case of Social Security delay, the puzzle is even stronger, as the annuities one can buy by delaying Social Security are actuarially advantageous. Moreover, the observed failure to delay Social Security suggests that the unavailability of actuarially fair annuities may not explain the lack of demand for annuities.
The actuarial fairness of the adjustment for delaying benefits has implications for Social Security's finances. A large number of individuals claim at age 62 or soon after, and very few individuals delay claiming beyond their full retirement age. In fact, there is little evidence that individuals currently choose their claiming ages to maximize the present value of their Social Security benefits. Holding labor force participation constant, we would expect Social Security's finances to deteriorate if individuals began delaying claiming in a manner that maximized the present value of their benefits. This effect is possible if delays were financed by spending down defined contribution balances. However, delayed claiming may also encourage older people to remain in the labor force longer, using labor income to finance the delay. This effect would tend to boost payroll tax revenue and improve Social Security's finances (not to mention the increase in federal income tax proceeds). Indeed this effect has been cited as a possible rationale for increasing the generosity of the delayed retirement credit or making it more attractive by paying it as a lump sum (Orszag, Reference Orszag2001; Blahous, Reference Blahous2010; Chai et al., Reference Chai, Maurer, Mitchell and Rogalla2013). Estimating the net effect of delayed claiming is beyond the scope of this paper, as it would require knowledge of the interaction between Social Security claiming and labor supply choices. However, we believe it would be a worthwhile question for future research.