Implications
Genetic selection to enhance muscle hypertrophy in beef cattle is desirable to increase beef yield from a carcass. This study has shown that selection for greater muscling increases the whole body insulin responsiveness of these animals. This is due to having a greater muscle mass, coupled with an alteration in cellular metabolism. The increased insulin responsiveness per gram of muscle tissue in the high-muscled steers combined with higher IGF-1 concentrations is likely to initiate a greater level of protein synthesis, which may partially explain the increased muscle accretion in these animals.
Introduction
Retail beef yield (RBY) is a key profit driver of the beef industry, and is improved by selecting cattle for increased muscling. Producers can select for muscling by using breed-specific estimated breeding values for eye muscle area (EMA), RBY and growth; subjective muscle scoring techniques (Elliot et al., Reference Elliot, Gahan and Sundstrom1987); cross breeding; and molecular genetic technologies that identify non-functional myostatin genes (O'Rourke et al., Reference O'Rourke, Dennis, Healy, McKiernan, Greenwood, Cafe, Perry, Walker, Marsh, Parnell and Arthur2009). Cattle selected for greater muscling have less subcutaneous fat (Perry et al., Reference Perry, Yeates and McKiernan1993) and are higher yielding (O'Rourke et al., Reference O'Rourke, Dennis, Healy, McKiernan, Greenwood, Cafe, Perry, Walker, Marsh, Parnell and Arthur2009).
Differences in quantity of muscle and adipose tissue in bovine animals selected for muscling are the direct result of an alteration in tissue metabolism. Tissue growth and deposition is the product of nutrient uptake by the cell and the balance between anabolic and catabolic processes that regulate accretion within cells (Etherton, Reference Etherton1982). Thus, animals that have more muscle and less adipose tissue may have an altered whole body response to homeostatic signals from the key regulatory anabolic hormone, insulin.
Insulin is the primary hormone responsible for uptake and storage of glucose by insulin responsive tissues in the post-prandial period. Muscle and adipose tissue are the main insulin responsive tissues in ruminants (Weekes, Reference Weekes1991), but muscle accounts for over 80% of the insulin-dependent uptake of glucose (Kraegen et al., Reference Kraegen, James, Jenkins and Chisholm1985). Therefore, a greater proportion of muscle to adipose tissue will increase the uptake of glucose per kilogram live weight in response to stimulation by insulin (Prior and Smith, Reference Prior and Smith1982). This has been demonstrated in sheep that have less fat and proportionally more muscle as a result of either lower nutrition or selection for glucose disappearance rate (Bergman et al., Reference Bergman, Reulein and Corlett1989; Francis and Bickerstaffe, Reference Francis and Bickerstaffe1996). Therefore, cattle selected for increased muscling, which have a higher ratio of muscle to fat (O'Rourke et al., Reference O'Rourke, Dennis, Healy, McKiernan, Greenwood, Cafe, Perry, Walker, Marsh, Parnell and Arthur2009), might have greater whole body responsiveness to insulin.
This study tested the hypotheses that high-muscled, leaner cattle will be more responsive to insulin as shown by greater glucose uptake in response to insulin, and more rapid glucose disappearance following an intravenous glucose tolerance test.
Material and methods
In this experiment, we measured the uptake of glucose in response to infusion of insulin in 24 Angus steers of known muscle genotype. Measurements on glucose disappearance and endogenous insulin secretion were also taken following an intravenous glucose tolerance test.
Animals
This experiment was conducted using 24 Angus steers that were selected from the New South Wales Department of Primary Industries Angus herd, which had been diverged for high and low muscling since 1990 (McKiernan, Reference McKiernan2001). They were diverged using a subjective live animal muscle score based on the thickness and convexity of the body relative to the skeletal size of the animal, adjusted for subcutaneous fat (Elliot et al., Reference Elliot, Gahan and Sundstrom1987; McKiernan, Reference McKiernan1990). A 15-point scale was used, from A+ to E−, where score A animals are heavily muscled European type breeds and E score cattle are poorly muscled or dairy type. For ease of statistical analysis, these scores equate to a score of 15 to 1. From this herd, 10 low-muscled (Low), 11 high-muscled (High) and 3 high-muscled steers, which were heterozygous for a myostatin mutation (HighHet) were selected. The HighHet cattle were selected based on the results of the genotyping of the high-muscled herd as described by O'Rourke et al. (Reference O'Rourke, Dennis, Healy, McKiernan, Greenwood, Cafe, Perry, Walker, Marsh, Parnell and Arthur2009). Animals with one copy of the myostatin 821 del11 allele were classified as being heterozygous for muscular hypertrophy (O'Rourke et al., Reference O'Rourke, Dennis, Healy, McKiernan, Greenwood, Cafe, Perry, Walker, Marsh, Parnell and Arthur2009). The 24 steers were assessed for visual muscle score by the same assessor at weaning (∼8 months of age), at ∼18 months of age and prior to harvest at ∼2 years old. The visual muscle scores of the High and HighHet muscling genotypes were 10.06 and 10.33 which equated to a B− on the 15-point scale of E− to A+ (McKiernan, Reference McKiernan1990). These scores were 5.54 ± 0.53 and 5.81 ± 0.79 higher than the Low-muscled genotype, which had an average score of 4.52 or a D on the 15-point scale.
During the experiment, the steers were fed an ad libitum quantity of a commercially available cattle pellet (Milne Feeds, EasyBeef, Perth, Western Australia) and supplemented with low-quality oaten hay as roughage. The pelleted ration contained 9 MJ/kg dry matter of metabolisable energy and 10.6% crude protein on a dry matter basis. The animals were in positive energy balance and were gaining between 0.5 and 0.8 kg/day during the experimental period.
Experiments were approved and monitored by the animal ethics committee at Murdoch University (Perth, Western Australia) with permit no. R2053/07.
Phenotype measurements and acclimation
The animals were housed in individual 3 m2 pens for 2 weeks acclimation prior to the commencement of experimental sampling. The steers were weighed and measurements for EMA and subcutaneous fat depth between the 12/13th rib and on the rump site were taken by accredited technicians using real-time ultrasound (3.5 MHz/180-mm linear array animal science probe, Esoate Pie Medical, Maastricht, The Netherlands) at the start of their acclimation periods. The animals were fed once daily at 1600 h during acclimation and daily feed residues from each steer were weighed (data not shown). Rations were initially offered at 3% of live weight and this amount was then adjusted to reflect the actual ad libitum feed intake. Feeding regimen remained the same on sampling days, with steers having direct access to a limited feed quantity and water at all times to avoid gorging.
On the day prior to insulin infusion, animals were again weighed and fitted with two catheters, one in each external jugular vein. One catheter was a long-term catheter, guide wire style, 14 gauge × 20-cm catheter with integrated extension tube (MILA International Inc., Cat. no. 1410, Erlanger, Kentucky, USA) and the other was fashioned from single lumen Teflon tubing with an outer diameter of 1.80 mm and an inner diameter of 1.20 mm (Jepson Bolton, England). The long-term catheter was for blood sampling and the other for infusion. Catheters were kept patent by filling with 2.5 × 10⁴ U/l of heparinised sterile saline (Heparin Sodium, Pharamacia Bentley, WA, Australia in NaCl 9 g/l, Baxter Healthcare, Old Toongabbie, NSW, Australia) when not in use. The catheter used for sample collection was flushed with 12.5 g/l ethylenediamine tetra acetic acid disodium salt (EDTA, Product code: ED2P, Sigma-Aldrich Pty Ltd, Castle Hill, NSW, Australia) in sterile saline between sample collections.
Hyperinsulinaemic, euglycaemic (HIEG) clamp procedure
The HIEG clamp technique, as described by DeFronzo et al. (Reference DeFronzo, Tobin and Andres1979) for use in humans and adapted for use in ruminants by Bergman et al. (Reference Bergman, Reulein and Corlett1989), was used to determine whole body glucose use in response to insulin. Prior to the infusion of insulin, basal blood glucose level was determined by taking successive samples every 15 min for a total of 60 min starting at time 0. An 8-ml sample was collected using S-Monovette Vacutainer® tubes (Sarstedt Australia Pty. Ltd, SA, Australia, Cat. no. 02.1066.001) containing EDTA to prevent clotting. The tubes were centrifuged and the harvested plasma frozen at −20°C, for later laboratory determination of glucose. In addition, a drop from each sample was measured immediately for blood glucose using portable blood glucose meters (Ascensia™ Esprit® 2, Bayer, USA). The five glucose meter readings were used to estimate basal glucose; the exact value of which was later confirmed by laboratory analysis of the full samples taken at the same time.
The insulin infusion commenced with a single dose of 6 mU/kg live weight of insulin (Actrapid®, Novo Nordisk Pharmaceuticals Pty. Ltd, Baulkham Hills, NSW, Australia) administered through the infusion catheter. A continuous infusion of insulin then commenced at a rate of 0.6 mU/kg live weight per minute using a dual channel infusion pump (LIFECARE® 5000 Plum™ Infusion system, Abbott Laboratories, North Chicago, Illinois, USA). Glucose (50% w/v; Baxter Healthcare, Old Toongabbie, NSW, Australia) was infused concurrently utilising the same infusion pump, at an initial infusion rate of around 125 ml/h. Every 5 min, 2-ml blood samples were collected and rapidly assayed using the portable blood glucose meter. Depending on the blood glucose result, the infusion rate of glucose was adjusted with the aim of establishing a constant level of blood glucose at the same level as the pre-infusion level (basal blood glucose) or euglycemia. Once euglycemia had been reached, the infusion rate of glucose was held constant for an hour and defined as the steady state glucose infusion rate (SSGIR). Blood samples were collected every 15 min into 8-ml S-Monovette Vacutainer® tubes with one drop used to confirm that euglycaemic glucose levels were being maintained and a further 8-ml centrifuged and the harvested plasma frozen at −20°C for later laboratory determination of glucose. Once complete, the rate of insulin infusion was then increased to 6 mU/kg live weight/minute and the above process repeated to establish the SSGIR of the higher insulin infusion rate. Insulin infusion was then ceased and glucose infusion was continued until blood glucose was above the euglycaemic level and stable or rising. The SSGIR required by each individual steer to maintain euglycaemia indicated whole body insulin responsiveness.
Glucose tolerance test
The intravenous glucose tolerance test was performed in conjunction with seven adrenaline challenges (McGilchrist et al., Reference McGilchrist, Pethick, Bonny, Greenwood and Gardner2011) in a randomized design over 4 days (two challenges assigned per animal per day at 0900 h and 1400 h) following the completion of the insulin infusion challenges. The glucose (50% Glucose (vv) Baxter Healthcare) challenge was administered at 200 mg/kg live weight through the infusion catheter. Blood samples were collected at −30, −15, −10, −5, 0, 2.5, 5, 10, 15, 20, 30, 45, 60, 120, 125 and 130 min relative to the intravenous glucose tolerance test into 8-ml S-Monovette Vacutainer® tubes (Sarstedt Australia Pty. Ltd. SA, Australia, Cat. no. 02.1066.001) containing EDTA. The blood tubes were centrifuged and the harvested plasma frozen at −20°C for later laboratory determination of glucose and at −80°C for determination of plasma insulin.
Plasma analysis
Plasma glucose concentrations were measured on HIEG clamp samples collected prior to glucose infusion and those collected while maintaining blood glucose at basal level when insulin was infused at both 0.6 and 6.0 mU/kg live weight per minute. Plasma glucose was also determined on the 16 samples taken between −30 and 130 min relative to the administration of an intravenous glucose tolerance test. Concentrations of glucose in plasma were measured using enzymatic methods for glucose (Kunst et al., Reference Kunst, Draeger and Ziegenhorn1984) automated within the Dupont Dimension® XL Clinical Chemistry System Auto-analyzer (Dade Behring Diagnostics, Brisbane, QLD, Australia). Plasma samples were analysed in a randomized order and variation between sample lots was monitored by using an internal plasma and glucose standard.
Plasma insulin concentrations were also determined on the 16 plasma samples taken between −30 and 130 min relative to administration of the 200 mg/kg live weight intravenous glucose tolerance test. Insulin was measured in duplicate by double-antibody radioimmunoassay method of Hales and Randle (Reference Hales and Randle1963) as modified by Bassett and Wallace (Reference Bassett and Wallace1966) and described in detail by Tindal et al. (Reference Tindal, Knaggs, Hart and Blake1978). The radioimmunoassay used a highly purified crystalline ovine insulin (Sigma) standard and an insulin antiserum (GP2, 21/07/80) that was kindly donated by Dr Peter Wynn (CSIRO Division of Animal Production, NSW, Australia).
Plasma insulin-like growth factor-1 (IGF-1) was also measured in two basal plasma samples before the HIEG clamp (taken 30 min apart) and in two basal plasma samples from the glucose tolerance test (taken 30 min apart). Feeding time and time of day was kept constant at time of sampling for IGF-1 determination across all animals. Plasma IGF-1 was assayed in duplicate by double-antibody radioimmunoassay with human recombinant IGF-1 (ARM4050, Amersham-Pharmacia Biotech, Buckinghamshire, England) and antihuman IGF-1 antiserum (AFP4892898, National Hormone and Pituitary Program of the National Institute of Diabetes and Digestive and Kidney Diseases, California, USA) following acid–ethanol extraction and cryoprecipitation (Breier et al., Reference Breier, Gallaher and Gluckman1991). All samples were processed in a single assay with a limit of detection of 0.04 ng/ml and intra-assay coefficients of variation of 3.5% at 13.2 ng/ml and 3.6% at 80 ng/ml.
Animal harvest data
Around 3 months post-study the animals were harvested at a commercial abattoir. At harvest, hot standard carcass weight (HSCW) and rump fat depth measurements were recorded. The carcasses were then chilled for 20 h, at which time they were quartered at the 10th/11th rib, and chiller measurements made as detailed by Perry et al. (Reference Perry, Shorthose, Ferguson and Thompson2001).
Modelling of response curves
Basal concentrations of glucose and insulin were calculated as the mean of samples collected at −30, −15, −10, −5 and 0 min relative to the intravenous glucose injection. The concentrations of each substrate following intravenous glucose injection were then modelled against time for each animal using a derived function with multiple exponential components as described below:
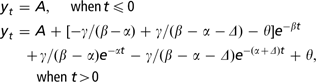
where y(t) = plasma substrate concentration at t minutes. The challenge is administered at t = 0, A = basal metabolite concentration, γ, α, Δ = stimulus parameters, β = homeostatic regulation parameter, θ = adjustment to basal metabolite concentration, after the administration of the challenge.
This function was used to determine the maximum insulin concentration, the time taken to reach the maximum insulin concentration and the area under the response curve between 0 and 20 min (AUC20) for insulin, relative to administration of the intravenous glucose. The function was also used to model plasma glucose concentration following the intravenous glucose challenge, with glucose area under curve between 0 and 60 min (AUC60) reflecting glucose disappearance rate.
Statistical analysis
SSGIR was analysed using a linear mixed effects models (SAS, 2001), to examine the effect of muscling genotype and insulin infusion rate. Basal glucose level, live weight, EMA and rump fat depth were covariates in the model, and animal within sire was the random term. Non-significant terms (P > 0.05) were sequentially deleted from the models.
Linear mixed effects models (SAS, 2001) were used to examine the effect of muscling genotype, rump fat depth, live weight and EMA, and interactions between these terms, on parameters of plasma glucose and insulin response for the glucose tolerance test. Sire was used as a random term. Basal substrate concentration prior to challenge was included in all analyses as a covariate (except where it was the dependant variable). Non-significant terms (P > 0.05) were sequentially deleted from the models.
Mean plasma IGF-1 concentration was analysed using a linear mixed effects model (SAS, 2001) with muscling genotype used as a fixed effect and animal within sire used as a random term. Live weight, HSCW, rump fat and rib fat measurements were also analysed using a linear mixed effects model (SAS, 2001) with muscling genotype used as a fixed effect and sire used as a random term.
Results
Effect of selection for muscling on animal phenotype
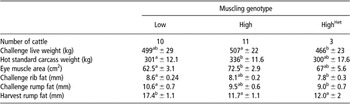
Animals for this experiment were progeny from a herd selected for high and low muscling using a visual muscle scoring system. At the time of challenge, the High genotype steers were 41.1 ± 19.8 kg heavier than the HighHet steers (P < 0.05) but the Low-muscled steers differed from neither group (Table 1). At harvest (around 3 months post-HIEG clamp), the High muscling genotype steers were larger than the Low muscling genotype steers both in terms of HSCW (P < 0.05; 35.0 ± 16.75 kg heavier), and EMA (P < 0.05; 10.0 ± 4.25 cm2 larger). This difference in EMA was still present even after correcting to the same HSCW. The HighHet steers did not differ from either group for both measurements.
Mean live weights, muscle scores, eye muscle area and fat measurements at the time of insulin infusion and at the harvest ±s.e. for low, high and high myostatin heterozygote (HighHet) muscling genotype Angus steers

a,bMean values are significantly different at P < 0.05.
At the time of challenge, subcutaneous fat measurements (Table 1) showed that the Low muscling genotype steers had 0.84 ± 0.39 and 1.68 ± 0.99 mm more rib fat and rump fat than the HighHet steers (P < 0.05), with the High muscling genotype animals differing from neither of these groups. At harvest, a similar trend was seen (Table 1) with the Low muscling genotype steers having 5.5 ± 1.56 and 5.9 ± 2.1 mm more subcutaneous fat at the rump site compared to the High and HighHet steers (P < 0.01).
Effect of muscling genotype and live weight on SSGIR during HIEG clamp
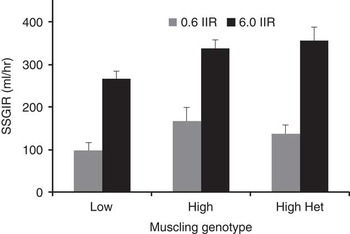
The responsiveness to insulin, during the HIEG clamp, was measured by the SSGIR required to maintain euglycaemia. At the low insulin infusion rate of 0.6 mU/kg per min, the SSGIR was 73% higher for the High muscling genotype animals when compared to the Low (P < 0.05; Figure 1). At the high insulin infusion rate of 6.0 mU/kg per min (which required an SSGIR more than double that of the low insulin infusion rate to maintain euglycaemia) the differences between genotypes were proportionately less, with the High and the HighHet genotypes having only 27% and 34% higher SSGIR (P < 0.05) than the Low-muscled genotype (Figure 1).
The effect of muscling genotype on steady state glucose infusion rate (SSGIR; 50% glucose solution) at insulin infusion rates (IIR) of 0.6 and 6.0 mU/kg/min. Values are means ± s.e.

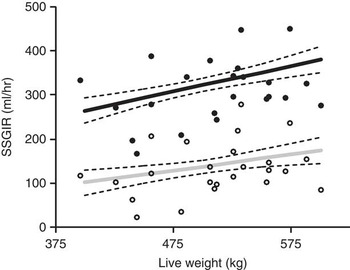
There was also a positive relationship (Figure 2) between live weight and SSGIR (P < 0.05), evident at both the high and low levels of insulin infusion. An increase of 200 kg live weight increased the SSGIR required to maintain euglycaemia by 71% at the Low and 45% at the High insulin infusion rates. The inclusion of live weight in the model did not change the effects of muscling genotypes on SSGIR. Furthermore, there was no effect of basal glucose concentration, rump fat depth or EMA on SSGIR.
The effect of live weight on steady state glucose infusion rate (SSGIR; 50% glucose solution) with predicted means ± s.e. at insulin infusion rates of 0.6 (grey line, open circles) and 6.0 mU/kg/min (black line, closed circles) across all muscling genotypes. Symbols represent the raw SSGIR measures.

Effect of muscling genotype on IGF-1
Muscling genotype had an effect on plasma IGF-1 concentration. The High-muscled cattle had 33.2 ± 1.8 ng/ml IGF-1 which was 30.4% or 7.74 ± 2.7 ng/ml higher than the Low-muscled genotype (P < 0.01). The High muscle cattle also had 35.4% or 8.67 ± 3.9 ng/ml higher IGF-1 concentrations than the HighHet genotype steers (P < 0.05).
Glucose tolerance test and insulin response
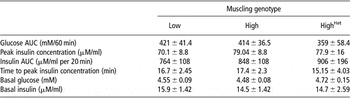
There was no difference between the three muscling genotypes for glucose AUC60 (Table 2). Muscling genotypes had no effect on peak insulin concentration, insulin AUC in the 20 min following glucose infusion or time to reach peak insulin concentration following a single intravenous glucose tolerance test (Table 2). Basal glucose and insulin concentrations of the three muscling genotype groups also did not differ (Table 2). There was no effect of live weight, eye muscle area, rump or rib fatness on these variables.
Predicted means (±s.e.) of glucose area under curve (AUC60), peak insulin concentration, insulin area under curve (AUC20) and time to peak response following an intravenous glucose tolerance test (50% Glucose; 200 mg/kg live weight) and basal blood glucose and insulin measurements ± s.e. for low, high and high myostatin heterozygote (HighHet) muscling genotype Angus steers

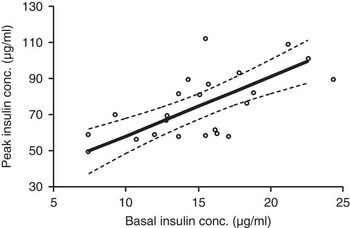
There was a positive relationship between basal insulin concentration and peak insulin concentration (P = 0.061) following an intravenous glucose tolerance test (Figure 3). Across this range a 15 mM increase in basal insulin concentration was associated with a 50 mM increase in peak insulin response. There was no relationship between peak insulin concentration and glucose disappearance (glucose AUC60) following an intravenous glucose tolerance test when peak insulin concentration was included in the model as a covariate (P > 0.05), and this did not change irrespective of whether the model was adjusted for rump or rib fat depths, EMA or live weight.
The effect of basal insulin concentration on peak insulin concentration following an intravenous glucose tolerance test (50% Glucose; 200 mg/kg live weight) with predicted means (heavy line)±s.e. (fine dotted lines) across all muscling genotypes. Round symbols are raw data and each represents an experiment on a single animal.

Discussion
Muscling genotype effect on insulin responsiveness
This study has shown that selection for muscling in cattle increases whole body insulin response, as demonstrated by the greater SSGIR required in the High and HighHet genotype Angus steers to maintain euglycaemia. This supports our initial hypothesis that was based upon the fact that muscle accounts for over 80% of the insulin-dependent use of glucose (Kraegen et al., Reference Kraegen, James, Jenkins and Chisholm1985). Therefore, animals from high muscling groups, which have a greater proportion of muscle (O'Rourke et al., Reference O'Rourke, Dennis, Healy, McKiernan, Greenwood, Cafe, Perry, Walker, Marsh, Parnell and Arthur2009), would have increased uptake of glucose under insulin infusion. The High and HighHet steers from this study actually had 1.93% and 4.7% more muscle per kilogram hindlimb weight than the low-muscled steers as determined by computer-aided tomography scans (data not shown). As such, the insulin infused into the High and HighHet steers represented a lower infusion rate on a per kg muscle basis than for the Low steers. Yet in spite of this, their SSGIR was far greater, with glucose utilisation rates 32% to 73% higher than the Low-muscled steers. The quantity of glucose utilised per kilogram of muscle (assume 80% of SSGIR) during insulin infusion could be calculated using figures from the harvest of these 24 animals as follows: (0.8 × SSGIR)/((Live weight at challenge (kg) × (HSCW (kg)/final live weight (kg)) × percentage of muscle in hindlimb as determined by computer-aided tomography scans). This calculation shows that the Low, High and HighHet steers utilise 0.42, 0.55 and 0.71 ml/h per kg muscle at the low level of insulin infusion and 1.17, 1.26 and 1.66 ml/h per kg muscle at the high level of insulin infusion. Therefore, the effect of muscling genotype on insulin response and SSGIR is driven by factors other than simply more muscle mass, and is likely to reflect an alteration in cellular metabolism.
Differences in cellular metabolism may be associated with shifts in muscle fibre type. High-muscled cattle have a greater proportion of glycolytic type IIX myofibres (Wegner et al., Reference Wegner, Albrecht, Fiedler, Teuscher, Papstein and Ender2000; Greenwood et al., Reference Greenwood, Cafe, O'Rourke and McKiernan2006). Hocquette et al. (Reference Hocquette, Bornes, Balage, Ferre, Grizard and Vermorel1995) showed that glycolytic and oxido-glycolytic muscles in beef calves had higher expression of glucose transporter-protein (GLUT4) than in oxidative muscles, which is in contrast to research in rats (James et al., Reference James, Strube and Muecdler1989; Henriksen et al., Reference Henriksen, Bourey, Rodnick, Koranyi, Permutt and Holloszy1990; Goodyear et al., Reference Goodyear, Hirshman, Smith and Horton1991; Marette et al., Reference Marette, Richardson, Ramlal, Balon, Vranic, Pessin and Klip1992) and humans (Lillioja et al., Reference Lillioja, Young, Culter, Ivy, Abbott, Zawadzki, Yki, Christin, Secomb and Bogardus1987). Glucose transport is the rate-limiting step in insulin-stimulated glucose utilisation in muscle cells across most species (Ziel et al., Reference Ziel, Venkatesan and Davidson1988; Hocquette et al., Reference Hocquette, Bornes, Balage, Ferre, Grizard and Vermorel1995; Zierler, Reference Zierler1999). Thus, beef cattle that have been selected for muscling, causing increased glycolytic IIX myofibres and greater GLUT4 expression, will have increased muscle responsiveness to insulin.
Another alternative explanation, for the differences in SSGIR between high- and low-muscled cattle, may be linked to differences in adipose responsiveness to insulin. Research in obese humans has shown that as adipose cells enlarge, their responsiveness to insulin decreases (Salans et al., Reference Salans, Knittle and Hirsch1968). Work in sheep has demonstrated that as they become fatter, fat cells enlarge and adipose vascularity decreases (Gregory et al., Reference Gregory, Christopherson and Lister1986). The Low muscled, fatter cattle in this study may have had larger adipose cells, and thus glucose disappearance into adipose was possibly decreased under hyperinsulinaemic conditions in these animals. This theory is also supported by findings of lower adipose responsiveness to insulin in obese heifers (McCann and Reimers, Reference McCann and Reimers1985) and obese sheep (Bergman et al., Reference Bergman, Reulein and Corlett1989). Therefore, in our study, the effect of increased adiposity and decreased glucose utilisation per gram of adipose tissue may be additive in reducing the responsiveness to insulin of lower muscled, fatter cattle. However, the high-muscled cattle are leaner suggesting that there may also be a catabolic mechanism controlling accretion of adipose in these animals (McGilchrist et al., Reference McGilchrist, Pethick, Bonny, Greenwood and Gardner2011).
The increase in insulin responsiveness in high-muscled cattle may be responsible for increasing muscle synthesis in these animals. Insulin can rapidly activate protein synthesis by stimulating components of the translational machinery including eukaryotic initiation factors and eukaryotic elongation factors (Proud, Reference Proud2006). These factors are important for initiation and the elongation phase of protein synthesis (mRNA translation). Furthermore, insulin can increase cell ribosome number, which will increase the cells capacity to synthesise protein (Proud, Reference Proud2006).
In addition, the elevated IGF-1 levels evidenced in the High-muscled genotype cattle may also have had an impact. IGF-1 has been shown to stimulate protein synthesis in muscle cell cultures (Ballard et al., Reference Ballard, Read, Francis, Bagley and Wallace1986; Roeder et al., Reference Roeder, Hossner, Sasser and Gunn1988) and in vivo when circulating amino acid concentrations are not limiting (Russell-Jones et al., Reference Russell-Jones, Umpleby and Hennessy1994; Umpleby and Russell-Jones, Reference Umpleby and Russell-Jones1996). Thus, when animals have adequate nutrition during the growth phase and amino acid substrate supply is not limiting, IGF-1 generates increased protein synthesis (Umpleby and Russell-Jones, Reference Umpleby and Russell-Jones1996). As such, the impact of IGF-1 and insulin may both have combined to produce the greater muscularity of the High-muscled genotype cattle.
Glucose disappearance and insulin secretion following a glucose tolerance test
The clamp-derived insulin responsiveness differences between muscling genotypes would suggest that the high muscling genotype steers should have a greater rate of glucose disappearance for an equivalent insulin input. However, muscling genotype did not affect glucose disappearance following an intravenous glucose tolerance test. There was also no difference in insulin secretion following an intravenous glucose tolerance test. Thus, insulin responsiveness differences between muscling genotypes measured using the HIEG clamp could not be paralleled using the relatively crude glucose tolerance method of analysis, possibly because the variation between genotypes and the sample size was too small. In support of this, the glucose tolerance test is generally only capable of identifying large variations between normal humans and humans with impaired glucose tolerance due to non-insulin-dependent diabetes mellitus (Nolan et al., Reference Nolan, Ludvik, Beerdsen, Joyce and Olefsky1994). Other studies using glucose tolerance tests to examine insulin sensitivity in cattle have also found no differences (Vasconcelos et al., Reference Vasconcelos, Sawyer, Tedeschi, McCollum and Greene2009) possibly due to the lack of sensitivity of the test.
Basal insulin had a positive correlation with peak insulin release following the glucose stimulus. Higher basal insulin levels and the associated higher peak insulin concentration following glucose challenge are indicators of reduced sensitivity to insulin in these cattle. This is further supported by the observation that the increased insulin release following glucose challenge did not lead to greater glucose disappearance rates, thus these animals were dependant upon greater insulin release to achieve the same rate of glucose disappearance. This indicates that within this herd, there is some evidence for loss of insulin sensitivity, but this was not associated with a muscling genotype effect.
Effect of myostatin mutation
Overall High and HighHet genotypes were relatively similar in their whole body response to insulin as indicated by SSGIR. The key point to note with this genotype is that the presence of the myostatin mutation was not additive to the response of the High muscling genotype as previously thought generating the greater degree of muscling and phenotypic leanness seen in these animals. This suggests that the response of the HighHet steers to insulin is not largely associated with the 821 del11 myostatin mutation.
Conclusion
The higher muscled animals had greater whole body insulin responsiveness under HIEG clamp conditions. However, there was no effect of muscling genotype on glucose disappearance or insulin secretion following an intravenous glucose tolerance test. The increased whole body insulin responsiveness of the high-muscled steers is likely to be driven by greater quantity of muscle combined with an increased uptake of glucose into muscle and adipose cells. Greater muscle responsiveness to insulin combined with higher IGF-1 concentrations in the High-muscled steers may also initiate increased protein synthesis, partially explaining the greater level of muscularity in these animals.
Acknowledgements
The authors would like to thank the Australian Cooperative Research Centre for Beef Genetic Technologies and Murdoch University for funding this project. We also like to thank staff from Harvey Industries Group Pty Ltd and Murdoch University for their continued cooperation and support during this project especially Kim Thomas, Malcolm Boyce and Barbara Waldock. Thanks also to Peter Kamphorst and staff at Glen Innes Industry and Investment New South Wales research property for their procurement and care of the animals prior to their arrival in Western Australia. Taron Brearley assisted in the development of the modelling equations and is thanked for his contribution.