I. INTRODUCTION
There are various types of sensors that are used in day-to-day life for specific purposes. Humidity sensor is one of such devices. ZnO is a very versatile compound semiconductor with a band gap of about 3.3 eV. Zinc Oxide is a promising semiconductor for humidity as well as gas sensing applications. Scientists have been studying ZnO thin film and nanostructures for the detection of toxic gases, combustion gases, pollutants, and organic vapors. Humidity or gas systems are also used in various scientific research laboratories worldwide. Researchers are developing cutting edge humidity sensors that show superb sensitivity, low hysteresis, and other amazing properties. Humidity or gas sensors that are developed using ceramic material have attracted much attention due to their chemical and physical stability. By doping ZnO with different elements its electrical properties can be enhanced. Currently, scientists are focusing more and more on impedance or resistive type humidity sensors due to low cost and better performance. Resistive humidity sensors are also developed using polymers. Investigations were also carried out by Jeseentharani et al. for analyzing humidity sensing properties of the composites prepared by mixing 1:1 mole ratio of CuO–ZnO, CuO–NiO, and NiO–ZnO compound. The samples were sintered at 800 °C for 5 h and then subjected to resistance measurements as function of relative humidity (RH) in the range of 5–98% RH. It was noticed that CuO–NiO compound possessed the best humidity sensitivity. The response and recovery times of the CuO–NiO composites were 80 and 650 s, respectively. Reference Jeseentharani, Jeyaraj, Pragasam, Dayalan and Nagaraja1 Kutty et al. have reported the varistor properties of polycrystalline ZnO:Cu. Reference Kutty and Raghu2 Chiou et al. and Bellini et al. extensively studied Cu as an important additive in the ZnO based varistors. Reference Chiou and Chung3,Reference Bellini, Morelli and Kiminami4 The role of Copper in the Zinc oxide-based sensing materials is different from other dopants such as Mn, Co, Br, and Pt. Jayanti et al. reported that ZnO nanocrystals doped with different groups of impurities, e.g., Li, Na, Cu, Pr, and Mg synthesized by solid–state reaction method under similar conditions exhibit different morphology. Their studies show that undoped ZnO, Li, and Na doped ZnO showed well-formed nanorods but Cu doped ZnO nanorods are not so well formed and tends to form clusters. Reference Jayanti, Chawla, Sood, Chhibara and Singh5
Yawale et al. doped semiconducting materials SnO2 and ZnO with TiO2 and Al2O3 and screen printed them in the form of a film. DC-electrical resistance of the films were measured in the presence of humidity. They found SnO2–5Al2O3 and ZnO–5Al2O3 to be good sensing materials for humidity. Rutile and hexagonal structures of SnO2, ZnO, and Al2O3 and their nanometer grain sizes were found to be responsible for formation of nanometer sized pores, which ultimately adsorbed water. The adsorption of water (physisorbed water) on a hydroxylated surface caused electron injection. Reference Yawale, Yawale and Lamdhade6 Li et al. investigated the complex impedance spectra of the thin-film humidity sensors prepared using in situ synthesized inorganic/organic nanocomposites of sodium polystyrenesulfonate (NaPSS) and ZnO. The logarithm of the impedance of sensor based on composite film changed linearly by four orders of magnitude over the humidity range (11–97% RH). Reference Li, Yang and She7 Humidity sensors are also developed using capacitive technique. In this case the dielectric constant value of the thin film changes due to the change in the humidity level and in this way the RH change is detected. The materials that are commonly used in the development of humidity-sensitive dielectrics are polyimide films. These materials provide high sensitivity, linear response, low response time, and low power consumption. Reference Qui, Azeredo-Leme, Alcacer and Franca8–Reference Matsuguchi, Kuroiwa, Miyagishi, Suzuki, Ogura and Sakai11 Nanomaterials have larger surface area and smaller grain size and hence these materials find remarkable applications in electronic and optoelectronic devices. Numerous useful properties are shown by nano sized zinc oxide due to large band gap and high exciton binding energy. It also gives diverse and large range of growth of different types of morphologies like nanocombs, nanowires, nanobelts, nanorings, and nanosheets that can be used for various applications. Reference Bai, Hu, Li, Luo, Chena and Liub12–Reference Cheng, Zhao, Huo, Gao and Zhao17 The technology of various types of sensors is getting upgraded day by day. Humidity and gas sensors are very important as these are used in various industrial areas as well as in scientific laboratories. The investigation on electrical applications of the nanomaterials is very important as they are used in the development of the gas and humidity sensors. Moreover, activation energy gives us a deep understanding of the electrical properties of the nanomaterials. Metal oxides like zinc oxide (ZnO) have various applications in gas and humidity sensing. Zinc oxide material is suitable for use in various temperature sensing materials. Reference Wang, Kangand and Ren18–Reference Sui, Xia, Wang, Xu, Yan and Liu20 Synthesis methods play very important role to control the size and surface area of materials. One of the most widely used transparent conducting films is that of zinc oxide as it is inexpensive, highly resistant, and mechanically stable. Due to this fact this material is getting more and more attention for its use as a humidity sensor. Extensive analysis has been done on the nano-sized powders of the semiconductor metal-oxide for the development of the low cost humidity and gas sensors. Doped zinc oxide exhibits different types of morphologies, various properties, and has many applications. Various humidity sensors have also been developed using materials that provide high sensitivity, linear response, low response time, and low power consumption. Reference Qui, Azeredo-Leme, Alcacer and Franca8,Reference Dokmeci and Najafi9,Reference Wang, Feng, Sun, Segre and Stetter21–Reference Jachowicz and Weremczuk24 Misra et al. studied humidity sensing application of undoped and Al2O3-doped ZnO nanomaterials. In this case, the sensing element with 15 wt% of Al2O3–ZnO nanocomposite showed the best results with the sensitivity of 14.98 MΩ/%RH for annealing temperature of 600 °C. Sensitivity for undoped ZnO was 12.35 MΩ/%RH for annealing temperature of 600 °C, hysteresis was within ±2% and response/recovery time 91/315 s. Reference Misra, Pandey, Shakya and Roy25 Pandey et al. studied moisture sensing application of Cu2O-doped ZnO nanocomposite. They showed that the sample with 20% of Cu2O–ZnO nanocomposite showed best results with sensitivity of 4.78 MΩ/%RH for annealing temperature of 400 °C. Reference Pandey, Tiwari and Roy26 In the present work sensitivity in the case of Cu-doped ZnO thin films is nearly 61.73% higher than Al2O3 doped ZnO and 87.79% higher than Cu2O doped ZnO.
II. SAMPLE PREPARATION AND EXPERIMENTAL PROCESS
Cu-doped ZnO thin films were developed in the experimental process. Zinc acetate [Zn(CH3COO)2·2H2O] was used as starting material, methanol as organic solvent, and monoethanolamine as surfactant. All the sols were prepared in a volume of 50 cc and concentration of 0.5 M. Firstly, zinc acetate dihydrate was dissolved in a mixture of methanol and MEA at room temperature. For the doping of Cu, copper sulfate was used and the doping percentages were 1, 3, 5, 7, and 8 at.%. Then each of the mixtures prepared were vigorously stirred by a magnetic bar for 2 h. The solution then became homogeneous and allowed to age for 24 h. Then, the aged solution was used for the preparation of thin films using a spin coating device. The prepared solution was spin coated on glass substrate for the development of thin films. Thin films were annealed in air from 300 °C to 600 °C for 3 h in an electric muffle furnace. After annealing, samples were analyzed for activation energy and humidity sensing studies. The prepared thin film samples were labeled as CZ-1 (1 at.% doping), CZ-3 (3 at.% doping), CZ-5 (5 at.% doping), CZ-7 (7 at.% doping), and CZ-8 (8 at.% doping). The undoped ZnO thin films were prepared using a spin coating device and the sample was labeled as CZ-0. The thickness of the CZ-7 thin film annealed at 600 °C was found to be 780 nm. The thickness of the CZ-0 thin film annealed at 600 °C was found to be 960 nm.
III. ACTIVATION ENERGY
Activation energy (ΔE) measures the thermal or other form of energy required to raise electrons from the donor levels to the conduction band or to accept electrons by the acceptor levels E a from the valence band respectively for n- and p-type semiconductor materials. Activation energy corresponds to the energy difference (E c − E d) and (E a − E v) respectively for n- and p-type semiconductor materials. Equation (1) gives the activation energy value.
 $$R = {R_{\rm{o}}}\,{{\rm{e}}^{{{ - \Delta E} \mathord{\left/ {\vphantom {{ - \Delta E} {2kT}}} \right. \kern-\nulldelimiterspace} {2kT}}}}\quad ,$$
 $${\rm{Therefore,}}\quad {\rm{In}}\left( R \right) = {\rm{In}}\left( {{R_{\rm{o}}}} \right) - {{\Delta E} \mathord{\left/ {\vphantom {{\Delta E} {2kT}}} \right. \kern-\nulldelimiterspace} {2kT}}\quad .$$
Here, R = resistance, R o = constant, ΔE = activation energy of electronic transport, k = Boltzmann's constant, and T = absolute temperature.
For an n-type semiconductor, the following equation holds:
 $$\sigma = {\sigma _{\rm{o}}}\,{{\rm{e}}^{{{ - \Delta E} \mathord{\left/ {\vphantom {{ - \Delta E} {2kT}}} \right. \kern-\nulldelimiterspace} {2kT}}}}\quad .$$
Here, σ = conductivity, σo = 2eμe[2πm e* (kT/h 2)]3/2, ΔE is the activation energy of electronic transport, m e* is the effective mass, μe is the mobility of electron, e = electronic charge, k = Boltzmann's constant, T = absolute temperature, and h is the Planck's constant.
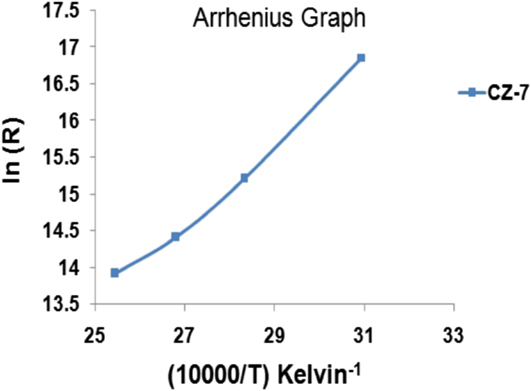
From the slope of the plot ln(R) versus 1/T graph [using Eq. (2)], value of activation energy for electronic transport may be calculated. Figure 1 shows Arrhenius Graph for activation energy for sample CZ-7. The activation energy value for sample CZ-7 from the Arrhenius plot was found to be 1.021 eV for temperature range 50 °C–120 °C. Sample of SnO2-doped ZnO nanomaterial showed lower value of activation energy indicating that this sensing element had lower operating temperatures and could be used at room temperature as well.
Arrhenius graph for activation energy for sample CZ-7.

IV. SCANNING ELECTRON MICROSCOPE (SEM) STUDY
The analysis on the surface morphology of Cu-doped ZnO thin films was carried out using SEM (LEO-430, Cambridge, England). Figures 2 and 3 show SEM micrographs of the thin films CZ-0 (undoped ZnO) and CZ-7 annealed at temperature 600 °C, respectively. From the SEM it is observed that grains of nanocomposites formed are scattered all over the substrate and a network of pores is formed. These pores are responsible for the formation of sites for humidity adsorption. The SEM micrographs of these sensing element show great clustering and agglomeration of large number of crystallites. As temperature increases it is found that porosity of the material increases forming clusters for Cu doped in ZnO. The porous structure is dependent on the composition. From the SEM micrographs, it can be observed that the inter-granular pores are linked through the large pores. The pore structures should be regarded as interconnected voids that form a kind of capillary tubes. This structure favors the enhanced rate of adsorption and desorption of water molecules. The average grain size calculated from SEM micrograph for sensing elements CZ-0, CZ-1, CZ-3, CZ-5, CZ-7, and CZ-8 are shown in Table I. The average grain size for the sensing elements CZ-7 and CZ-0 (undoped ZnO) calculated from SEM micrographs are 36 and 42 nm, respectively.
SEM of sample CZ-0 annealed at 600 °C.

SEM of sample CZ-7 annealed at 600 °C.

Grain size by SEM (nm).

V. X-RAY DIFFRACTION ANALYSIS
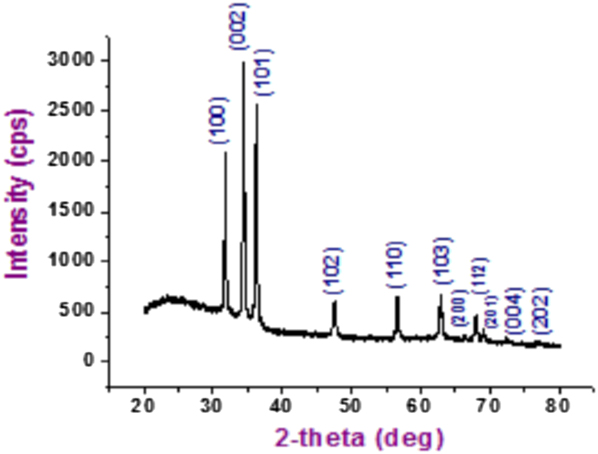
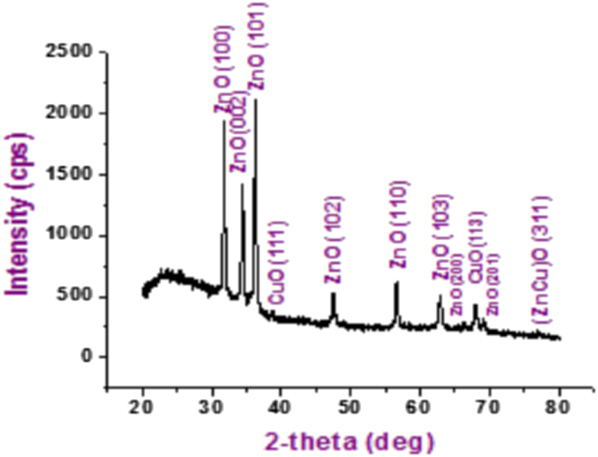
The x-ray diffraction study was performed using XPERT PRO-Analytical XRD system (Netherlands). The Cu Kα source was used for XRD and its wave length is 1.54060 Å. Figures 4 and 5 show x-ray pattern for the sensing elements CZ-0 and CZ-7 annealed at 600 °C, respectively. The average crystallite size of the samples has been calculated using Scherrer's formula,
 $$D = {{0.9\lambda } \mathord{\left/ {\vphantom {{0.9\lambda } {\left( {{\rm B}\,{\rm{cos}}\,\theta } \right)}}} \right. \kern-\nulldelimiterspace} {\left( {{\rm B}\,{\rm{cos}}\,\theta } \right)}}\quad .$$
XRD of sample CZ-0 annealed at 600 °C.
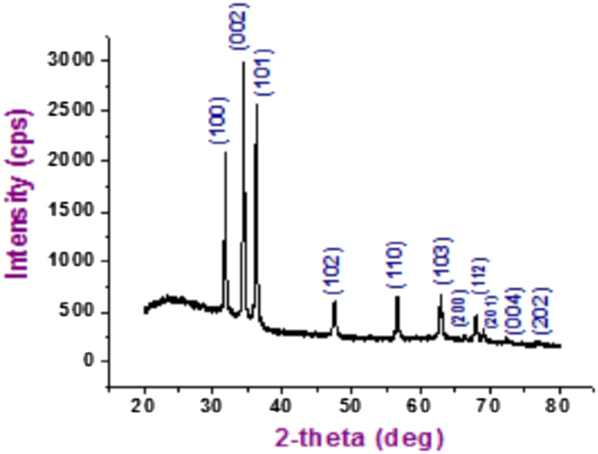
XRD of sample CZ-7 annealed at 600 °C.
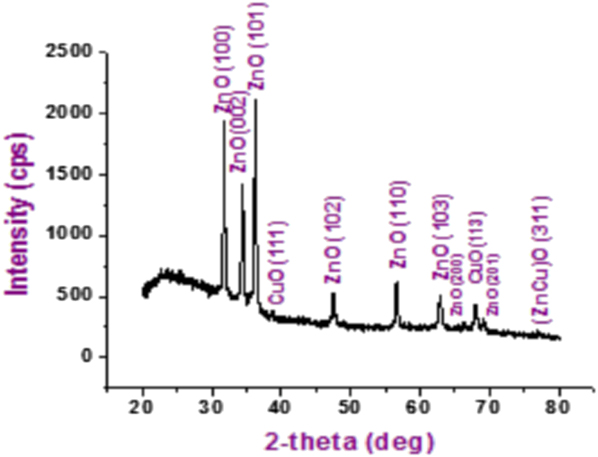
Here, D is the crystallite size, λ is the x-ray wave length, θ is the Bragg angle, and B is the full width at half maximum of the peak. The crystallite size for the sensing element CZ-0 annealed at 600 °C calculated from Scherrer's formula is in the 24–38 nm range. For the sensing element of CZ-7 the range of crystallite size is 25–41 nm.
VI. EXPERIMENTAL
A special humidity control chamber was designed for performing humidity sensing studies. For the calibration purpose, standard hygrometer, and a thermometer was used inside this chamber. The change in resistance was recorded with change in RH. Standard hygrometer was used for measuring RH. Resistance variation of the thin films was recorded using a resistance meter (Sinometer, ±0.001 MΩ). For measuring the resistance of the thin films we have prepared silver electrodes. For making the electrical contacts on the surface of the thin films, silver electrodes were developed at the ends of the thin films. After performing the study of humidity sensing properties, sensing elements were kept in laboratory environment and their humidity sensing characteristics were regularly monitored. To see the effect of ageing, the sensing properties of these sensing elements were examined again in the humidity control chamber after a span of six months.
VII. SENSING MECHANISM
As the humidity increases, excess protons start diffusing through the hydrogen bond network of molecules. In other words, protons start tunneling from one water molecule to the next through hydrogen bonding. During first stage of adsorption water molecules come in contact with the material and an adsortion complex is formed. This phenomenon is known as chemisorption. During further adsorption, the adsorption complex forms bonds with the water molecules through hydroxyl groups and hence water molecules get adsorbed on the surface through hydrogen bonding. This is physical adsorption. So, during the first physisorption the layer formed is immobile due to the absence of the hydrogen bonds formed between the water molecules in this layer. Therefore, no proton could be conducted in this stage. When the RH increases, mobile layers of water molecules are formed with the presence of hydrogen bonds between water molecules and this is responsible for the conduction of protons in this stage. Sometimes due to the breaking of bonds and formation of new bonds the path of proton conduction changes. Due to this there is sudden change in the surface energy of the thin films. Due to sudden change in the surface energy, hysteresis phenomenon may arise. Either ionic or electronic type mechanism is responsible for the conduction mechanism in the sensors based on the ceramic materials. Electrons are donated by the water molecules in the electronic type mechanism. These water molecules get chemisorbed and hence in this way the electronic conductivity gets increased or decreased. This conductivity actually depends on the fact whether the material is p-type or n-type semiconductor. If the mechanism is ionic type then the impedance of the sensor decreases with increase in the value of RH due to the formation of the physisorbed layer and condensation of the water molecules in the capillary on the material's surface. As soon as the nanomaterials developed from the ZnO come in contact with humid air, the chemisorption process starts and the water molecules chemisorb on the available sites of the material surface. Firstly, the chemisorbed layer is formed due to the dissociative chemisorption process and thereafter the physisorbed layer is formed. The electrons are accumulated at the surface of ZnO and consequently, the resistance of the sensing element decreases with increase in RH. Cu-doped ZnO thin films enhance the adsorption and desorption rates of the water molecules and hence helps in increasing the sensitivity of the material.
VIII. RESULTS AND DISCUSSION
A. Humidification graphs
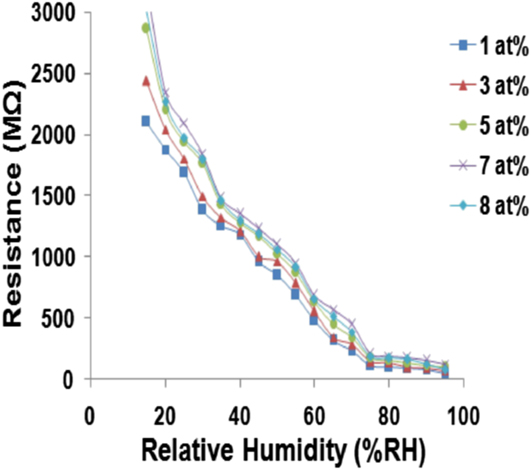
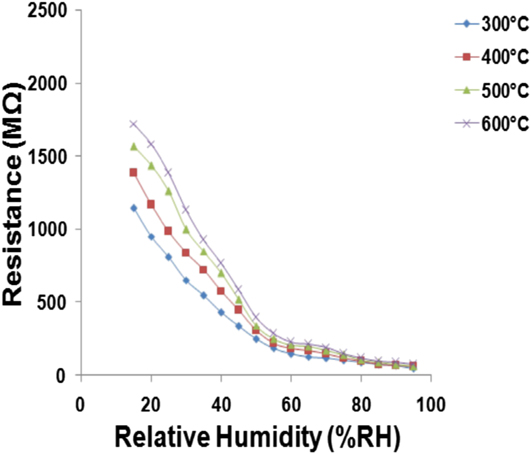
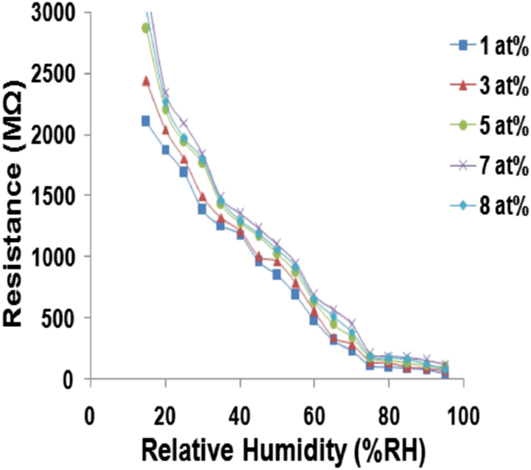
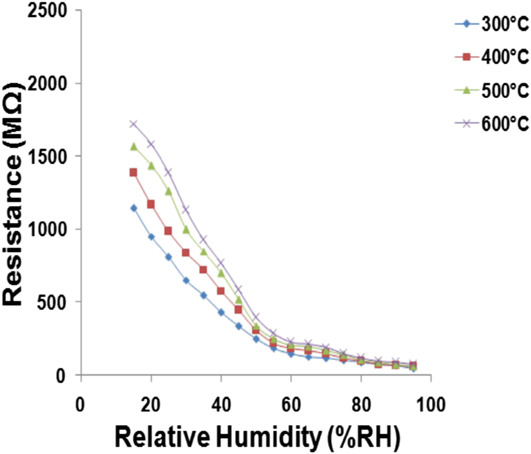
For sensing elements CZ-1, CZ-3, CZ-5, CZ-7, and CZ-8 annealed at 600 °C, a graph has been plotted between resistance and %RH for the humidification process and is shown in Fig. 6. A continuous decrease in the value of resistance is seen with increase in the %RH for all these sensing elements in the 15–95% RH range. Variation of resistance with change in %RH for the sensing elements CZ-0 annealed at temperatures 300 °C–600 °C for the humidification processes in the 15–95% RH range are shown in Fig. 7. It has been observed that there is continuous decrease in the value of resistance with increase in the %RH for all these sensing elements. All the sensing elements of Cu-doped ZnO thin films are showing sharp decline in the values of resistance up to RH 75% RH while that in the case of undoped ZnO thin films sharp decline can be seen in the values of resistance up to RH 60% RH. An increase in the sample's conductivity has been observed in the lower range of the RH (<75% RH) for Cu-doped ZnO thin films. The reason assigned to this is that the water molecules get adsorbed on the surface of the thin film with capillary nanopores. If the porosity of the material increases then due to this surface to volume ratio of the materials also increases and hence the process of diffusion of water molecules into or out of the pores also increases; and in this way good sensitivity is achieved. When the RH becomes high (>75% RH) then the water molecules in the capillary like pores condenses due to which a liquid like layer is formed. If there is variation of grain boundary barrier height then also the resistance may decrease. In this case, adsorption of water molecules at metal oxide surface penetrated inside the sample can decrease the height of potential barriers at the surface of grains and at the surface of necks between metal oxide grains. Therefore, size of depletion regions in the vicinity of necks in the direction of electric field is lowered and conductance of ceramics is increased. When the water molecules get penetrated inside the pores then there may be a decrease in barrier height of grain boundary potential in an exponential manner and even slight decrease of grain boundary barrier height due to RH can cause considerable decrease of resistance (or increase of conductance).
Variation of resistance with change in %RH for the sensing elements CZ-1, CZ-3, CZ-5, CZ-7, and CZ-8 annealed at 600 °C for humidification process.
Variation of resistance with change in %RH for the sensing elements CZ-0 annealed at different temperatures for humidification process.
1. Regression analysis
A regression analysis of the humidification graphs of undoped and Cu-doped ZnO was carried out.
A polynomial of sixth degree (given below) fitted to the curve of resistance versus %RH graph of the sensing element CZ-7 annealed at 600 °C.
 $$y = \;2 \times {10^{ - 08}}{x^6} - 2E - 05{x^5} + 0.003{x^4} - 0.417{x^3} + 22.56{x^2} - 626.3x + 8744\quad .$$
Here, x = %RH and y = resistance in MΩ.
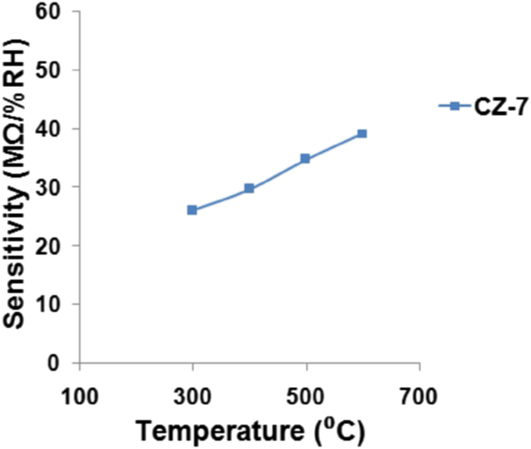
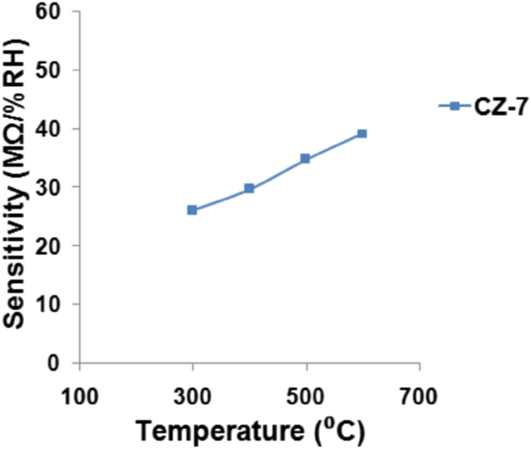
Moreover, it is also found that a polynomial of third degree (given below) fitted to the curve of sensitivity versus temperature graph of the sensing element CZ-7.
 $$y = - 4 \times {10^{ - 07}}{x^3} + 0.000{x^2} - 0.195x + 47.08\quad .$$
Here, x = temperature and y = sensitivity in MΩ/%RH.
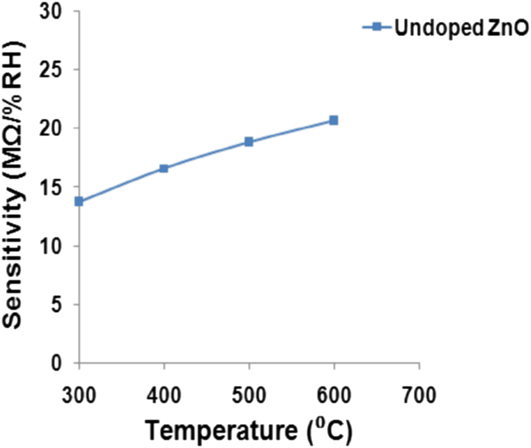
Also, for the sample CZ-0 a polynomial of third degree (given below) fitted to the curve of sensitivity versus temperature graph.
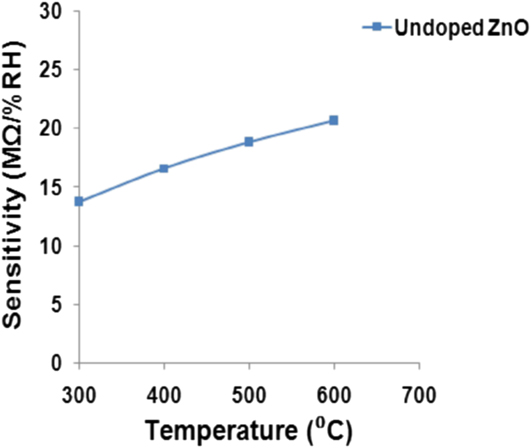
 $$y = 5 \times {10^{ - 08}}{x^3} - 9E - 05{x^2} + 0.075x - 1.94\quad .$$
Here, x = temperature and y = sensitivity in MΩ/%RH.
B. Sensitivity
Sensitivity of the humidity sensor is defined as the change in resistance (ΔR) of the sensing element per unit change in %RH,
 $$S = {{\Delta R} \mathord{\left/ {\vphantom {{\Delta R} {\left( {\Delta \% {\rm{RH}}} \right)}}} \right. \kern-\nulldelimiterspace} {\left( {\Delta \% {\rm{RH}}} \right)}}\quad .$$
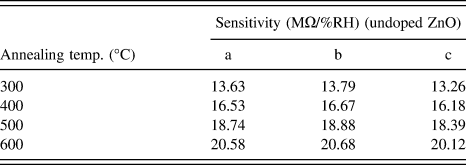
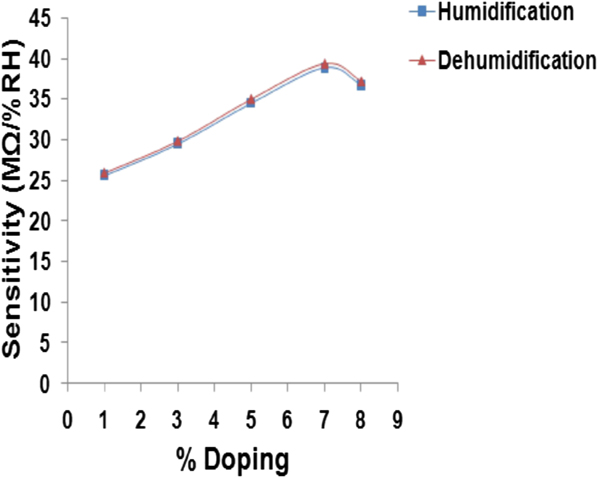
Sensitivity of Cu-doped ZnO thin films for all sensing elements for sintering temperatures 300–600 °C are shown in Table II. Sensitivity of undoped ZnO thin films for sintering temperatures 300–600 °C are shown in Table III. The sensing element developed from undoped ZnO thin film and annealed at 600 °C showed good results with an average sensivity of 20.63 MΩ/%RH. So, an increase in the value of sensitivity for Cu-doped ZnO thin films sensing element was noticed over that of undoped ZnO. For sensing element of Cu-doped ZnO thin films annealed at 600 °C, the sensitivity is found to be repeatable within ±2.00% in dehumidification cycle of RH and within ±1.5% over humidification cycle of RH after six months. Figure 8 shows sensitivity versus temperature graphs for the CZ-7 thin films annealed at different temperatures for humidification processes. Figure 9 shows sensitivity versus temperature graphs for undoped ZnO thin films annealed at different temperatures for humidification processes. From Figures 8 and 9 it is clear that the sensitivity increases with the increasing annealing temperature. Higher porosity increases surface to volume ratio of the materials and therefore, helps in getting good sensitivity. An analysis of the crystallite size and grain size would suggest that smaller crystallites are getting agglomerated to form larger grains. In this process, more of the surface areas of the sensing elements are exposed leading to more adsorption of water molecules. This increases the sensitivity of the sensing elements. With the increase in the Cu-doping percentage the grain size increases and these grains are randomly distributed all over the surface due to which the probability of the formation of pores increases which leads to the increase in the sensitivity. Figure 10 shows variation of sensitivity with %doping for the Cu-doped ZnO sensing elements annealed at 600 °C for humidification processes. It is clear from Fig. 10 that for the sensing elements CZ-1, CZ-3, CZ-5, and CZ-7 annealed at 600 °C sensitivity increases with the increase in the doping percentage.
Sensitivity of samples (MΩ/%RH).

a: Increasing cycle of relative humidity, b: Decreasing cycle of relative humidity, c: Increasing cycle after six months.
Sensitivity of samples of undoped ZnO.

a: Increasing cycle of relative humidity, b: Decreasing cycle of relative humidity, c: Increasing cycle after six months.
Variation of sensitivity with temperature for the sensing elements CZ-7 annealed at different temperatures for humidification process.
Variation of sensitivity with temperature for the sensing elements CZ-0 annealed at different temperatures for humidification process.
Variation of sensitivity with %doping for the Cu-doped ZnO sensing elements annealed at 600 °C for humidification process.

C. Hysteresis
Hysteresis phenomenon in metal oxide materials is mainly due to chemisorption and physisorption processes. The hysteresis is attributed to the initial chemisorptions on the surface of the sensing elements. This chemisorbed layer is not easily affected by exposure to atmosphere. This layer can be desorbed using thermal means only. On the other side, the physisorbed layer can be easily desorbed. Hence, in the decreasing cycle of %RH, the initially adsorbed water is not removed completely leading to hysteresis. Metal oxides and binary systems of metal oxides show deviation in their behavior in the decreasing cycle of %RH from those in increasing cycle of %RH. Minimization of this hysteresis behavior is an important condition for sensor application. To determine the hysteresis effect in the sensing elements, the humidity in the chamber has been increased from 15 to 95% RH and then cycled down to 15% RH and the values of resistance of the sensing elements recorded with change in %RH. All sensing elements manifest acceptable hysteresis values. Hysteresis was found to decrease with increase in the annealing temperature for sensing elements of CZ-7 thin films; values of hysteresis being 2.64%, 2.16%, 1.41%, and 1.02% for annealing temperatures 300 °C, 400 °C, 500 °C, and 600 °C, respectively. For sensing element CZ-0, hysteresis values are 3.64%, 3.12%, 2.64%, and 1.38% for annealing temperatures 300 °C, 400 °C, 500 °C, and 600 °C, respectively. So, a decrease in the value of hysteresis was observed in the case of Cu-doped ZnO sensing element annealed at 600 °C over that of undoped ZnO. As a matter of fact, the energy required for the removal of the physisorbed layer is very less in comparison to the energy required for the removal of chemisorbed layer. With the increase in the annealing temperature the porosity of the thin films increases due to which the probability of physisorption process increases as compared to the chemisorption process. That is why hysteresis decreases with the increased annealing temperature. Sensing element annealed at 600 °C shows lowest hysteresis value within acceptable limits. The nanocomposites formed provide enhanced adsorption capability, good sensitivity values, and low hysteresis.
D. Ageing effect
Ageing is an important problem in sensing devices based on metal oxides. After the study of humidity sensing properties, sensing elements were kept in laboratory environment and the characteristics of humidity sensing were regularly monitored. For analysing the effect of ageing, sensing properties of these elements were examined again in the humidity control chamber after six months and variation of resistance with %RH recorded. Variation of resistance of all the sensing elements with change in %RH after six months was analyzed. For all the sensing elements annealed at 600 °C, values were generally repeatable within ±2.00% in the 15–95% RH range after six months. All the sensing elements showed significantly less ageing effect in their performance for all the annealing temperatures considered. In humidity sensors ageing mechanisms may be due either to prolonged exposure of surface to high humidity, adsorption of contaminants, loss of surface cations due to vaporization, solubility and diffusion, or annealing to a less reactive structure, and migration of cations away from the surface due to thermal diffusion. The sensing elements of both undoped ZnO and Cu-doped ZnO thin films showed significantly less ageing effects in their performance for all the annealing temperatures considered. Generally, the more sensitive a material is to humidity, the more it tends to be susceptible to ageing. Laboratory environment indicates keeping in normal conditions of atmosphere albeit free from dust or other contaminations. These sensors give good performance up to 8–10 months but best up to 6 months that we have reported. After 10 months the sensor parameters have poor values.
E. Response and recovery time
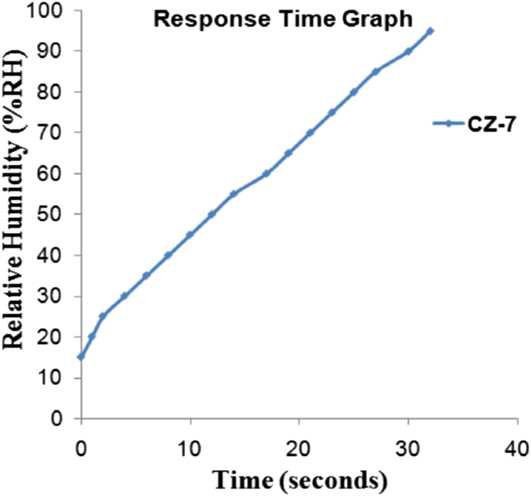
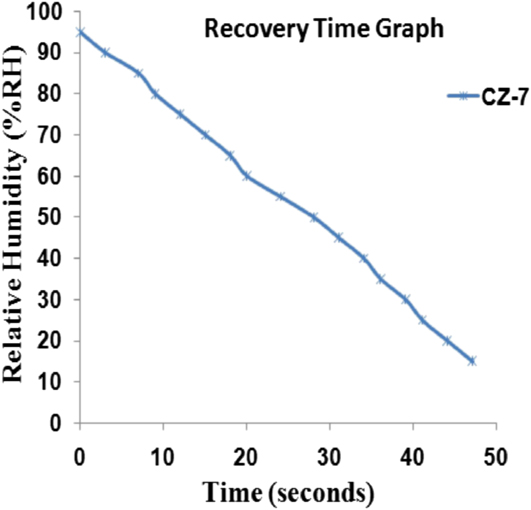
Response/recovery time can be defined as the time taken to achieve 90% of the initial total resistance variation during the humidification and desiccation processes. It has been observed that as the annealing temperature increases the value of response/recovery time decreases i.e., the response and recovery are getting faster with increase in annealing temperature. Response/recovery time for the sensing element CZ-0 (undoped ZnO) for the annealing temperatures 300 °C, 400 °C, 500 °C, and 600 °C are 112/180, 95/147, 79/116, and 67/94 s respectively. Response/recovery time for the sensing element CZ-7 for the annealing temperatures 300 °C, 400 °C, 500 °C, and 600 °C are 73/92, 59/78, 45/62, and 32/47 s respectively. Thus, Cu-doped ZnO thin films gave better response and recovery time compared to the sensing element of undoped ZnO. The desorption of the water molecules is a slow process; therefore, the recovery time is always greater than the response time. Figures 11 and 12 show graphs for response time and recovery time, respectively.
Time response graph for response time.

Time response graph for recovery time.

IX. CONCLUSIONS
Cu-doped ZnO thin films annealed at 600 °C proves to be the best sensing element with sensitivity of 39.14 MΩ/%RH in the 15–95% RH range. It became clear that as the RH increases, resistance of the sensing elements decreases and vice versa. Low value of activation energy indicated that this sensing element had low operating temperature and could be used at room temperature. Sensing element formed from Cu-doped ZnO thin films has properties like lower hysteresis, less effect of ageing, and higher reproducibility. The response and recovery time of the CZ-7 sensing element annealed at 600 °C are 32 and 47 s, respectively. The response and recovery time of the CZ-0 sensing element annealed at 600 °C are 67 and 94 s respectively. From XRD analysis, crystallite size for the sensing elements of undoped ZnO and Cu-doped ZnO were in 24–38 nm and 25–41 nm respectively. The average grain size for the sensing elements CZ-7 and CZ-0 (undoped ZnO) calculated from SEM micrographs are 36 and 42 nm respectively. Reproducibility was within ±2% of the measured values. Cu-doped ZnO nanomaterial has enhanced adsorption and desorption rates which is responsible for better sensitivity, low hysteresis, and better response and recovery time compared to undoped ZnO. The values obtained for sensitivity, hysteresis, and ageing were measured with error within ±2.00%.
ACKNOWLEDGMENTS
Authors would like to thank the University Grants Commission, India for providing the Financial Support for carrying out the research work through Major Research Project Grant [File No. 42-788-2013 (SR)]. Mr. Suneet Kumar Misra would also like to thank the University Grants Commission, India for providing UGC-BSR (Basic Scientific Research) fellowship for carrying out the research work.