





Significant outcomes
-
• Higher BMI was associated with worse executive functioning and episodic memory after controlling for IQ, sex, race, and age
-
• Higher BMI was indirectly associated with worse executive function and episodic memory performance via higher sugar intake
-
• Inflammation was significantly related to performance on reaction time-based tasks and caloric intake from fat
Limitations
-
• The cross-sectional nature of our study design limits the ability to assess causality and mediation
-
• Our sample was comprised of majority female, Caucasian college students and majority male, African American local residents, resulting in a clustering of SES, sex, and race
-
• Dietary intake was assessed via self-report, which can be affected by poor recall and social desirability bias
Introduction
There is a striking difference in performance on tests of cognitive functioning and educational attainment based on socio-economic status (SES). In fact, intelligence, as assessed using standardized assessments of intelligence quotient is 20–30 points (1.3–2 standard deviations) lower in individuals from low as compared to high socioeconomic backgrounds (Wechsler, Reference Wechsler2014; Kaufman et al., Reference Kaufman, Salthouse, Scheiber and Chen2016). Disparities in performance particularly are evident on tests of executive functioning, memory, and language (Duncan and Magnuson, Reference Duncan and Magnuson2012; Hackman et al., Reference Hackman, Gallop, Evans and Farah2015). Given that neuropsychological differences in cognitive ability and academic attainment translate into the persistence of intergenerational poverty through lowered earnings (Restuccia and Urrutia, Reference Restuccia and Urrutia2004; Duncan et al., Reference Duncan, Magnuson, Kalil and Ziol-Guest2012), understanding the mechanisms linking low SES and neuropsychological functioning is critical.
The prevalence of morbid obesity (body mass index [BMI] > 40) is twice as high among low-income adults compared with high-income adults in the United States (Booth et al., Reference Booth, Charlton and Gulliford2017). This disparity also is apparent during adolescence (O’Dea and Wilson, Reference O’Dea and Wilson2006; Hanson and Chen, Reference Hanson and Chen2007), with one study of 4,473 adolescents in the U.S. reporting that 18% of participants from a low SES background were overweight compared to 6% of participants from a high SES background (Morgenstern et al., Reference Morgenstern, Sargent and Hanewinkel2009). These patterns are alarming considering that there is evidence linking elevated BMI and poorer performance on multiple measures of cognitive functioning (Prickett et al., Reference Prickett, Brennan and Stolwyk2015). Specifically, inverse relationships have been reported between BMI and memory as well as subdomains within the umbrella construct of executive function (e.g., impulsivity, set-shifting) (Prickett et al., Reference Prickett, Brennan and Stolwyk2015; Cook et al., Reference Cook, O’Dwyer, Donges, Parker, Cheng, Steinbeck, Cox, Franklin, Garg, Rooney and O’Connor2017; Loprinzi and Frith, Reference Loprinzi and Frith2018). In a large, nationally representative sample of children and adolescents aged 8–16, BMI was significantly associated with worse performance on measures of nonverbal reasoning, visuospatial construction, and working memory (Li et al., Reference Li, Dai, Jackson and Zhang2008). High BMI during adolescence also has been shown to predict worse cognitive performance in midlife. Notably, however, this finding only was observed among those who reported low childhood SES (Cohen-Manheim et al., Reference Cohen-Manheim, Doniger, Sinnreich, Simon, Murad, Pinchas-Mizrachi and Kark2016).
Despite growing evidence of a relationship between BMI and cognition, the precise mechanisms underlying this link remain unknown. Moreover, BMI might be better viewed as a proxy for other, perhaps more proximal risk factors. For example, although higher BMI is associated with lower SES and worse cognition, it also is consistently associated with higher levels of inflammation (O’Connor et al., Reference O’Connor, Bower, Cho, Creswell, Dimitrov, Hamby, Hoyt, Martin, Robles, Sloan, Thomas and Irwin2009). Our group identified inflammation as a mechanism linking higher BMI with worse executive functioning in a diverse sample of adolescents (Mac Giollabhui et al., Reference Mac Giollabhui, Swistun, Murray, Moriarity, Kautz, Ellman, Olino, Coe, Abramson and Alloy2020b), and inflammation has been found to modulate the relationship between BMI and worse memory performance (Cook et al., Reference Cook, O’Dwyer, Donges, Parker, Cheng, Steinbeck, Cox, Franklin, Garg, Rooney and O’Connor2017). Studies have shown that chronic inflammation disrupts neuronal processes (e.g., long-term potentiation, synaptic plasticity, and neurogenesis) and affects brain regions and their respective cognitive correlates (e.g., hippocampus: episodic memory; anterior cingulate cortex: executive function) (McAfoose and Baune, Reference Mcafoose and Baune2009). Moreover, inflammation is associated with impaired cognition, both concurrently and prospectively, in medical (Crisan et al., Reference Crisan, Oancea, Timar, Fira-Mladinescu, Crisan and Tudorache2014; Li et al., Reference Li, Robertson, Yu, Cheypesh, Dinu and Li2014; Huang et al., Reference Huang, Guilleminault, Hwang, Cheng, Lin, Li and Lee2016), healthy elderly (Baune et al., Reference Baune, Ponath, Golledge and Varga2008; Noble et al., Reference Noble, Manly, Schupf, Tang, Mayeux and Luchsinger2010; Jenny et al., Reference Jenny, French, Arnold, Strotmeyer, Cushman, Chaves, Ding, Fried, Kritchevsky, Rifkin, Sarnak and Newman2012; Casaletto et al., Reference Casaletto, Staffaroni, Elahi, Fox, Crittenden, You, Neuhaus, Glymour, Bettcher and Yaffe2018), and adult samples (Reichenberg et al., Reference Reichenberg, Yirmiya, Schuld, Kraus, Haack, Morag and Pollmacher2001; Singh-Manoux et al., Reference Singh-Manoux, Dugravot, Brunner, Kumari, Shipley, Elbaz and Kivimaki2014; Paine et al., Reference Paine, Bosch, Ring, Drayson and Veldhuijzen Van Zanten2015). Notably, low SES consistently is associated with elevated inflammatory biomarkers (e.g., C-reactive protein [CRP] and interleukin [IL]-6) across the lifespan, specifically in more developed countries (Muscatell et al., Reference Muscatell, Brosso and Humphreys2018). Further, low SES early in life, as indexed by low parental education and assets, is associated with elevated CRP in adulthood (Matthews et al., Reference Matthews, Chang, Bromberger, Karvonen-Gutierrez, Kravitz, Thurston and Montez2016) and there is substantial evidence that this relationship is mediated by increased BMI (Liu et al., Reference Liu, Aiello, Mensah, Gasser, Rueb, Cordell, Juonala, Wake and Burgner2017). Thus, BMI may be related to cognitive functioning via its effects on inflammation, and these effects may be more pronounced among low SES individuals.
Diet is a second candidate mechanism that may explain why increased BMI is associated with worse cognition. The link between low SES and poor diet quality has been well established (Darmon and Drewnowski, Reference Darmon and Drewnowski2008). Multiple factors are thought to contribute to this relationship, including increased convenience and lower cost of foods and beverages that are energy-dense but nutrient-poor, limited access to healthy food options, and lower nutrition literacy (Darmon and Drewnowski, Reference Darmon and Drewnowski2008). Accumulating evidence suggests that poor quality diet (e.g., diets high in fats and sugars) is associated with worse performance on cognitive tasks across age groups (Molteni et al., Reference Molteni, Barnard, Ying, Roberts and Gomez-Pinilla2002; Junger and van Kampen, Reference Junger and Van Kampen2010; Francis and Stevenson, Reference Francis and Stevenson2011; Baym et al., Reference Baym, Khan, Monti, Raine, Drollette, Moore, Scudder, Kramer, Hillman and Cohen2014; Nyaradi et al., Reference Nyaradi, Foster, Hickling, Li, Ambrosini, Jacques and Oddy2014; Beydoun et al., Reference Beydoun, Gamaldo, Beydoun, Tanaka, Tucker, Talegawkar, Ferrucci and Zonderman2014). Importantly, animal studies suggest that the deleterious effects of these diets on cognition are more pronounced when diet exposure occurs during adolescence (Boitard et al., Reference Boitard, Etchamendy, Sauvant, Aubert, Tronel, Marighetto, Laye and Ferreira2012; Hsu et al., Reference Hsu, Konanur, Taing, Usui, Kayser, Goran and Kanoski2015), consistent with the notion that the developing brain may be especially sensitive to environmental insults. Given that dessert, pizza, and soda are the three primary sources of daily caloric intake among children and adolescents in the United States (Reedy and Krebs-Smith, Reference Reedy and Krebs-Smith2010), understanding the potential effect of diet on cognitive functioning is vital. Examination of diet, SES, inflammation, and neuropsychological functioning in young adulthood is particularly important, as the transition to adulthood is marked by increased dietary autonomy and is a critical period for occupational and academic success. If these constructs are indeed associated in young adulthood, their pathways may prove modifiable, allowing for interventions to be developed and delivered to prevent or mitigate negative outcomes.
It is surprising that no study, to date, has integrated the separate lines of research examining how diet, BMI, and inflammation are associated with cognitive functioning, given how closely related these factors are. For example, studies have shown that the association between SES and inflammation is attenuated greatly once BMI is accounted for (Owen et al., Reference Owen, Poulton, Hay, Mohamed-Ali and Steptoe2003; Panagiotakos et al., Reference Panagiotakos, Pitsavos, Chrysohoou, Skoumas, Toutouza, Belegrinos, Toutouzas and Stefanadis2004; Loucks et al., Reference Loucks, Sullivan, Hayes, DAgostino Sr., Larson, Vasan, Benjamin and Berkman2006; Koster et al., Reference Koster, Bosma, Penninx, Newman, Harris, Van Eijk, Kempen, Simonsick, Johnson and Rooks2006; Cozier et al., Reference Cozier, Albert, Castro-Webb, Coogan, Ridker, Kaufman, Palmer and Rosenberg2016). Further, poor diet quality has been associated with increased body mass and elevated inflammation (Mozaffarian et al., Reference Mozaffarian, Pischon, Hankinson, Rifai, Joshipura, Willett and Rimm2004; Field et al., Reference Field, Willett, Lissner and Colditz2007; Malik et al., Reference Malik, Willett and Hu2009; Mozaffarian et al., Reference Mozaffarian, Hao, Rimm, Willett and Hu2011; Calder et al., Reference Calder, Ahluwalia, Brouns, Buetler, Clement, Cunningham, Esposito, Jonsson, Kolb, Lansink, Marcos, Margioris, Matusheski, Nordmann, Obrien, Pugliese, Rizkalla, Schalkwijk, Tuomilehto, Warnberg, Watzl and Winklhofer-Roob2011; Aeberli et al., Reference Aeberli, Gerber, Hochuli, Kohler, Haile, Gouni-Berthold, Berthold, Spinas and Berneis2011; Beilharz et al., Reference Beilharz, Maniam and Morris2015) in addition to low SES and cognitive dysfunction. In fact, a dietary inflammatory index (DII) was developed to assess the inflammatory potential of diet patterns (Shivappa et al., Reference Shivappa, Steck, Hurley, Hussey and Hebert2014), and findings show positive associations between high DII scores (high in fats and sugars) and inflammation in adolescents (Shivappa et al., Reference Shivappa, Hebert, Marcos, Diaz, Gomez, Nova, Michels, Arouca, Gonzalez-Gil, Frederic, Gonzalez-Gross, Castillo, Manios, Kersting, Gunter, De Henauw, Antonios, Widhalm, Molnar, Moreno and Huybrechts2017).
In the present cross-sectional study, we investigated whether associations between SES and worse episodic memory and executive functioning are statistically mediated by increased BMI. Additionally, we tested diet and inflammation as potential statistical mediators in the relationship between BMI and worse episodic memory and executive functioning, as these are potentially modifiable risk factors that could be addressed at both an individual-and public policy-level.
Methods
Participants
Participants were recruited from the Philadelphia area utilizing multiple sources: Temple University Department of Psychology and Neuroscience’s SONA System, past and ongoing studies within Temple University Department of Psychology and Neuroscience, online sources (i.e., online bulletin boards, social media platforms), and Philadelphia community locations (not-for-profits, churches, medical centers, supermarkets). It should be noted that while this recruitment approach allowed for a wide range of diverse identities to be included, recruitment from both college and community samples also can lead to systematic clustering of key variables (e.g., race, sex, and SES). Prior to enrollment, participants completed an eligibility questionnaire. Inclusion criteria required the participants to be between the ages of 18 and 25 at the time of their study participation, to be absent of any medical diagnoses that would influence immune function (e.g., diabetes, autoimmune disorder, sickle cell disease, blood clotting disorders), not to be currently using anti-inflammatory medication, and to be willing to have their blood drawn. Of the 109 young adults enrolled, valid blood samples were drawn from 100 participants (for one participant a phlebotomist was not available (to measure height/weight or draw blood) and on 8 occasions, a vein could not be accessed).
Procedures
Participants completed one 2–2.5-hour laboratory visit at Temple University during which they reviewed and signed the consent form, completed questionnaires, neuropsychological testing, and a blood draw. Participants were asked to refrain from eating overnight to provide a fasting sample. A break was given post blood draw, and snacks offered, before the start of questionnaires and neuropsychological testing. All subjects received equivalent financial compensation for their participation in the study. The authors assert that all procedures contributing to this work comply with the ethical standards of the relevant national and institutional committees on human experimentation and with the Helsinki Declaration of 1975, as revised in 2008.
Measures
Socio-economic status (SES)
SES was estimated as the composite of three z-standardized variables: education level of the primary caregiver (9 years or less, some high school, high school graduate/General Equivalency Diploma, some college, college graduate or more), education level of the secondary caregiver, and the median income of the zip code where participants spent the majority of their childhood. Recent research suggests that composite measures incorporating multiple dimensions of socioeconomic status at both the family and community level may be advantageous (for discussion see (Braveman et al., Reference Braveman, Cubbin, Egerter, Chideya, Marchi, Metzler and Posner2005; Braveman et al., Reference Braveman, Cubbin, Egerter, Williams and Pamuk2010)). All participants identified the education level of their primary caregiver, 87 identified the education level of a secondary caregiver, and 106 were able to provide the zip code where they spent the majority of their childhood. All variables were z-transformed and a composite was calculated as the average value of available responses across the three variables. For three individuals enrolled who did not spend their childhood in the United States, a composite of available education variables was used instead.
Body Mass Index (BMI)
Body mass index was calculated from height and weight measurements collected using a stadiometer.
Inflammation
Blood samples (n = 100) were obtained via antecubital venipuncture by a certified phlebotomist in adherence with Bio-Safety Level 2 standards with universal precautions. Blood was collected in 10 mL vacutainers (BD Hemogard with K2 EDTA), centrifuged, and immediately stored at −80°C until the samples were sent for assay. Inflammatory cytokines were quantified by multi-cytokine array (Interleukin-6 (IL-6), Tumor Necrosis Factor-α, IL-1β, interferon-ɣ) using the Meso Scale Discovery Multi-Spot Assay System Proinflammatory Panel 1. Samples were assayed in duplicate and samples with coefficients of variation >25% were re-assayed on a final plate. Values (i) above and (ii) below the upper and lower limits of quantification were adjusted to, respectively, (i) the upper limit of quantification and (ii) half the lower limit of quantification value. The lower limits of quantification for this kit were: 0.633 pg/mL (IL-6), 0.690 pg/mL (Tumor Necrosis Factor-α), 0.646 pg/mL (IL-1β), and 0.633 pg/mL (interferon-ɣ). The upper limit of quantification for this kit were: 488 pg/mL (IL-6), 248 pg/mL (Tumor Necrosis Factor-α), 375 pg/mL (IL-1β), and 938 pg/mL (interferon-ɣ). Final values of IL-6 and interferon-γ were log-transformed and subsequently all cytokine variables were z-transformed; finally, a composite measure was calculated representing the mean of three z-transformed cytokine variables. Coefficients of variation (CV) were as follows: IL-1β (CV = 14.46%), IL-6 (CV = 13.39%), IFN-γ (CV = 9.20%), TNF-α (CV = 8.96%). All assays were conducted over 2 days. Batch effects and plate differences were not examined.
Diet quality
Diet quality was assessed using the National Cancer Institute’s Diet History Questionnaire – Third Edition (DHQ-III). Participants retrospectively reported on their diet over the prior month. This measure shows moderate to good reliability (mean intra-class correlation coefficient (ICC) of 0.74) (Julián-Serrano et al., Reference Julián-Serrano, Koenig, Wang, Wesselink, Hatch, Wise and Tucker2024). Total daily intake from fat and sugar (in grams) were summed for each participant. In the case of total sugar, two values that were greater than 3 standard deviations above the mean (i.e., >461.3) were winsorized so that they were equal to a value 3 standard deviations above the mean.
Neuropsychological assessment
A neuropsychology battery was used to assess general intellectual functioning, verbal and visual memory, psychomotor speed, attention, and executive functioning. General intellectual functioning was assessed to identify whether differences in memory or executive functioning are specific to these domains, or whether they represent a generalized pattern of cognitive dysfunction.
General Intellectual Functioning: The Kaufman Brief Intelligence Test, Second Edition (KBIT-2) is a brief assessment of verbal and non-verbal intelligence for those aged 4–90 years (Kaufman, Reference Kaufman1990). The KBIT-2 estimates verbal, non-verbal, and general intelligence (IQ). The measure is internally consistent, possesses test–retest reliability, and has demonstrated convergent validity with lengthier measures of intelligence.
Verbal and Visual Memory: The Hopkins Verbal Learning Test-Revised (HVLT-R) is a brief verbal learning and semantic memory test for individuals aged 16 years and older (Benedict et al., Reference Benedict, Schretlen, Groninger and Brandt1998). The HVLT-R includes three learning trials, a delayed recall trial, and a recognition trial. This measure has demonstrated construct, concurrent, and discriminant validity in neurotypical samples aged 16 years and older. Visual episodic memory was assessed using the Brief Visuospatial Memory Test–Revised (BVMT-R), a valid and reliable measure of immediate and delayed visuospatial episodic memory (Benedict et al., Reference Benedict, Schretlen, Groninger, Dobraski and Shpritz1996). Episodic memory also was assessed using the valid and reliable Picture Sequence Memory Test from the NIH Cognitive Toolbox (NIHCT) (Akshoomoff et al., Reference Akshoomoff, Newman, Thompson, Mccabe, Bloss, Chang, Amaral, Casey, Ernst and Frazier2014). A composite measure of episodic memory was created based on the average of z-transformed (i) total number of correct responses for the HVLT-R, (ii) total number of correct responses for the BVMT-R, and (iii) uncorrected standardized score on the NIH Cognitive Toolbox Picture Sequence Memory Test. Our measure of verbal episodic memory (HVLT) was associated with visual episodic memory (BVMT-R) (r = 0.40, p < 0.001) and episodic memory (NIHCT) (r = 0.27, p = 0.005), and visual episodic memory was associated with episodic memory (NIHCT) (r = 0.41, p < 0.001).
Executive Functioning: Consensus is lacking on a specific model of executive functioning (Miyake and Friedman, Reference Miyake and Friedman2012; Diamond, Reference Diamond2013). This study relied upon a popular model of executive functioning that identifies inhibition, working memory, and set-shifting as three central components of executive functioning. The NIHCT Flanker Inhibitory Control and Attention Test (Flanker) requires participants to focus on a specific stimulus while inhibiting attention to the stimuli flanking it; reaction time is indicative of task performance. The NIHCT List Sorting Working Memory Test (LSWM) is a valid, reliable assessment of verbal working memory. Participants are asked to remember a series of objects (foods/animals) and to repeat them in order of smallest to largest (One-List condition). A Two-List condition also is presented where participants are instructed to remember a series of objects (foods and animals) before reporting the foods in size order, followed by the animals in size order. Performance is based on the total number of correct items from both conditions. The NIHCT Dimensional Change Card Sort (DCST) assesses cognitive flexibility. Participants are presented with target pictures to be matched with test pictures that vary along two dimensions (i.e., shape/color) – the dimensions by which participants must switch. Scoring is based on both accuracy and reaction time. A composite measure of executive function was used in this study that comprised of the means of uncorrected standardized scores for the Flanker, List Sorting Working Memory Test, and the Dimensional Change Card Sort tests. All scores from executive functioning tests on the NIHCT are standardized on comparable scales. Our measure of inhibition was associated with working memory (r = 0.31, p = 0.001) and set-shifting (r = 0.70, p < 0.001), and working memory was associated with set-shifting (r = 0.31, p = 0.01).
Reaction-time based tasks: A composite variable was created to assess a range of cognitive tasks indexing processing and psychomotor speed, including the Flanker, Dimensional Change Card Sort, and the Pattern Comparison Processing Speed (PCPS) tests. During the PCPS task, participants are asked to identify whether two pictures are the same by selecting ‘yes’ or ‘no’. Performance is determined by number of correct items completed in 90 s. All tests included in the composite are valid and reliable measures of reaction-timed performance, with PCPS demonstrating strong convergent validity with gold-standard neuropsychological measures of processing speed (Carlozzi et al., Reference Carlozzi, Tulsky, Chiaravalloti, Beaumont, Weintraub, Conway and Gershon2014). Reaction time was investigated as it has been shown to be specifically associated with inflammation (Goldsmith et al., Reference Goldsmith, Haroon, Woolwine, Jung, Wommack, Harvey, Treadway, Felger and Miller2016).
Demographic information
Participant sex, race, and age were assessed via self-report.
Data analysis
An analytic plan was pre-registered with the Open Science Framework (DOI: 10.17605/OSF.IO/M6S8J) after data collection was complete and before data analysis was conducted. One deviation in the pre-registered approach was that the cytokine interferon-γ was not included in the composite measure of inflammation. Interferon-γ is a cytokine that plays a critical role in mediating anti-viral responses and there are data to suggest that chronic inflammation (frequently indexed by higher circulating CRP levels) is accompanied by lower interferon-γ across experimental studies as well as a range of neurological (Qu et al., Reference Qu, Li, Qin, Wang, Zhao, An, Mao, Min, Xiong, Li and Xue2023), psychiatric (Kohler et al., Reference Kohler, Freitas, Maes, De Andrade, Liu, Fernandes, Stubbs, Solmi, Veronese, Herrmann, Raison, Miller, Lanctot and Carvalho2017), and infectious conditions (Hu et al., Reference Hu, Xu, Yin, Li, Hou, Zhang, Zhou, Yu, Li and Feng2020). Readers may observe associations amongst all inflammatory biomarkers in Supplementary Table 1, which reports associations of two inflammatory cytokine composite variables (based on inclusion of three-and four-biomarkers, respectively) and all other variables of interest. Exploratory analyses tested two additional hypotheses: (i) does IL-6 act as a statistical mediator linking BMI and cognition and (ii) does the inflammatory composite act as a statistical mediator linking BMI and a composite variable made up of reaction time-based tasks. IL-6 was selected for exploratory analyses as it is a cytokine causally linked with elevated BMI: not only is IL-6 routinely and substantially associated with higher BMI (r ≈ 0.35) (Park et al., Reference Park, Park and Yu2005), but increased levels of IL-6 secreting macrophages have been shown to play a mechanistic role in linking higher BMI with higher circulating levels of IL-6 via macrophages resident in adipose tissue (Lu et al., Reference Lu, Zhao, Meng and Zhang2019). A reaction-time based composite was created for exploratory analyses given an emerging and growing body of evidence to suggest that white-matter integrity – a critical contributor to information processing speed and therefore response times – may be associated with dysregulated peripheral inflammatory physiology (Qiao et al., Reference Qiao, Li, Guo, Cai and Zhang2022; Geraghty et al., Reference Geraghty, Acosta-Alvarez, Rotiroti, Dutton, O’Dea, Kim, Trivedi, Mancusi, Shamardani and Malacon2025).
All analyses were conducted using R 4.2 (Team, Reference Team2022). Data transformations are described in the ‘Measures’ section and results were considered significant when p < 0.05 using two tailed tests. Key statistical assumptions (e.g., assessed multicollinearity, normal distribution of residuals) were assessed and largely met; BMI exhibited properties that likely contributed to the observation of non-normal multivariate distributions and bootstrapped standard errors were consequently used. First, Pearson’s correlations among variables of interest were calculated. Next, we estimated multivariate and indirect associations through ‘lavaan’ (Rosseel, Reference Rosseel2012) using bootstrapped standard errors across 5,000 bootstrapped replications. Specifically, multivariate linear regression tested whether low socioeconomic status (composite previously defined) predicted worse executive functioning (composite measure previously defined) and/or memory (composite measure previously defined) with an indirect effect of a higher BMI, both controlling and not controlling for relevant covariates and global cognitive ability (estimate of IQ measured using the K-BIT). Subsequently we examined whether associations between BMI and worse executive functioning (composite measure previously defined) and/or memory (composite measure previously defined) were statistically mediated by inflammation or diet. Sensitivity analyses are described in the results section.
Results
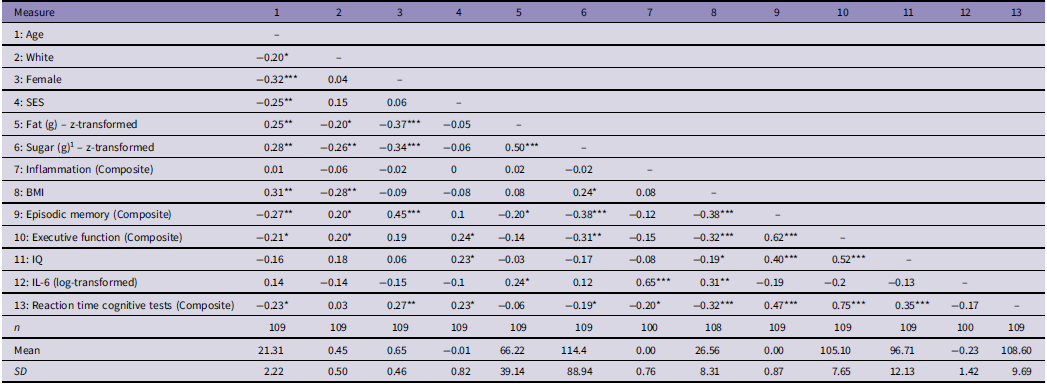
The associations between sociodemographic and important clinical measures are presented in Table 1. Further information on how the sample was comprised, in terms of sex, race, and primary caregiver education, is presented in Supplementary Table 2. Older participants were less likely to identify as White, were less likely to be female, and were more likely to be from low SES backgrounds, exhibit higher BMI, and to exhibit worse executive functioning and worse episodic memory performance. Higher SES was correlated with better executive function and a higher IQ. Higher intake from fat was associated with higher sugar intake and worse episodic memory. Higher intake from sugar was linked with higher BMI, worse executive functioning and worse episodic memory performance. Higher BMI was correlated with worse executive functioning and episodic memory performance as well as a lower IQ.
Descriptive statistics and bivariate correlations

Table 1. Long description
The table presents correlations between various sociodemographic and clinical measures. It has 13 rows and 13 columns, including headers. The rows are labeled with measures such as Age, White, Female, SES, Fat (g) z-transformed, Sugar (g) z-transformed, Inflammation (Composite), BMI, Episodic memory (Composite), Executive function (Composite), IQ, IL-6 (log-transformed), and Reaction time cognitive tests (Composite). The columns are numbered from 1 to 13. Each cell contains a correlation value. Notable trends include negative correlations between Age and measures like White and Female, and positive correlations between BMI and measures like Sugar intake and Inflammation. Higher SES is correlated with better executive function and higher IQ. The table also includes the number of participants (n), mean values, and standard deviations (SD) for each measure.
SES, socio-economic status; g, grams; BMI, Body Mass Index; Hx. = History; Sxs. = Symptoms; IQ, intelligence quotient; Composite variables creation are described in the methods; SD, standard deviation;* = p < 0.05; ** = p < 0.01; *** = p < 0.001.
1 This variable has been winsorized as described in the methods.
Indirect associations between socioeconomic status and cognition (executive function and episodic memory) with body mass index as a statistical mediator
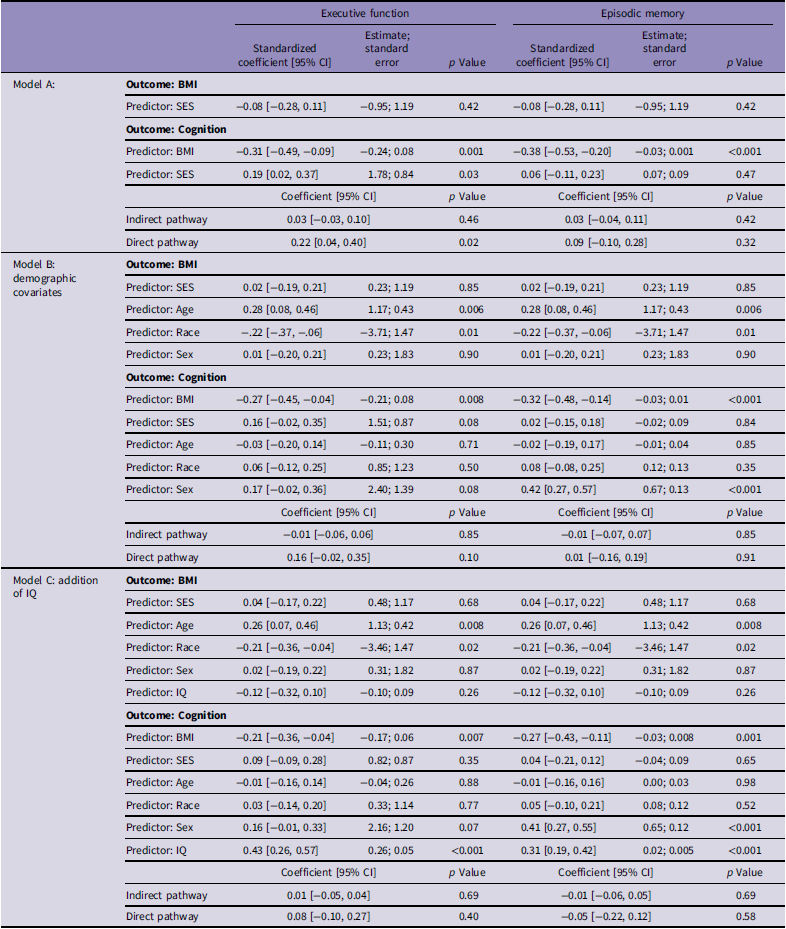
SES was not indirectly associated with worse executive functioning or episodic memory with BMI as a statistical mediator. Higher BMI was consistently correlated with worse executive functioning and worse episodic memory, even when adjusting for demographic variables and IQ. See Table 2 for complete details. Sensitivity analyses replicated these analyses using a more traditional measure of socioeconomic status (i.e., primary caregiver education) (Aarø et al., Reference Aarø, Flisher, Kaaya, Onya, Namisi and Wubs2009) and patterns of statistical significance did not differ for any parameter estimate presented in Table 2, except socioeconomic status was no longer significantly associated with executive functioning (b = 0.56, z = 1.09, p = 0.27) when controlling for BMI.
Indirect associations of socioeconomic status and cognition (executive function and episodic memory) via body mass index (n = 100)

Table 2. Long description
A table with three models (A, B, and C) analyzing the associations of socioeconomic status (SES) and cognition via body mass index (BMI). Model A includes SES and BMI as predictors for executive function and episodic memory. Model B adds demographic covariates (age, race, sex) to the analysis. Model C further adds IQ as a covariate. Each model presents standardized coefficients, estimates, standard errors, and p-values for the predictors. The table shows that higher BMI is consistently correlated with worse executive functioning and episodic memory across all models, even when adjusting for demographic variables and IQ. SES is not indirectly associated with worse executive functioning or episodic memory with BMI as a mediator.
Indirect associations between body mass index and cognition (executive function and episodic memory) with fat and sugar as statistical mediators
BMI was not indirectly associated with worse executive functioning or episodic memory with higher fat intake as a statistical mediator; however, higher BMI was associated with worse executive function and worse episodic memory performance and this relationship was statistically mediated by higher sugar intake, although this indirect association was no longer observed after controlling for covariates. See Table 3 for complete details.
Indirect associations of body mass index and cognition (executive function and episodic memory) via calories derived from fat and calories derived from sugar (n = 100)

Table 3. Long description
The table presents data on the indirect associations of body mass index (BMI) and cognition, specifically executive function and episodic memory, via calories derived from fat and sugar. It includes multiple rows and columns with various predictors and outcomes. The table is divided into sections based on different base models and demographic covariates. Each section lists predictors such as BMI, calories from fat, and calories from sugar, along with their respective coefficients, standard errors, and p-values for both executive function and episodic memory outcomes. The table also includes indirect pathways and direct pathways for each predictor. Notable trends include the association of higher BMI with worse executive function and episodic memory performance, mediated by higher sugar intake. The table provides detailed statistical information for each predictor and outcome, including estimates, standard errors, and p-values.
1 This variable has been winsorized as described in the methods.
a This variable has been z-transformed.
Indirect associations between body mass index and cognition (executive function and episodic memory) with inflammation as a statistical mediator
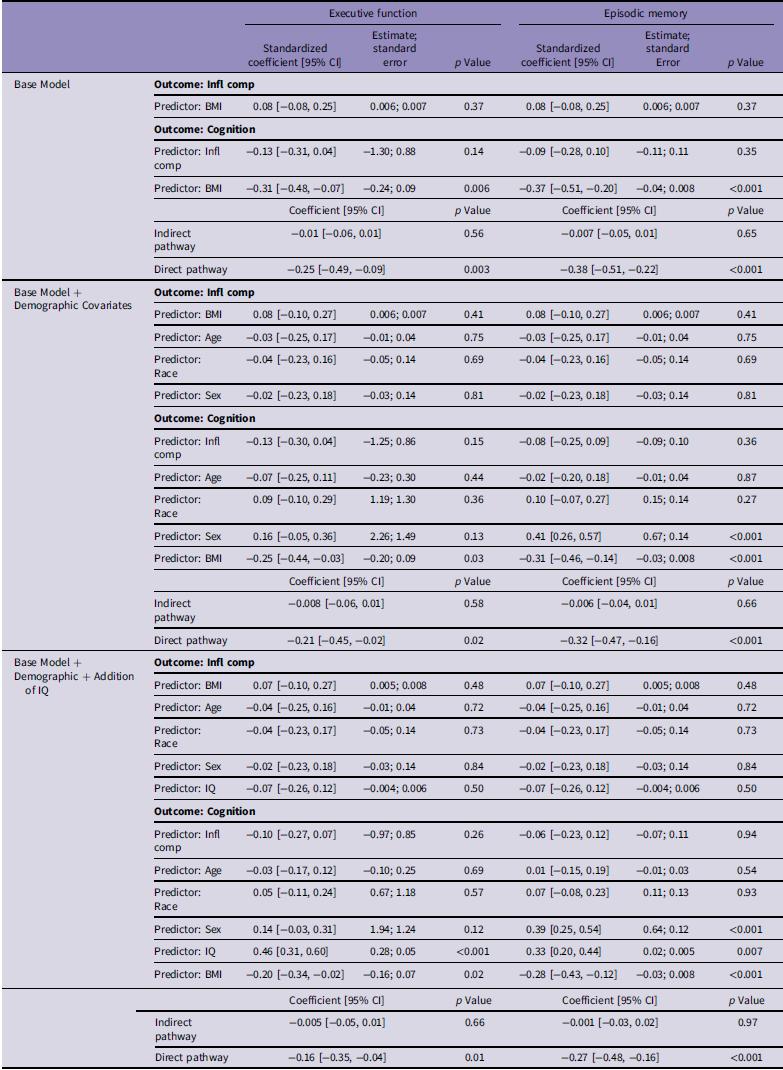
BMI was not indirectly associated with worse executive functioning or episodic memory with higher levels of inflammation as a statistical mediator. Inflammation was not significantly associated with executive function or episodic memory in adjusted or unadjusted models. See Table 4 for complete details.
Indirect associations of Indirect associations of body mass index and cognition (executive function and episodic memory) via inflammation (n = 100)

Table 4. Long description
A table comparing the indirect associations of body mass index (BMI) and cognition via inflammation. The table has 15 rows and 12 columns. Column headers include Outcome, Predictor, Standardized coefficient, Estimate; standard error, p Value, Standardized coefficient, Estimate; standard error, and p Value for both Executive function and Episodic memory. Row labels include predictors such as BMI, Infl comp, Age, Race, Sex, and IQ. The table is divided into sections for Base Model, Base Model + Demographic Covariates, and Base Model + Demographic Covariates + IQ. Each section provides values for indirect and direct pathways. Notable trends include the p values and standardized coefficients for different predictors and outcomes.
Infl composite = Inflammatory Composite.
Exploratory analyses: reaction-time tasks and IL-6
Exploratory analyses replicated the statistical models reported in Tables 2–4 to test two additional hypotheses: (i) does IL-6 act as a statistical mediator linking BMI with cognition and (ii) does the inflammatory composite act as a statistical mediator linking BMI and a composite variable made up of reaction time-based tasks. BMI was not indirectly associated with cognition with log-transformed IL-6 as a statistical mediator, although log-transformed IL-6 was significantly correlated with intake from fat (r = 0.24; p = 0.02), BMI (r = 0.31; p = 0.002), and non-significantly correlated with executive function (r = −0.20; p = 0.051), and episodic memory (r = −0.19; p = 0.062). Similarly, BMI was not indirectly associated with a composite variable made up of reaction time-based tasks with the inflammatory composite statistically mediating; however, the inflammatory composite was significantly correlated with the composite variable made up of reaction time-based tasks (r = −0.20; p = 0.042) – an association that remained statistically significant after covarying for BMI.
Discussion
Given increasing recognition of the complex relationships between SES, BMI, and cognition in youth (Cohen-Manheim et al., Reference Cohen-Manheim, Doniger, Sinnreich, Simon, Murad, Pinchas-Mizrachi and Kark2016; Li et al., Reference Li, Cai, Taylor, Eisenstein, Barch, Marek and Hershey2023), the present study sought to interrogate whether BMI statistically mediates the association between SES and cognition and further, whether inflammation and dietary intake statistically mediate the association between BMI and cognition. The current study failed to find support for the proposed models of BMI statistically mediating a relationship between SES and cognitive function; however, an indirect association between BMI and cognition – both executive functioning and episodic memory – was observed with higher sugar as a statistical mediator. These results contribute to the existing literature both by replicating and extending previous research showing significant associations between SES, BMI, dietary intake and cognition in healthy young adults.
Consistent with the prevailing literature (Lawson et al., Reference Lawson, Hook and Farah2018; Korous et al., Reference Korous, Causadias, Bradley, Luthar and Levy2022; Mac Giollabhui and Hartman, Reference Mac Giollabhui and Hartman2022), the current study observed a significant inverse relationship between SES and executive function (as well as IQ); however, this relationship was no longer significant after controlling for covariates, particularly BMI, though SES was not significantly correlated with BMI in this sample. The lack of association between SES and BMI in our sample may partially stem from the restricted age range of participants, which could have limited variability in both SES and BMI as lifestyle factors (such as diet, physical activity, and sleep patterns) may be more homogenous in young adulthood. Additionally, the use of two distinct recruitment streams may have introduced clustering of SES and BMI variables, further obscuring potential relationships in the sample. That SES has broad impacts on cognition beyond its effect on executive functioning is consistent with previous work showing high SES to be associated with both higher intelligence in infancy and greater gains in intelligence in development (von Stumm and Plomin, Reference Von Stumm and Plomin2015). Contrary to our initial hypothesis, we did not find that BMI statistically mediated the relationship between SES and cognition – findings inconsistent with recent evidence showing BMI to mediate the relationship between neighborhood SES and executive dysfunction in adolescents (Dennis et al., Reference Dennis, Manza and Volkow2022). Therefore, despite an increased prevalence of obesity among individuals of low SES (Wang and Beydoun, Reference Wang and Beydoun2007), BMI may exert an independent influence on cognition. Conflicting evidence may be due to differences in study methodology such as sample size, sample characteristics, and how key variables were operationalized.
As predicted, the current results show a significant inverse relationship between BMI and both executive function and memory, adding to a growing body of literature showing BMI to be a robust predictor of cognitive functioning (Dennis et al., Reference Dennis, Manza and Volkow2022). High BMI may increase oxidative stress and neuroinflammation, which may lead to neuronal degradation (Salas-Venegas et al., Reference Salas-Venegas, Flores-Torres, Rodríguez-Cortés, Rodríguez-Retana, Ramírez-Carreto, Concepción-Carrillo, Pérez-Flores, Alarcón-Aguilar, López-Díazguerrero and Gómez-González2022), or alternatively cognitive dysfunction may contribute to increased BMI by affecting decision-making around food (Gunstad et al., Reference Gunstad, Sanborn and Hawkins2020). Indeed, there may exist a reciprocal relationship between the two whereby lower inhibitory control (Wyckoff et al., Reference Wyckoff, Evans, Manasse, Butryn and Forman2017) may impact what and how much one consumes contributing to increased body weight, and increased body weight leads to further impact on cognition (Hargrave et al., Reference Hargrave, Jones and Davidson2016; Yeomans, Reference Yeomans2017). However, recent longitudinal research in children found that negative urgency and reward seeking predicted fat and sugar intake over time, and in boys specifically, with no relation between scores on neurocognitive tests and future intake (Wang and Beydoun, Reference Wang and Beydoun2007; Adise et al., Reference Adise, Boutelle, Rezvan, Kan, Rhee, Goran and Sowell2024). Much work remains to be done to characterize how cognitive dysfunction and body weight relate to one another.
The current findings also provide important insight into the relationship between dietary intake and cognition among healthy young adults. Specifically, these data suggest that greater intake of sugar is associated with worse executive function and memory, whereas fat intake is associated with poorer episodic memory. These results are consistent with findings from the animal literature (Abbott et al., Reference Abbott, Arnott, Westbrook and Tran2019) as well as a recent meta-analysis showing that chronic added sugar consumption is associated with poorer memory and executive functioning (Gillespie et al., Reference Gillespie, White, Kemps, Moore, Dymond and Bartlett2023). Of note, the present findings may help to clarify recent research (Atak et al., Reference Atak, Boye, Peciña and Liu2023) which finds that greater intake of fat and sugar is associated with both impaired memory and executive function. By isolating these dietary components, we see a pattern whereby sugar may have a broader impact on cognition than fat intake, which may selectively impair hippocampal function. In practice, of course, these dietary components are not isolated and may contribute to a compounded effect. Indeed, combined high fat and sugar diets have been associated with the most pronounced cognitive impairments in animal studies (Abbott et al., Reference Abbott, Arnott, Westbrook and Tran2019). Several mechanisms for diet-related cognitive dysfunction have been proposed including reduced neurogenesis, altered synaptic plasticity, and neuroinflammation (Murray and Chen, Reference Murray and Chen2019). Indeed, we observed a significant positive correlation between IL-6 and fat intake consistent with findings from the animal literature showing elevated brain IL-6 following intake of a high fat diet (Pistell et al., Reference Pistell, Morrison, Gupta, Knight, Keller, Ingram and Bruce-Keller2010). Interestingly, we found that sugar intake statistically mediated the association between BMI and cognition, whereas fat intake did not; however, this relationship was no longer significant after adjusting for covariates and as such should be interpreted with caution. It should be noted that while participants reported less fat intake than sugar intake in terms of grams per day, when converted into calories (1 g of fat is 9 calories and 1 g of sugar is 4 calories), participants reported consuming approximately 600 calories per day from fat and approximately 450 calories a day from sugar on average. We did observe greater variability in reported sugar intake (SD = 88.94) relative to fat intake (39.14) which may explain why sugar intake emerged as a mediator of the relationship between BMI and cognition and not fat intake. Thus, replication in an independent sample is needed.
Inflammation similarly did not emerge as a significant statistical mediator of the relationship between BMI and cognition in the current study. Although the inflammatory composite was not correlated with executive function or episodic memory, the magnitude of the association was meaningful (r ≈ 0.2) and it was significantly correlated with a composite variable created of reaction time-based cognitive tasks. The effect sizes observed are broadly aligned with prior work demonstrating that systemic inflammation is predictive of poor cognitive performance (Marsland et al., Reference Marsland, Petersen, Sathanoori, Muldoon, Neumann, Ryan, Flory and Manuck2006; Heringa et al., Reference Heringa, Van Den Berg, Reijmer, Nijpels, Stehouwer, Schalkwijk, Teerlink, Scheffer, Van Den Hurk and Kappelle2014; Marsland et al., Reference Marsland, Gianaros, Kuan, Sheu, Krajina and Manuck2015), including in youth (Mac Giollabhui et al., Reference Mac Giollabhui, Olino, Nielsen, Abramson and Alloy2019, Reference Mac Giollabhui, Alloy and Hartman2020a, Reference Mac Giollabhui, Swistun, Murray, Moriarity, Kautz, Ellman, Olino, Coe, Abramson and Alloy2020b, Reference Mac Giollabhui, Alloy, Schweren and Hartman2021a, Reference Mac Giollabhui, Mischoulon, Dunlop, Kinkead, Schettler, Liu, Okereke, Lamon-Fava, Fava and Rapaport2023). Exploratory analyses focused on the role of IL-6 – an inflammatory cytokine known to play an important role in metabolism (Mac Giollabhui et al., Reference Mac Giollabhui, Swistun, Murray, Moriarity, Kautz, Ellman, Olino, Coe, Abramson and Alloy2020b, Reference Mac Giollabhui, Foster, Lowry, Mischoulon, Raison and Nyer2022) – demonstrated meaningful associations with cognitive outcomes as well as significant associations with fat intake and BMI. IL-6 routinely is associated with higher BMI (Park et al., Reference Park, Park and Yu2005) and indeed, prior work from our group has shown that higher IL-6 mediated the association between BMI and executive functioning in a longitudinal study of adolescents (Mac Giollabhui et al., Reference Mac Giollabhui, Swistun, Murray, Moriarity, Kautz, Ellman, Olino, Coe, Abramson and Alloy2020b). It should be noted that interpretation of IL-6 signaling is highly context dependent as it is known to exert actions that are both pro-inflammatory and anti-inflammatory and serve functions that can be critical in promoting human health as well as deleterious to human health (Mac Giollabhui et al., Reference Mac Giollabhui, Foster, Lowry, Mischoulon, Raison and Nyer2022). Further investigation into the specific role played by IL-6 signalling may provide mechanistic insight as to the relationship between BMI, poor diet, and cognition.
The current results should be interpreted in light of several methodological considerations. First, our sample was comprised of a combination of college students who tended to be Caucasian and female and local participants who tended to be African American and male. Although this demographic composition allowed for greater diversity in the sample, it also contributed to a clustering of SES, sex, and race making it difficult to isolate the independent effects of these variables. Such clustering may influence observed associations, particularly for immune-related variables, which are known to differ systematically across these groups – see prior work by our group (Mac Giollabhui et al., Reference Mac Giollabhui, Alloy, Swistun, Coe, Ellman, Moriarity, Stumper and Abramson2021b). We were, unfortunately, not powered to investigate demographic-specific patterns. Replication in an independent, more balanced, and better powered sample is therefore needed. Moreover, the current study utilized a self-report measure of dietary intake over the previous month which may be affected by poor recall and social desirability bias. Future research using more proximal measures of nutrition intake, objective (vs. self-report data), and experimental designs is needed to more precisely characterize relationships between sugar and fat intake and cognition. Additionally, it is worth noting that although participants were screened out for diabetes, blood clotting disorders, sickle cell anemia, and autoimmune conditions, analyses did not control for the use of potentially confounding medications (e.g., psychotropic or neurologically active medications) which may impact outcomes of interest and have led to biased parameter estimates due to uncontrolled confounding. Finally, results from statistical mediation analyses should be interpreted with caution, as the relatively small sample size may be insufficient for assessing complex structural path models. Despite these limitations, the current study was strengthened by its inclusion of multiple indicators of inflammation, well-validated assessments measuring distinct domains of cognition, and a robust, composite measure of SES that included caregiver education, and neighborhood income.
Taken together, these results provide support for links between (1) higher BMI and poorer cognitive performance, as well as (2) greater fat and sugar intake and poorer cognitive function even among young, healthy adults. The current study also provides preliminary evidence that higher sugar intake may play a mediating role between BMI and cognitive function. Further longitudinal and experimental research in an independent sample is needed to replicate these findings and characterize underlying mechanisms.
Supplementary material
The supplementary material for this article can be found at https://doi.org/10.1017/neu.2026.10099.



 Open access

