Rewards reflect an important mechanism by which new behaviors are learned, and dysfunction in reward-related neural systems has been associated with problems ranging from substance abuse (Robinson & Berridge, Reference Robinson and Berridge1993) to depression (Nestler & Carlezon, Reference Nestler and Carlezon2006). In particular, neuroimaging studies have implicated the mesolimbic dopamine circuit in the processing of rewards (Knutson, Westdorp, Kaiser, & Hommer, Reference Knutson, Westdorp, Kaiser and Hommer2000; McClure, Laibson, Loewenstein, & Cohen, Reference McClure, Laibson, Loewenstein and Cohen2004; O'Doherty, Deichmann, Critchley, & Dolan, Reference O'Doherty, Deichmann, Critchley and Dolan2002), and alterations in mesolimbic areas have been linked to changes in behavioral and self-reported response to reward (Beaver et al., Reference Beaver, Lawrence, Van Ditzhuijzen, Davis, Woods and Calder2006; Hahn et al., Reference Hahn, Dresler, Ehlis, Plichta, Heinzel and Polak2009; Pessiglione, Seymour, Flandin, Dolan, & Frith, Reference Pessiglione, Seymour, Flandin, Dolan and Frith2006).
A growing body of psychophysiological research has examined the neural response to rewards using feedback negativity (FN). FN is an apparent negative deflection in the event-related potential (ERP) waveform that is evident approximately 300 ms after receiving feedback about monetary rewards and losses (Gehring & Willoughby, Reference Gehring and Willoughby2002). Although FN was originally understood as an error-monitoring signal closely related to error-related negativity (Holroyd & Coles, Reference Holroyd and Coles2002), recent studies have suggested that variation in FN may reflect the absence of a reward-related positivity on monetary loss trials (Baker & Holroyd, Reference Baker and Holroyd2011; Bernat, Nelson, Steele, Gehring, & Patrick, Reference Bernat, Nelson, Steele, Gehring and Patrick2011; Foti, Weinberg, Dien, & Hajcak, Reference Foti, Weinberg, Dien and Hajcak2011). This reward-related positivity appears to be associated with neural activity in the mesocorticolimbic dopamine circuit (Becker, Nitsch, Miltner, & Straube, Reference Becker, Nitsch, Miltner and Straube2014; Carlson, Foti, Mujica-Parodi, Harmon-Jones, & Hajcak, Reference Carlson, Foti, Mujica-Parodi, Harmon-Jones and Hajcak2011; Foti, Carlson, Sauder, & Proudfit, Reference Foti, Carlson, Sauder and Proudfit2014). Consistent with these findings, FN relates to both self-reported reward responsiveness and behavioral response bias measures that reflect sensitivity to reward (Bress & Hajcak, Reference Bress and Hajcak2013).
Furthermore, FN has an established relationship with depression. Smaller FN is associated with increased depressive symptomatology in both adults (Foti et al., Reference Foti, Carlson, Sauder and Proudfit2014; Foti & Hajcak, Reference Foti and Hajcak2009; Liu et al., Reference Liu, Wang, Shang, Shen, Li and Cheung2014) and children (Bress, Smith, Foti, Klein, & Hajcak, Reference Bress, Smith, Foti, Klein and Hajcak2012). Moreover, a blunted FN in never-depressed adolescent girls predicts the onset of new major depressive episodes and increases in depressive symptoms, prospectively (Bress, Foti, Kotov, Klein, & Hajcak, Reference Bress, Foti, Kotov, Klein and Hajcak2013), and also relates to maternal history of depression (Kujawa, Proudfit, & Klein, Reference Kujawa, Proudfit and Klein2014). The effects of FN may be unique to depression: FN relates to depressive but not anxious symptoms (Bress et al., Reference Bress, Smith, Foti, Klein and Hajcak2012) and relates uniquely to depression even when controlling for the contribution of anxiety (Bress, Meyer, & Hajcak, Reference Bress, Meyer and Hajcak2013). Collectively, the evidence suggests that a blunted FN may be useful as a biomarker of depressive symptoms.
Despite the increased use of FN as a measure of reward sensitivity and its abnormalities in relation to depressive symptoms, few studies have examined its psychometric properties. Existing evidence suggests that FN is reliable in the short term. Segalowitz et al. (Reference Segalowitz, Santesso, Murphy, Homan, Chantziantoniou and Khan2010) measured FN to undesirable feedback in a sample of adolescent boys during same-day sessions, one with and one without friends in proximity, and reported moderate stability (rs = .53–.77). Although the test–retest delay was not specified, Segalowitz et al. (Reference Segalowitz, Santesso, Murphy, Homan, Chantziantoniou and Khan2010) also measured FN to monetary loss and gain in young adults between two sessions in which participants were either alert or sleep deprived; the test–retest reliability of FN was moderate to high (rs = .61–.84). Thus, existing evidence suggests that FN may be reliable in adolescents and young adults over a relatively short period of time under varying psychological conditions. However, the reliability of FN has not been reported over a longer period of time, across more consistent settings. Furthermore, given that puberty is a critical time in the development of depression (Angold, Costello, & Worthman, Reference Angold, Costello and Worthman1998; Cohen et al., Reference Cohen, Cohen, Kasen, Velez, Hartmark and Johnson1993; Cyranowski, Frank, Young, & Shear, Reference Cyranowski, Frank, Young and Shear2000) and reward sensitivity (Steinberg, Reference Steinberg2007), it is particularly important to establish the reliability of FN in late childhood through adolescence.
In addition to evaluating the reliability of FN, it is crucial to demonstrate the reproducibility of its relationship with depression, that is, to assess the FN–depression relationship in the same sample of individuals over time, at multiple assessment points. Although the relationship between FN and depression has been demonstrated in cross-sectional studies of adults (Foti et al., Reference Foti, Carlson, Sauder and Proudfit2014; Foti & Hajcak, Reference Foti and Hajcak2009; Liu et al., Reference Liu, Wang, Shang, Shen, Li and Cheung2014) and children (Bress et al., Reference Bress, Smith, Foti, Klein and Hajcak2012), to our knowledge it has never been investigated at multiple time points within the same sample. Demonstrating a reproducible relationship between FN and depression in a sample of children and adolescents is particularly important because ERPs measured in children have a lower signal to noise ratio than those measured in adults (Hammerer, Li, Volkle, Muller, & Lindenberger, Reference Hammerer, Li, Volkle, Muller and Lindenberger2013), and because both depressive symptoms (Costello, Mustillo, Erkanli, Keeler, & Angold, Reference Costello, Mustillo, Erkanli, Keeler and Angold2003) and the amplitude of FN (Hammerer, Li, Muller, & Lindenberger, Reference Hammerer, Li, Muller and Lindenberger2011; Lukie, Montazer-Hojat, & Holroyd, Reference Lukie, Montazer-Hojat and Holroyd2014) may change with development.
The purpose of the current study was to characterize the psychometric properties of FN over a period of 2 years across childhood and adolescence. In order to examine the stability of FN and its relationship with depressive symptoms, participants were assessed once between the ages of 8 and 13 (Bress et al., Reference Bress, Smith, Foti, Klein and Hajcak2012) and again at a 2-year follow-up. At both time points, participants completed a task designed to elicit FN, and both the participant and a parent completed questionnaires assessing depressive symptomatology. The aims of the current study were threefold. The first aim was to investigate the extent to which FN is reliable, both internally and over a period of 2 years. It was hypothesized that, similar to other ERPs (Meyer, Bress, & Proudfit, Reference Meyer, Bress and Proudfit2014; Segalowitz & Barnes, Reference Segalowitz and Barnes1993; Walhovd & Fjell, Reference Walhovd and Fjell2002; Weinberg & Hajcak, Reference Weinberg and Hajcak2011), FN would show moderate internal reliability and longer term stability. The second aim was to examine the relationship between FN and concurrent depressive symptomatology; it was hypothesized that the relationship found at Time 1 (Bress et al., Reference Bress, Smith, Foti, Klein and Hajcak2012) would be reproduced at Time 2. The third aim was to examine the degree to which FN might prospectively predict depressive symptoms. Based on prior findings in a somewhat older sample of adolescent girls (Bress, Foti, et al., Reference Bress, Foti, Kotov, Klein and Hajcak2013), it was hypothesized that a smaller FN at Time 1 would be associated with greater depression at Time 2.
Method
Participants
Participants completed assessments at two time points separated by approximately 2 years. Seventy-one children between the ages of 8 and 13 were recruited from the Stony Brook area for the initial assessment; full recruitment details may be found in prior publications (Bress et al., Reference Bress, Smith, Foti, Klein and Hajcak2012; Glenn et al., Reference Glenn, Klein, Lissek, Britton, Pine and Hajcak2012; Meyer, Weinberg, Klein, & Hajcak, Reference Meyer, Weinberg, Klein and Hajcak2012). Approximately 2 years later, 47 of these participants returned for a follow-up visit. Identical depression questionnaires and electroencephalographic (EEG) tasks were used at both time points.
Depression questionnaire
Participants completed the Children's Depression Inventory Self-Report (CDI:SR) short form, a measure of depressive symptomatology (Kovacs, Reference Kovacs1992). The short form of the CDI:SR consists of 10 items (e.g., sadness and loneliness) assessed over the past 2 weeks. The short form was originally derived from the long form of the CDI through a series of iterations in which 1 item was removed at a time, preserving maximum internal consistency at each iteration; the final coefficient α was 0.80 (Kovacs & MHS Staff, Reference Kovacs2003). Items on the CDI:SR are rated from 0 (e.g., I am sad once in a while) to 2 (e.g., I am sad all the time). Parents completed the parent version of the CDI (CDI:P), which consists of 17 items (e.g., “My child looks sad”) rated from 0 (not at all) to 3 (much or most of the time).
Previous studies suggest that test–retest reliability of the CDI is moderate, with correlations ranging from .56 to .87 (Sitarenios & Kovacs, Reference Sitarenios, Kovacs and Maruish1999). For the CDI:P, reliability is .75 over the span of a month (Wierzbicki, Reference Wierzbicki1987). Internal consistency of the CDI is generally high, with most studies reporting α coefficients of at least 0.80 (Sitarenios & Kovacs, Reference Sitarenios, Kovacs and Maruish1999). Although most of the reliability studies have used the long version of the CDI, scores on the short and long versions of the CDI are highly correlated (Sitarenios & Kovacs, Reference Sitarenios, Kovacs and Maruish1999).
Guessing task (doors task)
In order to elicit FN, a standard guessing task (Dunning & Hajcak, Reference Dunning and Hajcak2007; Foti & Hajcak, Reference Foti and Hajcak2009, Reference Foti and Hajcak2010) was administered using Presentation software (Neurobehavioral Systems, Inc., Albany, CA) while EEG data were collected. During each trial of the guessing task, participants were shown an image of two doors side by side and were instructed to pick one. They were informed before the task began that a correct guess would result in a gain of $0.50, whereas an incorrect guess would result in a loss of $0.25; these amounts were chosen both so that participants would accrue money over the course of the task and so that gains and losses would be perceived subjectively as equally valuable (Tversky & Kahneman, Reference Tversky and Kahneman1981, Reference Tversky and Kahneman1992).
The guessing task consisted of three blocks of 20 trials (60 trials total) separated by breaks that lasted as long as the participant chose. On each trial, an image of two doors appeared and remained onscreen until participants clicked a mouse button corresponding to their choice (left mouse button for the left-hand door or right mouse button for the right-hand door). A fixation mark then appeared for 1000 ms, followed by a feedback screen (either a green “↑” to symbolize a gain or a red “↓” to symbolize a loss) for 2000 ms. Finally, a fixation mark appeared again for 1500 ms, followed by the message, “click for the next round,” which remained onscreen until the participant clicked a mouse button to begin the next trial. Unbeknownst to participants, exactly half (i.e., 30) of the trials resulted in gains and half resulted in losses; these outcomes were randomized over the course of the task.
EEG collection and data reduction
EEG was collected using a customized 34-channel cap (BioSemi, Amsterdam) arranged according to the international 10/20 system, including sites FCz and Iz. Additional activity was recorded from electrodes placed over the right and left mastoids. Electrooculogram activity was recorded from electrodes placed horizontally 1 cm from the outside corner of each eye and from electrodes placed vertically 1 cm above and below the right eye. EEG signals were converted at the electrode with a gain of one and were digitized at 24-bit resolution with a sampling rate of 1024 Hz. The data were filtered using a low-pass fifth order sinc filter with a half-power cutoff of 204.8 Hz. Each electrode was measured online with respect to a common mode sense electrode that formed a monopolar channel.
EEG data were analyzed offline using BrainVision Analyzer (Brain Products, Munich, Germany). All channels were rereferenced to the mastoids and bandpass filtered with cutoffs of 0.1 and 30 Hz. Eyeblink artifacts were corrected using the procedure developed by Gratton, Coles, and Donchin (Reference Gratton, Coles and Donchin1983). Additional artifacts were removed using a semiautomated procedure with a maximum allowed voltage step of 50 μV/ms between sample points, a maximum voltage difference of 300 μV between any two values within a trial, and a minimum voltage of .50 μV in any 100 ms interval.
EEG was segmented into epochs from –200 to 600 ms relative to feedback onset; separate means were then created for loss and gain feedback. FN was scored at FCz, the midline channel where the ΔFN (i.e., the loss minus gain difference) was numerically maximal at both assessments. FN was quantified as the mean amplitude between 275 and 375 ms after feedback onset on gain and loss trials. The ΔFN was calculated as FN to loss minus FN to gain. The difference in FN between gain and loss was also calculated in terms of the unstandardized residual that remained after regressing FN to loss on FN to gain, because some research has shown that this method of measuring the difference between two ERP scores can improve psychometric properties (Weinberg, Venables, Proudfit, & Patrick, Reference Weinberg, Venables, Proudfit and Patrick2014). Furthermore, because recent research has found variation in the latency of FN based on age during adolescence (Crowley et al., Reference Crowley, Wu, Hommer, South, Molfese and Fearon2013), peak latencies of the ΔFN between 200 and 400 ms were extracted for each subject and compared between time points.
In order to calculate split-half reliability, separate means of responses to odd and even trials within the loss and gain conditions were created for each participant; two-tailed Pearson correlations were then conducted between these means and adjusted using the Spearman–Brown prediction formula. All analyses were one tailed because of directional hypotheses, unless otherwise specified.
Procedures
At both visits, parents gave their written informed consent and child participants gave their written informed assent, for their participation. The EEG cap was applied, and the doors task was administered in the context of a battery of other tasks, with task order counterbalanced across participants. A set of computerized questionnaires including the CDI:SR was administered at the end of the visit. Parents completed a set of computerized questionnaires including the CDI:P while their children completed the EEG tasks. At the end of Visit 1, participants received $40.00 for their participation, plus $5 in winnings from the guessing task. At the end of Visit 2, participants received $20 per hour for their participation (usually between $40 and $60 in total), plus $5 in winnings from the guessing task. This study was formally approved by the Stony Brook University Institutional Review Board.
Results
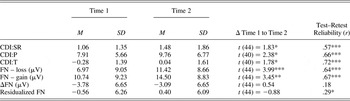
There were no significant differences in age, t (68) = –0.86, p = .40; CDI:SR, t (33.50) = 1.45, p = .16, equal variances not assumed; CDI:P, t (68) = 1.46, p = .15; gender, χ2 (1, N = 70) = 2.74, p = .10; or ethnicity, χ2 (3, N = 70) = 5.11, p = .16, between Time 1 participants who did and did not return for the follow-up visit (all tests two tailed). Two participants did not complete the guessing task at Time 1; these participants were excluded from the current analyses, resulting in a final sample size of 45 (mean age at Time 2 = 12.82 years, SD = 1.51, range = 10–15). Means and standard deviations of the CDI:SR, CDI:P, and FN at Time 1 and Time 2 are presented in Table 1.
Means, standard deviations, and longitudinal analyses of psychological and EEG measures

Note: The analyses of change in feedback negativity (FN) from Time 1 to Time 2 are two tailed. The residualized FN was derived from a regression predicting FN to loss from FN to gain. CDI:SR, :P, and :T, Children's Depression Inventory—Self-Report, Parent, and Total Depressive symptoms.
*p < .05. **p < .01. ***p < .001.
An aggregate measure of total depressive symptoms (CDI:T) was created at each time point by summing the z scores for the CDI:SR and the CDI:P; this variable was used as the primary measure of depressive symptomatology. The CDI:P was not collected from four participants due to experimenter error at Time 2; these participants were therefore excluded from analyses involving the CDI at Time 2. No significant gender differences were found at either time point for age, CDI:T, FN to loss, FN to gain, or ΔFN (all ps > .30, two tailed).
Cross-sectional analyses
Time 1
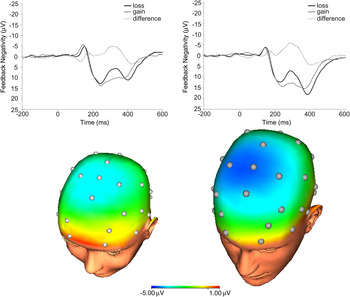
At Time 1, consistent with previously reported results (Bress et al., Reference Bress, Smith, Foti, Klein and Hajcak2012), a ΔFN was apparent as a negative deflection in the ERP waveform at frontocentral sites approximately 330 ms after feedback onset (Figure 1, left) in the subset of participants who later returned for the Time 2 visit. FN to loss was significantly less positive than FN to gain, t (44) = 3.81, p < .001.Footnote 1
(Color online) (Top) Feedback-locked event-related potential waveforms to loss, gain, and loss-gain difference; and (bottom) scalp distribution of the loss minus gain difference at (left) Time 1 and (right) Time 2.

At Time 1, FN to loss showed a split-half reliability of .90 (p < .001), and FN to gain showed a reliability of .79 (p < .001). The ΔFN was also calculated for odd and even trials; the split-half reliability did not reach significance (r = .28, p = .15).Footnote 2
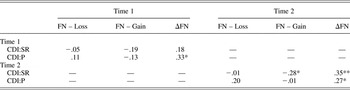
Consistent with previously reported results on the full sample at Time 1 (Bress et al., Reference Bress, Smith, Foti, Klein and Hajcak2012), CDI:T at Time 1 was significantly correlated with the ΔFN (r = .31, p < .05), but not with FN to loss (r = .04, p = .40) or FN to gain (r = –.19, p = .11). Because the ΔFN is a negative-going component, the correlation between CDI:T and the ΔFN indicates that the ΔFN became smaller with increased depressive symptomatology. Correlations between FN and the CDI were also run separately for child and parent reports; these results are presented in Table 2.
Pearson correlations between the FN and measures of depression

Note: FN, Feedback negativity; CDI:SR and :P, Children's Depression Inventory—Self-Report and Parent.
*p < .05. **p < .01.
Age correlated with FN to loss (r = .46, p < .01, two tailed) and FN to gain (r = .40, p < .01, two tailed), but not the ΔFN (r = .07, p = .64, two tailed). That is, the ERPs became more positive overall with increasing age: FN to loss was decreased (i.e., was less negative), and FN to gain was increased (i.e., was more positive) among older participants at Time 1.
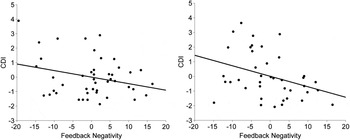
When age and the ΔFN were entered as simultaneous predictors of CDI:T in a linear regression, the unique contribution of the ΔFN to variance in the CDI:T remained significant, R 2 = .12, F (2, 42) = 2.80, p < .05; β = 0.30, t (42) = 2.07, p < .05. Moreover, in a separate linear regression predicting CDI:T, the contribution of FN to gain became significant when controlling for age, R 2 = .10, F (2, 42) = 2.44, p = .05; β = –0.30, t (42) = –1.89, p < .05; a scatterplot of this relationship is depicted in Figure 2 (left). In a third regression, the relationship between FN to loss and CDI:T remained nonsignificant when controlling for age, R 2 = .03, F (2, 42) = 0.65, p = .26; β = –0.05, t (42) = –0.28, p = .39.
Scatterplots illustrating the relationship between depressive symptoms and the amplitude of feedback negativity to gain, controlling for age, at (left) Time 1 and (right) Time 2. Residualized feedback negativity values are shown.

Time 2
The findings described above were replicated at Time 2. FN was apparent at frontocentral sites approximately 290 ms after feedback onset (Figure 1, right), and FN to loss was significantly less positive than FN to gain, t (44) = 3.11, p < .01.Footnote 3
Split-half reliability for Time 2 was calculated identically to Time 1. At Time 2, FN to loss and gain (r = .82, p < .001 and r = .84, p < .001, respectively), but not the ΔFN (r = .37, p = .07) had high internal reliability.Footnote 4
CDI:T correlated significantly with the ΔFN at Time 2 (r = .41, p < .01; Figure 2, right), but not with FN to loss (r = .09, p = .29) or FN to gain (r = –.20, p = .10). Correlations between FN and the CDI were also run separately for child and parent reports; these results are presented in Table 2. Age correlated with FN to loss (r = .59, p < .001, two tailed) and FN to gain (r = .43, p < .01, two tailed), but not the ΔFN (r = .19, p = .21, two tailed).
Similar to Time 1, in separate analyses controlling for age, both the ΔFN, R 2 = .21, F (2, 38) = 5.07, p < 01; β = 0.38, t (38) = 2.61, p < .01, and FN to gain, R 2 = .20, F (2, 38) = 4.81, p < .01; β = –0.41, t (38) = –2.52, p < .01, contributed significantly to the variance in CDI:T, whereas FN to loss, R 2 = .08, F (2, 38) = 1.58, p = .11; β = –0.11, t (38) = –0.57, p = .29, did not; the relationship between FN to gain and CDI:T when controlling for age is depicted in Figure 2 (right). Thus, all relationships observed at Time 1 were reproduced at Time 2.
Longitudinal analyses
Values of FN and the CDI at Time 1 and Time 2 are presented in Table 1. Both FN to loss and FN to gain became more positive from Time 1 to Time 2. However, the amplitude of the ΔFN did not differ significantly between time points.Footnote 5 There was a significant increase in CDI:T from Time 1 to Time 2; that is, participants overall were more depressed at the second time point.
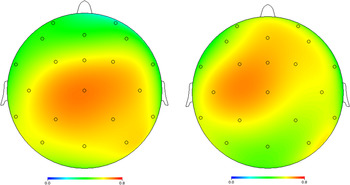
Pearson correlations between Time 1 and Time 2 variables are presented in Table 1. CDI:T at Time 1 predicted CDI:T at Time 2; that is, children with greater depression at baseline had greater depression at follow-up. Scalp distributions of the Pearson correlation coefficients between Time 1 and Time 2 are presented in Figure 3 for FN to loss (left) and FN to gain (right). Test–retest reliability (as measured by intersubject stability, i.e., Pearson r) of FN to loss was moderate to large between Time 1 and Time 2; likewise, test–retest reliability of FN to gain was moderate to large. As illustrated in Figure 3, FN to loss was most stable across time at central sites, whereas FN to gain was most stable across time at the frontocentral and left frontal sites. The ΔFN at Time 1 did not correlate with the ΔFN at Time 2.Footnote 6
(Color online) Scalp distributions of the Pearson correlation coefficients between Time 1 and Time 2 for the activity in response to (left) losses and (right) gains. Activity was measured as the mean amplitude from 275 to 375 ms following feedback onset at both time points.

A series of linear regressions was then run to determine the extent to which FN at Time 1 uniquely predicted variability in FN at Time 2. The relationship between FN to loss at the two time points remained significant, R 2 = .51, F (3, 37) = 12.75, p < .001; β = 0.42, t (37) = 3.24, p < .01, when controlling for Time 2 age and depressive symptoms (i.e., CDI:T), as did the relationship of FN to gain at the two time points, R 2 = .54, F (3, 37) = 14.25, p < .001; β = 0.53, t (37) = 4.08, p < .001, when controlling for Time 2 age and depressive symptoms in a separate regression. The relationship between ΔFN at Time 1 and Time 2 remained nonsignificant when controlling for Time 2 age and depression, R 2 = .17, F (3, 37) = 2.47, p < .05; β = 0.02, t (37) = 0.15, p = .44.
Relationships between Time 1 FN and Time 2 depression were also examined. Time 2 CDI:T was not significantly correlated with Time 1 FN to loss (r = .06, p = .36) or FN to gain (r = –.16, p = .16), but was positively correlated with Time 1 ΔFN (r = .29, p < .05), such that participants with smaller (i.e., less negative) ΔFNs at Time 1 tended to have higher depression scores at Time 2. When FN to loss at Time 1 was entered as a predictor of Time 2 CDI in a linear regression controlling for Time 2 age, the contribution of FN to loss remained nonsignificant, R 2 = .07, F (2, 38) = 1.49, p = .12; β = –0.07, t (38) = –0.40, p = .35. In contrast, when FN to gain at Time 1 was entered as a predictor of Time 2 CDI in a separate regression controlling for Time 2 age, the relationship between FN to gain and at Time 1 and CDI:T at Time 2 became significant, R 2 = .15, F (2, 38) = 3.47, p < .05 ; β = –0.32, t (38) = –1.96, p < .05. The contribution of Time 1 ΔFN to Time 2 CDI remained significant when controlling for Time 2 age, R 2 = .15, F (2, 38) = 3.36, p < .05; β = 0.29, t (38) = 1.90, p < .05.
The same analyses were then conducted with Time 1 CDI as an additional predictor of Time 2 CDI. Controlling for Time 1 CDI and Time 2 age, the contribution of FN to loss, R 2 = .53, F (3, 37) = 13.81, p < .001; β = –0.04, t (37) = –0.32, p = .37; FN to gain, R 2 = .54, F (3, 37) = 14.29, p < .001; β = –0.11, t (37) = –0.89, p = .19; and the ΔFN, R 2 = .53, F (3, 37) = 14.07, p < .001; β = 0.08, t (37) = 0.69, p = .25, at Time 1 were not significant.
Discussion
The current study examined the internal and test–retest reliability of FN, as well as the reproducibility of its relationship with depression, over the course of 2 years during late childhood and early adolescence. Prospective relationships between FN and depression were also assessed. As hypothesized, FN to loss and gain showed strong internal reliability at both time points and demonstrated moderate to strong longer term stability. FN to loss and gain were most stable between time points at frontocentral sites, where FN is maximal and typically scored; FN to gain also showed similarly high reliability at some slightly lateralized sites. Long-term test–retest reliability remained significant when controlling for the effects of age and depression, suggesting that stability was not simply due to developmental factors or to the influence of depression. Moreover, the previously reported relationship between the ΔFN and depressive symptomatology at Time 1 (Bress et al., Reference Bress, Smith, Foti, Klein and Hajcak2012) was reproduced at Time 2, suggesting that the relationship between FN and depression remains apparent across testing sessions, even when separated by 2 years in late childhood and early adolescence. When controlling for the contribution of age, FN to gain (but not FN to loss) also predicted concurrent depressive symptomatology at each time point. This finding is consistent with past studies, which have suggested that the effects of FN are specifically related to neural response to rewards (Baker & Holroyd, Reference Baker and Holroyd2011; Bernat et al., Reference Bernat, Nelson, Steele, Gehring and Patrick2011; Bress, Foti, et al., Reference Bress, Foti, Kotov, Klein and Hajcak2013; Carlson et al., Reference Carlson, Foti, Mujica-Parodi, Harmon-Jones and Hajcak2011; Foti et al., Reference Foti, Weinberg, Dien and Hajcak2011).
Both FN to loss and FN to gain became more positive from Time 1 to Time 2; this is consistent with the cross-sectional effects observed in this sample at both time points. Thus, the amplitude of FN appears to change over the course of development. This finding is also consistent with results described by Hammerer et al. (Reference Hammerer, Li, Muller and Lindenberger2011), who found that both FN to loss and FN to gain become more positive across the life span.
When controlling for age in the current study, both FN to gain and ΔFN at Time 1 predicted depressive symptomatology at Time 2. This is broadly consistent with our prior findings in girls during late adolescence (Bress, Foti, et al., Reference Bress, Foti, Kotov, Klein and Hajcak2013), in which a blunted ΔFN was associated with onset of subsequent depressive episodes, and a blunted FN to gains was associated with subsequent depressive symptoms. However, these relationships did not remain significant in the current study after controlling for baseline depression. It is possible that this effect would become significant with a larger sample; alternatively, it may be that FN uniquely predicts later depression only during later adolescence or in girls with more severe symptomatology.
Although the correlation between the ΔFN at Time 1 and Time 2 was in the expected direction (i.e., individuals with more negative ΔFNs at Time 1 tended to have more negative ΔFNs at Time 2), this relationship did not reach significance when using a subtraction-based difference score. However, when the change in FN between losses and gains was calculated as a residual value, test–retest reliability was significant, albeit only when using a one-tailed test of significance. The residualized difference score also had more robust internal reliability, suggesting that this score might have superior psychometric properties compared to the more traditional subtraction-based difference score (see Weinberg et al., Reference Weinberg, Venables, Proudfit and Patrick2014). It is well established that difference scores tend to be less reliable than their constituent scores (Chiou & Spreng, Reference Chiou and Spreng1996); this tendency has been attributed to the accumulation of measurement error, among other factors (Chiou & Spreng, Reference Chiou and Spreng1996). This may explain the lower reliability of the ΔFN in the current findings. Furthermore, the reliability of difference scores is limited by the extent to which their component scores are related (Chiou & Spreng, Reference Chiou and Spreng1996; Edwards, Reference Edwards1994). Given the high correlations between FN to loss and FN to gain at both time points (rs = .74 and .71), the lower reliability of the ΔFN is perhaps not surprising.
In recent years, increasing emphasis has been placed on examining core neural processes that may underlie dimensional characterizations of psychopathology such as depression (Insel et al., Reference Insel, Cuthbert, Garvey, Heinssen, Pine and Quinn2010). Some have argued that in contrast to the standard diagnostic criteria (i.e., the Diagnostic and Statistical Manual of Mental Disorders; American Psychiatric Association, 2000), symptoms might better be distinguished in terms of differences in core cognitive, emotional, and physiological processes (Clark & Watson, Reference Clark and Watson1991; Luck et al., Reference Luck, Mathalon, O'Donnell, Hamalainen, Spencer and Javitt2011; Schmidt, Shelton, & Duman, Reference Schmidt, Shelton and Duman2011). Identification of neurophysiological markers (i.e., biomarkers) such as ERPs has been suggested as one means by which core processes that underlie distinctions between disorders might be clarified (Luck et al., Reference Luck, Mathalon, O'Donnell, Hamalainen, Spencer and Javitt2011).
Previous studies have suggested that FN may reflect the activity of reward-related neural systems (Bress & Hajcak, Reference Bress and Hajcak2013; Carlson et al., Reference Carlson, Foti, Mujica-Parodi, Harmon-Jones and Hajcak2011; Foti et al., Reference Foti, Weinberg, Dien and Hajcak2011), and constitute a biomarker of depression (Bress, Meyer, et al., Reference Bress, Meyer and Hajcak2013); the current results support this possibility. Luck et al. (Reference Luck, Mathalon, O'Donnell, Hamalainen, Spencer and Javitt2011) describe a useful biomarker as one that has predictive ability, reflects individual differences in cognitive or neural processes, and has good measurement properties. In line with this description, a blunted ΔFN has been shown to predict the onset of future major depressive episodes (Bress, Foti, et al., Reference Bress, Foti, Kotov, Klein and Hajcak2013), and the amplitude of FN in response to gains predicts subsequent depressive symptoms (Bress, Foti, et al., Reference Bress, Meyer and Hajcak2013). Furthermore, the ΔFN relates to measures of concurrent depressive symptoms (Bress et al., Reference Bress, Smith, Foti, Klein and Hajcak2012; Foti & Hajcak, Reference Foti and Hajcak2009) and reward sensitivity (Bress & Hajcak, Reference Bress and Hajcak2013). However, the current results indicate that FN to gain may have psychometric properties superior to those of the ΔFN, and may also relate more strongly than the ΔFN to depressive symptoms after accounting for age. In a clinical context, the ΔFN/FN to gain and other neural measures of reward sensitivity might be incorporated into a panel of markers that, together, could make up “biological signatures” specific to depression or its subtypes (e.g., Schmidt et al., Reference Schmidt, Shelton and Duman2011).
Although the current study used a normative sample, and diagnostic measures were not used, the finding relating FN to depressive symptoms is an important one. Even in normative samples, every additional symptom of depression accounts for a substantial increase in risk for subsequent clinically significant depression (Keenan, Feng, Hipwell, & Klostermann, Reference Keenan, Feng, Hipwell and Klostermann2009; Klein, Shankman, Lewinsohn, & Seeley, Reference Klein, Shankman, Lewinsohn and Seeley2009). However, as research on FN continues, it will also be important to assess the reliability of this ERP in clinical samples. Previous studies have demonstrated that reliability of the P300 is less stable in individuals diagnosed with posttraumatic stress disorder compared to controls (Neylan et al., Reference Neylan, Jasiukaitis, Lenoci, Scott, Metzler and Weiss2003); in contrast, several components show comparable long-term reliability between individuals with alcohol dependence and controls (Sinha, Bernardy, & Parsons, Reference Sinha, Bernardy and Parsons1992). Thus, although it appears that the presence of psychopathology can influence the reliability of ERPs, this effect varies across diagnoses and ERP components. Therefore, it remains an open question whether the reliability of FN would be impacted by the presence of clinically significant symptoms of depression.
The current findings provide evidence that FN to gain and loss remain relatively stable within a single session and over time, even before adulthood; moreover, the relationship between FN and depression is reproducible in a single group of children and adolescents assessed 2 years apart. A blunted FN also prospectively predicts increased depressive symptomatology in 8- to 13-year-olds, extending results from a prior study with an older sample of adolescents. Although other measures such as sensitivity and specificity have yet to be ascertained, the current results provide a broader understanding of the psychometric properties of FN and represent an important step in establishing FN as a biomarker of depression.