Introduction
Instrumented indentation testing (IIT) is a useful technique in materials science and engineering due to the straightforwardness of the testing method, which allows to determine the mechanical properties, such as elastic modulus and hardness. The technique involves the penetration of an indenter of known properties and geometry into a material of unknown properties; during the penetration and withdrawal of the indenter, force and penetration depth are continuously recorded, leading to the so-called load–displacement curve.
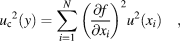
Like many mechanical systems, instrumented indentation devices are affected by several sources of uncertainty, which have an influence on the estimation of the mechanical properties. The sources of uncertainty are related to different factors, such as the instrument, sample, indenter, test parameters, processing, environment, and calculation methods. The study of these uncertainties has been carried out by several authors, typically by an analytical approach, using the law of propagation of uncertainties [Eq. (1)] [Reference Cagliero, Barbato, Maizza and Genta1, Reference Ullner2, Reference Menčík and Nemecek3, Reference Menčik and Swain4] described in the guide to the expression of uncertainty measurement (GUM) [5].
 $${u_{\rm{c}}}^2\left( y \right) = \sum\limits_{i = 1}^N {{{\left( {{{\partial f} \over {\partial {x_i}}}} \right)}^2}} {u^2}\left( {{x_i}} \right)\quad ,$$
where f is a specific function, u(x i) is a standard uncertainty, and N is the number of uncertainty sources. The combined standard uncertainty u c(y) is an estimated standard deviation and characterizes the dispersion of the values that could be reasonably attributed to the measurand Y [5]. This is a general expression for the case of non-correlated input quantities.
Another common consideration in IIT is to simplify the uncertainties to the standard deviation obtained from the experimental data that represent only the stochastic part of the measurements [Reference Herrmann, Lucca, Klopfstein and Menelao6].
In general, the evaluation of uncertainty by the analytical method leads to disadvantages, such as (i) the difficulty in finding the expression of the function f, e.g., the model cannot be described by a simple mathematical expression and might include computations through finite element analysis; (ii) the function may not be differentiable; and (iii) the evaluation of the covariances due to interrelated sources is often difficult.
However, the determination of uncertainties in instrumented indentation tests or any measurement process is of crucial importance for evaluating the results. To ensure the traceability to the units and to identify the relevant sources of error, it is necessary to improve the measurement process by carrying out a sensitivity study. In addition, the uncertainty estimation makes it possible to identify the significant difference between two measurements or between the measurement and the model.
To avoid uncertainties estimation through the analytical method, this work introduces the concept of virtual machine (VM) in IIT to perform uncertainty estimation.
The concept of VM was introduced to compute and evaluate the uncertainties in complex systems, such as coordinate measuring machines (CMM), atomic force microscope (AFM), and surface texture measuring instruments [Reference Giusca, Leach and Forbes7, Reference Sładek and Gąska8, Reference Sładek, Ostrowska and Gąska9, Reference Gąska, Harmatys, Gąska, Gruza, Gromczak and Ostrowska10, Reference Ceria, Ducourtieux, Boukellal, Allard, Fischer and Feltin11, Reference Xu, Dziomba and Koenders12]. The basis of this concept is the emulation of the measuring process through statistic simulation. To generalize, the real machine records the experimental data, then further sets of data are generated by the VM by creating systematic and random deviations taking into account the uncertainties on the real system. The model of the measuring process and the uncertainty sources affecting it are analogous to the classical uncertainty. However, the problem is solved by a virtual experiment instead of an analytical one [Reference Trenk, Franke and Schwenke13].
The VM concept was initially developed for CMM, because the measurements are affected by many uncertainty contributors. Previously, methods such as the multiple measurement method, substitution method, and analytical method based on the calculation of uncertainty of indirect measurement were used to assess the accuracy of coordinate measurements [14, Reference Joskowicz, Ostrovsky-Berman and Myers15, Reference Piratelli-Filho and di Giacomo16]. Nowadays, the simulative methods founded in the concept of VM are preferred for the estimation of uncertainties in CMM. Different approaches have been developed for this concept. One method is based on the identification of error sources, including kinematic errors, probe head errors, measuring strategy, and analytical method [Reference Trenk, Franke and Schwenke13, Reference Summerhays, Baldwin, Campbell and Henke17, Reference Sładek and Gaska18]. Another approach is founded in a matrix method with the identification of errors at selected points and the construction of a CMM model using artificial neural networks [Reference Sładek and Gaska18]. Trenk et al. [Reference Trenk, Franke and Schwenke13] created a software tool for uncertainty evaluation in CMM by the VM concept using Monte Carlo simulations applied to the error behavior of a real CMM. Similarly, Sładek and Gąska [Reference Sładek and Gąska8] developed a method related to Monte Carlo simulations, in which the residual and random errors depend on kinematic system of CMM and workings of the probe head are considered.
The purpose of this work is to present a new methodology to estimate the uncertainties in IIT. This methodology based on the VM concept uses a mathematical model that schematizes and simulates the testing process, evaluating the uncertainties through Monte Carlo simulations, which consist in the propagation of distributions by performing random sampling from probability distributions in the input quantities to evaluate the output (measurand) [19]. This solution based on the Monte Carlo method [19] is an approach that looks to ensure consistency between calculations and physical reality.
This work focuses on the study of the elastic modulus (E) as measurand for two materials (fused silica and steel) at the nanoindentation scale. Additional studies are possible at micro- and macro-scales.
Application of VM concept in IIT
VM in IIT
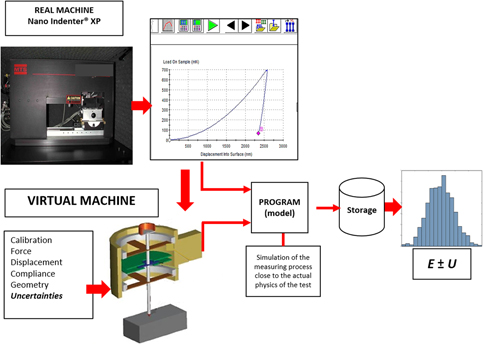
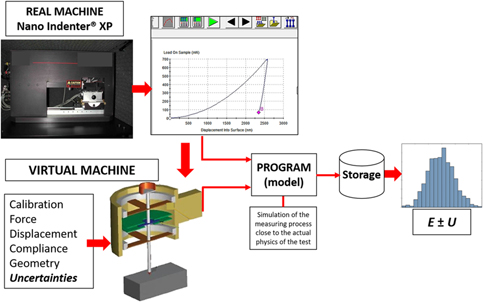
The application of the VM concept in instrumented indentation is a novel approach in this field. The schematic representation of this process is presented in Fig. 1.
Schematic representation of the VM concept in IIT. E, the average elastic modulus, considered as the best estimate and U is the expanded uncertainty related to it.

Figure 1 shows a general approach that could be applied to every indentation system. In this work, we performed the tests with the instrument Nano Indenter® XP (MTS Systems Corporation, Oak Ridge, TN) and we selected the elastic modulus as the measurand.
The VM concept consists in the imitation of the measuring process using a statistic simulation that considers the uncertainties during the process. The experimental data (load–displacement curves) from the instrument are introduced in the VM and treated by a program that contains the uncertainty sources. The program is written to reproduce as close as possible the physics of the testing process. From this step, new load–displacement curves are created by the Monte Carlo simulation method, taking into account the propagation of uncertainties. These results are stored and statistically analyzed, obtaining the average E supposed as the best estimation and its standard deviation (U = 2u, being u the standard deviation and U the expanded uncertainty). Nevertheless, a more complete study could be needed (hypothesis about probability density law, quantile, and so on).
It is essential to start by clearly defining the measurand, which is the well-defined physical quantity subject to measurement [5]. To achieve a low level of uncertainty, the measurand needs a detailed definition. For example, in this work the elastic modulus is defined as:
“The elastic modulus is estimated by classic single load–unload nanoindentation tests performed with the Nano Indenter® XP. The tests are performed at constant time, whatever the load. The Oliver and Pharr function [Reference Oliver and Pharr20, Reference Oliver and Pharr21] is used for tip area calibration performed on fused silica. The stiffness is computed from the fitting of the unloading curve by the Oliver and Pharr power law function.”
For the application of the VM concept, it is necessary to have information related to the traceability and uncertainties of the measuring system. The most information you have of your system, the most accurate would be the uncertainty estimation. Traceability and uncertainties are described in the following sections.
Traceability in IIT
The essence of the International System of Units (SI) traceability consists in a chain of events that start from primary standards of a unit of measure maintained by national measurement institutes (NMIs), where they are used to calibrate secondary artifacts; these secondary artifacts are disseminated and used to calibrate other sensors or instruments, which are again used to calibrate other sensors and instruments. Each calibration is a comparison back to the primary standard, and the uncertainty associated with propagating the unit from one device to the next is evaluated at each step [Reference Pratt, Kramar, Newell and Smith22].
Modern nanoindentation instruments can be calibrated to traceable standards. In these instruments, force and displacement are the primary concern.
Usually, force calibration is done by deadweight, which consists in a primary standard of force from traceable mass artifact combined with an accurate estimate of the local gravity expressed in appropriated units of length and time. Typically, the lowest traceable force by a deadweight standard is around 1 N. However, any magnitude is achievable if a traceable mass artifact that corresponds to the deadweight is available [Reference Kim and Pratt23]. Some practices to calibrate forces from millinewtons to micronewtons consist in using the down-slope component of gravity acting on an object on an inclined plane to generate small forces [Reference Fujii24]; another approach is based on the use of mass comparators, where force sensors are pressed against these mass comparators using a precision positioning stage [Reference Kim and Pratt23].
Nowadays, methods using deadweights were improved to measure small forces in nanoindentation; nevertheless, it is not suitable for very small forces (<5 μN) [Reference Pratt, Kramar, Newell and Smith22, Reference Kim and Pratt23]. For forces below this value, many efforts have been done to achieve traceable force [Reference Pratt, Kramar, Newell and Smith22, Reference Pratt, Smith, Kramar and Newell25, Reference Smith, Shaw, Seugling, Xiang and Pratt26].
Displacement calibration is typically performed by laser interferometry that can provide the necessary accuracy for the length measurements even for the very small resolutions [Reference Pratt, Kramar, Newell and Smith22, Reference Lawall and Kessler27, 28].
Different verification methods have been developed to measure the tip geometry [28, Reference Song, Rudder, Vorburger and Smith29, Reference Germak and Origlia30]. Each indenter should be delivered with a certificate that becomes from a traceable standard. Besides, calibration of the diamond tip should be continuously performed, one of the most common practices in testing a material of known properties, such as fused silica, to determine the area function of the indenter [Reference Oliver and Pharr20]. Nevertheless, some authors prefer physical and meaningful methods, such as direct measurement of the tip, to determine the tip rounding and the deviations from the apex angle [Reference VanLandingham, Juliano and Hagon31].
It is worth mentioning that to obtain values of hardness and elastic modulus with an accuracy approximated to 5%, force and displacement must be accurate to 1%; therefore, they have to be calibrated with devices that are accurate to 0.25–0.5% in a traceable chain [Reference Pratt, Kramar, Newell and Smith22].
At the international level, the equivalence between national metrological institutes is demonstrated by intercomparison recorded at the Bureau International des Poids et Mesures in the key comparison database (KCDB). The existence of intercomparison integrated in the KCDB on a quantity guarantees the existence of a recognized traceability chain. In this database, hardness follows a traceability chain but not elastic modulus. Hardness traceability is related to the calibration through hardness blocks mostly associated with classic hardness tests at the micro- and macro-scales. Without a defined traceability chain for elastic modulus, the measurand selected for this study needs to be directly linked to the traceability of the force and indenter displacement, and to the traceability of the mechanical properties of the calibration material.
Uncertainties in IIT
Uncertainties representation through Ishikawa diagram
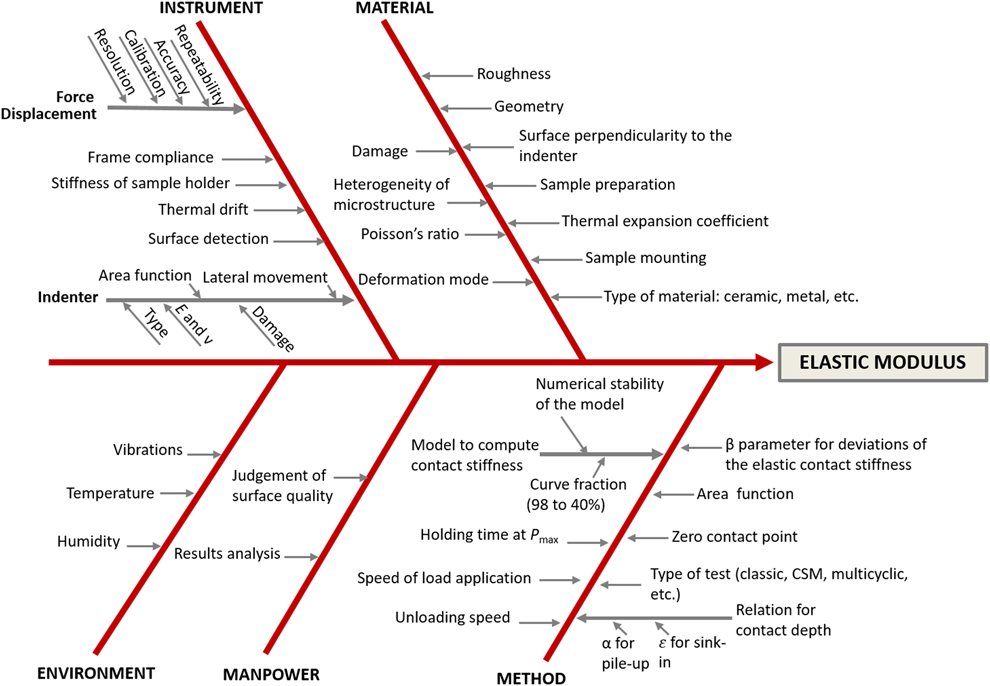
The Ishikawa diagram (Fig. 2) summarizes the main sources of uncertainty contributing to the elastic modulus as the measurand calculated from IIT. Nevertheless, according to the instrument, environment, and tested materials, other sources might be included. A detailed revision of many of these sources of uncertainty can be found in different scientific productions [Reference Cagliero, Barbato, Maizza and Genta1, Reference Ullner2, Reference Menčík and Nemecek3, Reference Menčik and Swain4, Reference Pelletier, Dekkers, Govaert, den Toonder and Meijer32, Reference Fischer-Cripps33, Reference Crawford, Chawla, Koopman, Carlisle and Chawla34, Reference Marteau, Mazeran, Bouvier and Bigerelle35].
Ishikawa diagram for IIT for elastic modulus as the measurand. A similar diagram is applicable for instrumented hardness. E: elastic modulus; ν: Poisson’s ratio; α, ε, and β: constants.
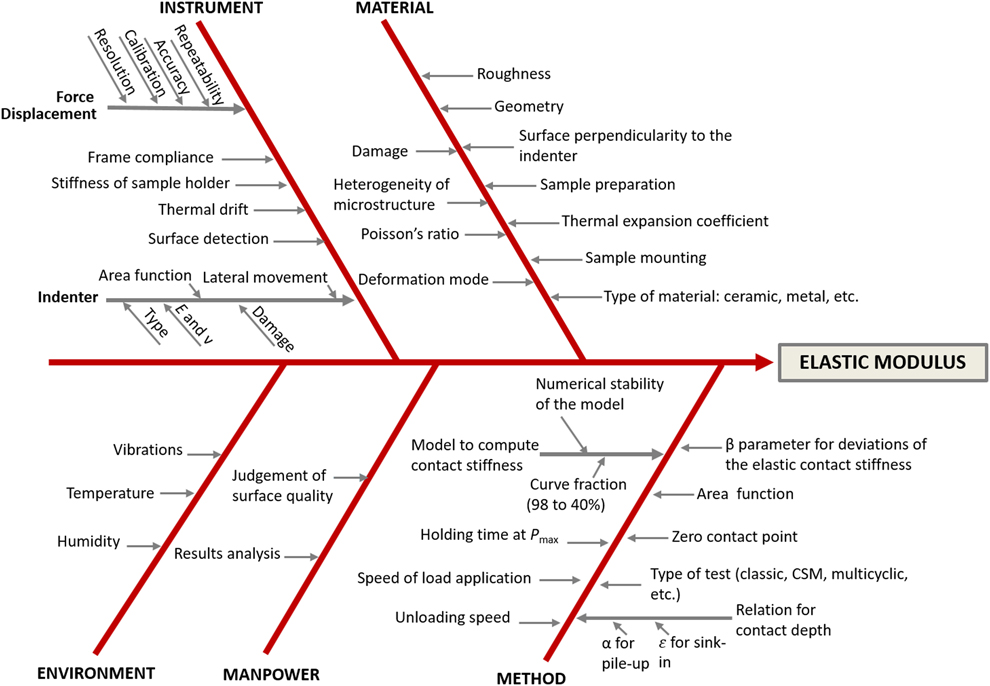
In general, the influence of the operator is not important in IIT, since the results depend on the data recorded by the instrument.
The uncertainty sources linked to the instrument, material, method, and environment affect directly the estimation of the mechanical properties. The influence of some sources might be more or less relevant according to many factors, such as the conception of the instrument, the scale of measurement, the material, etc.
Quantification and classification of uncertainties in nanoindentation tests
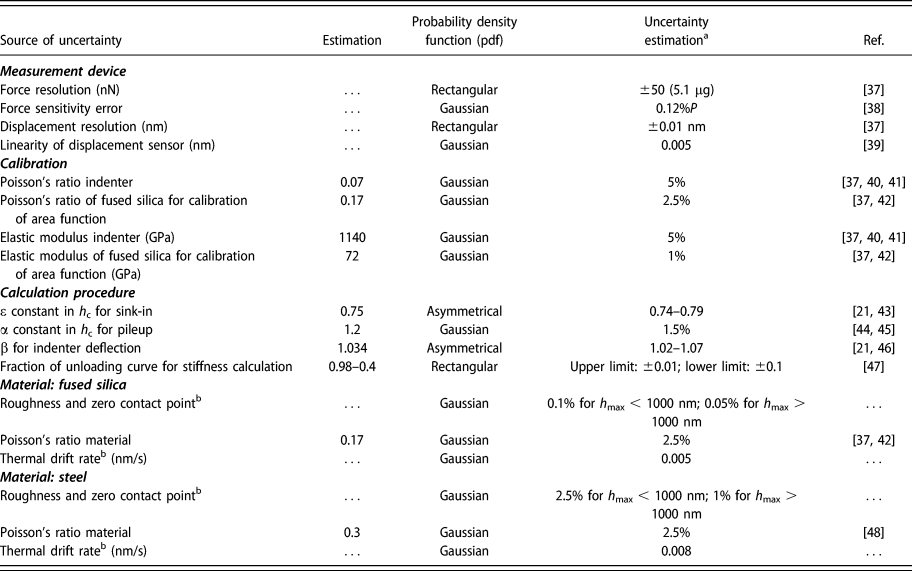
Table I summarizes the selected uncertainty sources, their corresponding estimations, the probability density function, and the assigned uncertainties. The information is adapted to the experimental conditions in the Nano Indenter® XP, the tested materials, and the analysis procedure. It should be noted that a similar analysis is suitable for other instruments and scales of measurement.
Sources of uncertainties related to the instrumented indentation tests with the Nano Indenter® XP.
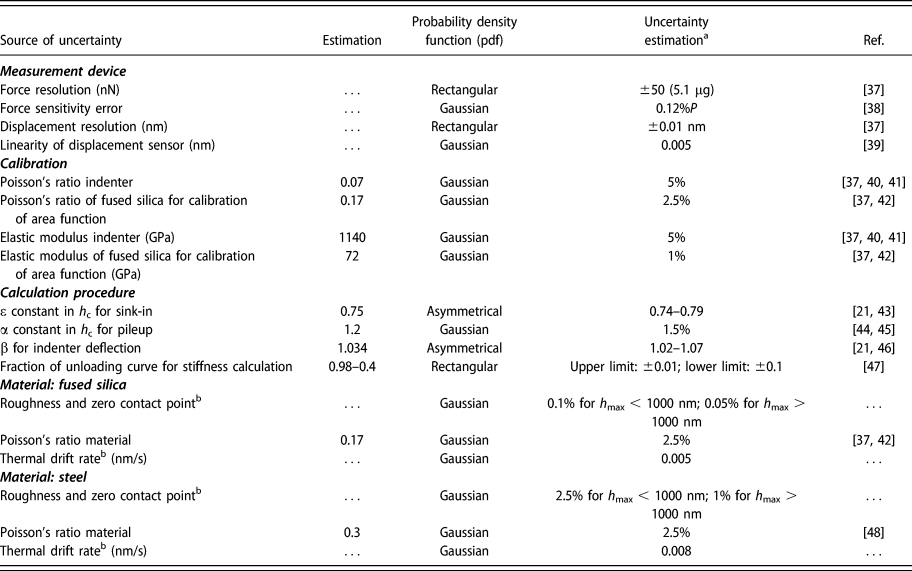
a The uncertainty estimation corresponds to the dispersion for the rectangular pdf and to the standard uncertainty for the Gaussian pdf. The Gaussian distribution is centered at the estimation value.
b Obtained from experimental data.
Linearity of the displacement sensor and distributions are explained in Supplementary material.
Most of the uncertainty’s sources are obtained from the information available in the literature and are considered as type B evaluation [Reference Hogan36]. The selected sources of uncertainty are related to the indentation system (measurement device and indenter), calibration procedure, calculation procedure, and testing materials. The assigned values correspond to certificates, scientific articles, manuals, datasheets, estimations from previous studies, expert opinions, as well as experimental dispersion and reproducibility. Uncertainties estimations listed in Table I are presented as values directly related to a given source of uncertainty or to the impact over a specific parameter, e.g., the maximum displacement (h max).
Environmental sources are not considered because the nanoindenter is integrated with an antivibration system and the temperature in the room is approximately constant to 22 °C.
The frame stiffness is a physical source of uncertainty, which depends on the instrument elements (indenter column, gantry, connection between parts, etc.), the specimen, and indenter mounting. It is calculated for every batch of tests according to Eq. (3) (“Analysis” section). Furthermore, the experimentally determined value is only valid in the limit of contact stiffness less than or equal to the maximum contact stiffness used to determine its magnitude. Beyond that, the frame stiffness is being extrapolated.
The experimental conditions, in particular the mounting conditions, influence the load–displacement data. From a metrological point of view, stiffness can be interpreted as a correction factor. Moreover, the whole experimental process is subject to uncertainties (Table I). In the calculation process, as described in “Analysis” section, stiffness appears as an intermediate result, which depends on the uncertainties in the process. Thus, the stiffness is associated with an uncertainty. Nevertheless, this uncertainty is not an additional parameter but comes from the calculation. The uncertainty of stiffness is therefore automatically taken into account as part of the Monte Carlo process. This method allows to automatically take into account the eventual covariances.
On the other hand, the tip geometry is taken into account within the area function, which is calculated with the experimental data. As the frame stiffness, the area function is an intermediate result associated with an uncertainty. It would be possible to store the values of frame stiffness and area coefficients at each Monte Carlo loop to perform a statistical study.
The integration of all the sources presented in the Ishikawa diagram into the evaluation through the VM concept is very complex, since finding a physical estimate for each source is not trivial. For example, how to determine the error related to microstructural heterogeneity or to damage? Hence, only the sources listed in Table I are included for the further analysis, considering that those sources would lead to a representative uncertainty over the measurand. Some examples of the relationships used for calculations are given in Supplementary Material.
Model to compute the uncertainties by the VM concept
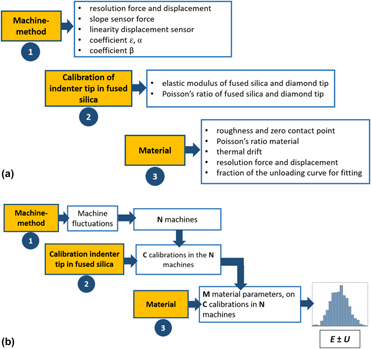
The mathematical model should represent an approach of the physics of the indentation process. The program considering the mathematical model was written in Mathematica language. It is based on a three-level model [Reference Romdhani, Hennebelle, Ge, Juillion, Coquet and Fontaine49]: machine-method, calibration, and tested material (Fig. 3).
(a) Schematic representation of the VM program for uncertainties evaluation in nanoindentation tests. (b) Schematic representation of the functioning of VM program for uncertainties evaluation in nanoindentation tests. N, C, and M are the number of Monte Carlo trials corresponding to the machine, calibration procedure, and material, respectively.
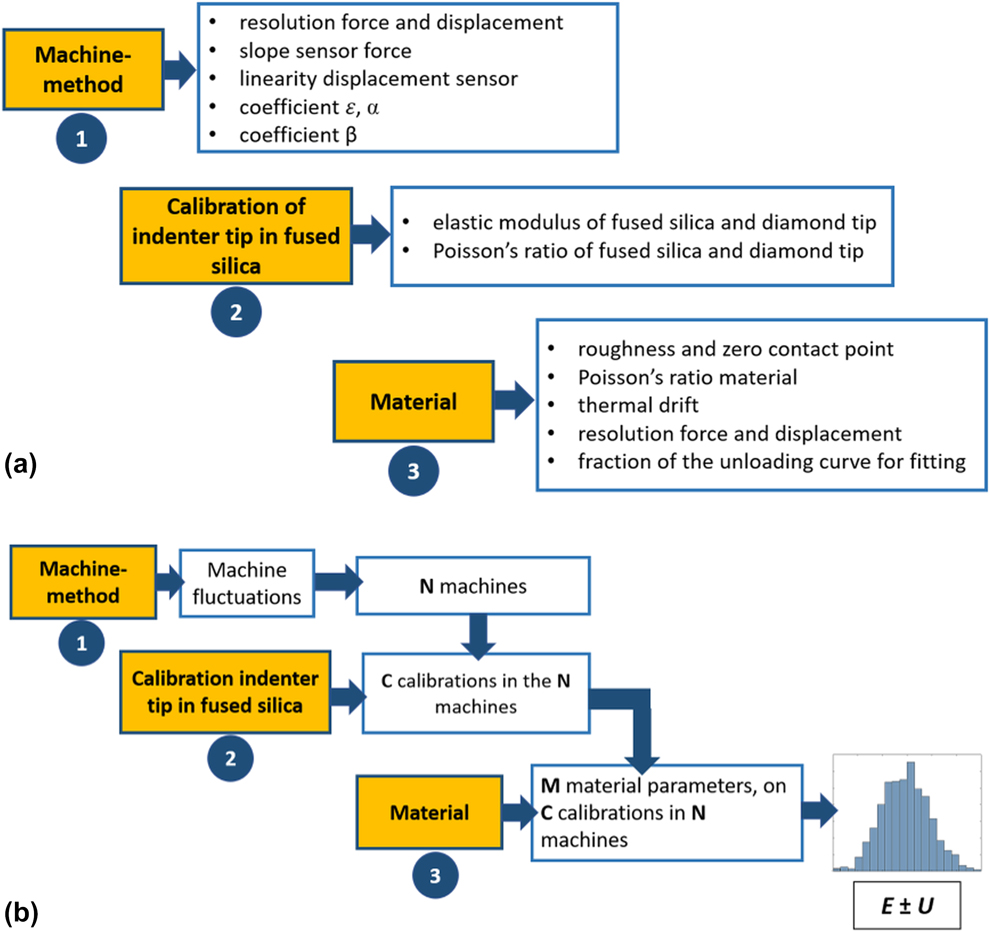
The method duplicates the physical sequence of a test. The process starts with a VM considering the parameters associated with it; this level is correlated with the reference material and the indenter to perform the calibration step. At this step, values related to the properties of the reference material and indenter are set up. Finally, a test run is carried out, corresponding to the material level [Fig. 3(a)]. This is a determinist process resulting in a single value estimation, which means that only one elastic modulus is obtained. This process includes regression calculations that are difficult to integrate into an analytical method.
Figure 3(a) shows a reclassification of the sources of uncertainty with respect to Table I, showing the uncertainties introduced at each level.
The uncertainties are introduced at each level. Once a value is random triggered at the level n (1, 2, or 3), this value is kept for the next levels; hence, the aim is to take into account the dependencies during the calculation process.
The mathematical model is based on the Monte Carlo method. Each stochastic parameter is modeled by a random variable according to Table I, following a rectangular, Gaussian, or asymmetrical distribution. The random draws from Monte Carlo simulations must be triggered as in the physical process. Therefore, this procedure cannot be done by the analytical method. For example, the uncertainty in the calibration of the force sensitivity error (Table I) affects the calibration step on fused silica and the elastic modulus calculation. This uncertainty modifies the shape of the force–displacement curve and consequently the unloading slope. This shape modification is not filtered by the least-squares approximation, because the uncertainty on the force sensitivity error has not the nature of a random noise over the force data.
The three-level process having N, C, M number of Monte Carlo trials [Fig. 3(b)] for machine-method, calibration, and material levels, respectively, starts creating a machine, which means that a random draw is performed with all the variables that characterize the metrological behavior of the machine. Then, on each machine among the N machines, C calibrations are completed. For each simulated machine and for each calibration, M simulated tests are generated, which correspond to the experimental process. Uncertainties at each level are considered according to Table I. At the end of the process, there are N × C × M estimations of the measurand (here the elastic modulus). In this method, covariances are taken into account without formulas but only with the link between the program structure and the physical reality.
Results
Application of the VM concept
The VM concept described was applied to experimental load–displacement curves obtained from classic nanoindentation tests, performed in fused silica and steel samples, to estimate the uncertainties on the elastic modulus calculation.
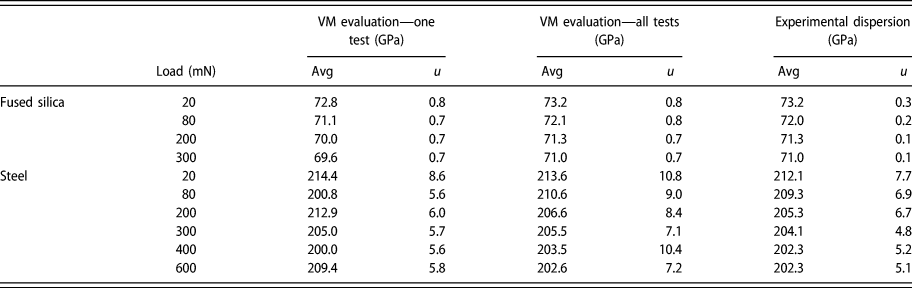
The uncertainties are estimated by the VM program using: (i) a single test for each maximum load (P max); (ii) all the tests for a given load. These results are then compared with the experimental dispersion. Sink-in was assigned as the main deformation mode for fused silica [Reference Oliver and Pharr21] and pileup for steel [Reference Kossman, Chicot and Iost50]. Table II summarizes the averages values of the elastic modulus with their related uncertainty for fused silica and steel. These results are obtained for N = 35, C = 20, and M = 10 Monte Carlo trials, which gives a population of 7000 curves for a single test evaluation, or 70,000 using all the tests for fused silica (10 tests) and 112,000 curves for steel (16 tests).
Uncertainties estimation of elastic modulus through VM evaluation and experimental dispersion for fused silica and steel samples. Avg is the average estimation and u is the standard uncertainty.
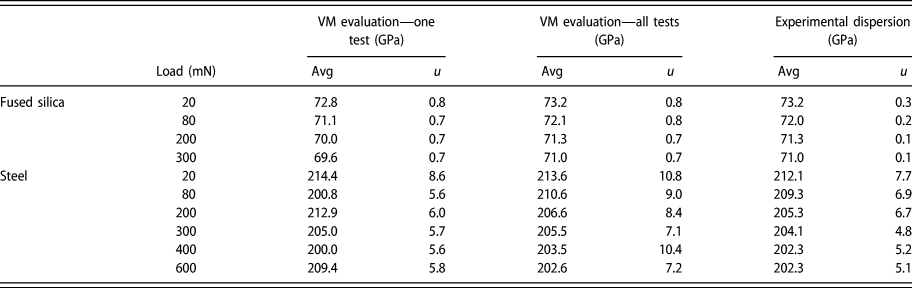
The VM evaluation is performed with one test and all the tests separately. The evaluation with one test determines the impact of all the sources of uncertainties in the estimation of the elastic modulus, while the experimental dispersion is supposed to be mainly related to the material heterogeneity. Moreover, the evaluation with all the tests represents an overestimation or upper bound of the total uncertainty, since it considers the experimental dispersion during the calculation and the sources related to it (surface roughness).
Results corresponding to the experimental dispersion were computed with the same code in Mathematica, setting to zero all the uncertainty sources, to apply an identical methodology, usually applied for nanoindentation tests. For this calculation, the parameters in the estimation column in Table I are fixed.
The contact area calculation for computing the elastic modulus was performed using the Oliver and Pharr function [Reference Oliver and Pharr20] with two coefficients. For the steel sample, the coefficients were restricted to positive values [Reference Oliver and Pharr20]. It should be noted that the number of coefficients used for the indenter area function does not have a significant impact on the evaluation of the uncertainties.
Uncertainties estimations through the VM evaluation considering a single test are higher than the experimental dispersion for fused silica sample, which corroborates the material homogeneity. These results reveal that considering only the experimental dispersion, the uncertainties are underestimated. Logically, uncertainty results obtained through the VM evaluation are similar regardless the testing load, since the assigned uncertainties are alike for all the testing loads. Only roughness uncertainty depends on the penetration depth (Table I). Due to the low surface roughness and material homogeneity, the VM evaluation performed with all the tests leads to similar uncertainties results compared with those obtained for a single test.
For the steel sample, the uncertainties estimated through a single test VM evaluation are similar to the experimental dispersion for all tests. The high experimental dispersion is related to the material heterogeneity (surface and microstructure). The VM calculations with all the tests give higher uncertainties values as expected, because the experimental dispersion is included in the evaluation, and also the surface roughness as an uncertainty source, which contributes to the dispersion, consequently its influence counts twice in the calculation. On the other hand, the total uncertainties estimated by VM evaluation with a single test can be underestimated since the microstructural material heterogeneity is not included in the uncertainties list (Table I), due to the difficulty modeling it.
The expanded uncertainty (U) obtained through the VM evaluation regardless the number of tests used for calculation represents about 2% for fused silica and 10% for steel of the average values. Besides, the elastic modulus estimations are within the same range of values for all the loads. These results are satisfactory for the fused silica evaluation according to the standard ISO 14577, which indicates that the error at the same testing load should be inferior to 5%. Nevertheless, this standard could be too severe regarding the actual experimentation. For example, different round robin studies (interlaboratory comparisons) presented errors up to 30% for elastic modulus, according to the selected analysis method, material, type of indenter, and machine [Reference Herrmann, Lucca, Klopfstein and Menelao6, Reference Kossman, Chicot and Iost50, Reference Cabibbo, Ricci, Cecchini, Rymuza, Sullivan, Dub and Cohen51, Reference Chudoba and Griepentrog52].
Sensitivity analysis (“one at time” methodology)
Sensitivity analysis provides a measure of the sensitivity of the different parameters, functions, or sub-models intervening in the model to identify those of greater importance. According to the GUM uncertainty guide, the contribution of an input quantity is obtained through sensitivity coefficients [5, 19]. Nevertheless, the methodology changes when Monte Carlo method is applied. In this case, the GUM supplement 1 indicates the evaluation called “one at time,” which means that each variable is evaluated individually through the proposed model, holding the other ones fixed at their best estimate, and performing a Monte Carlo simulation [Reference Harris and Cox53]. The relative importance S i of each source is given by the following expression [5, 19]:
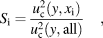 $${S_{\rm{i}}} = {{u_{\rm{c}}^2\left( {y,{x_{\rm{i}}}} \right)} \over {u_{\rm{c}}^2\left( {y,{\rm{all}}} \right)}}\quad ,$$
where u c(y, all) is the uncertainty obtained from the calculation considering all the sources of uncertainty and u c(y, x i) is the calculation with each source x i.
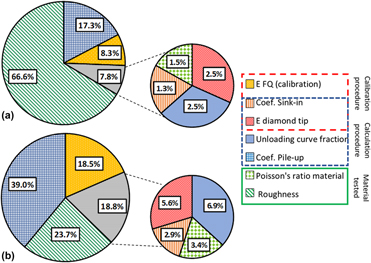
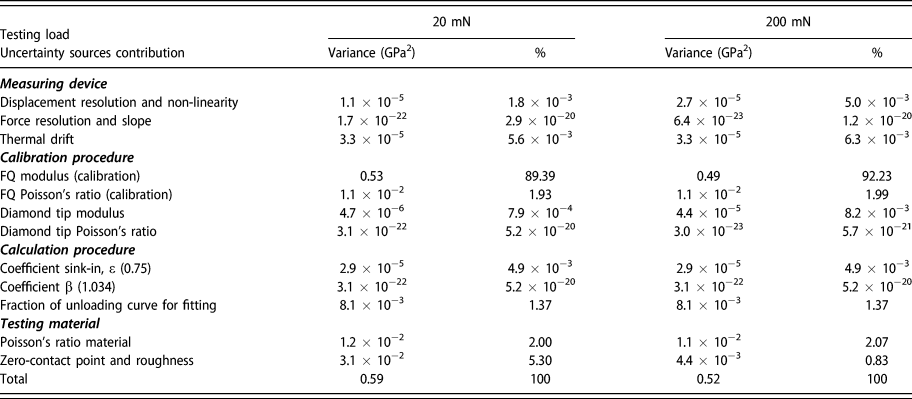
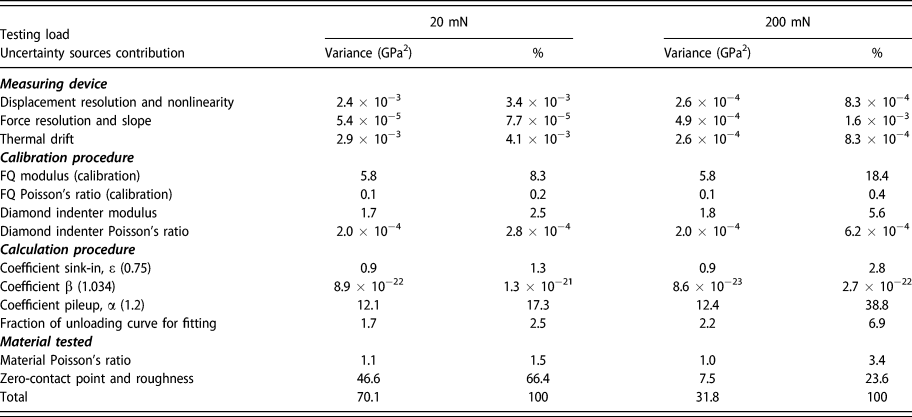
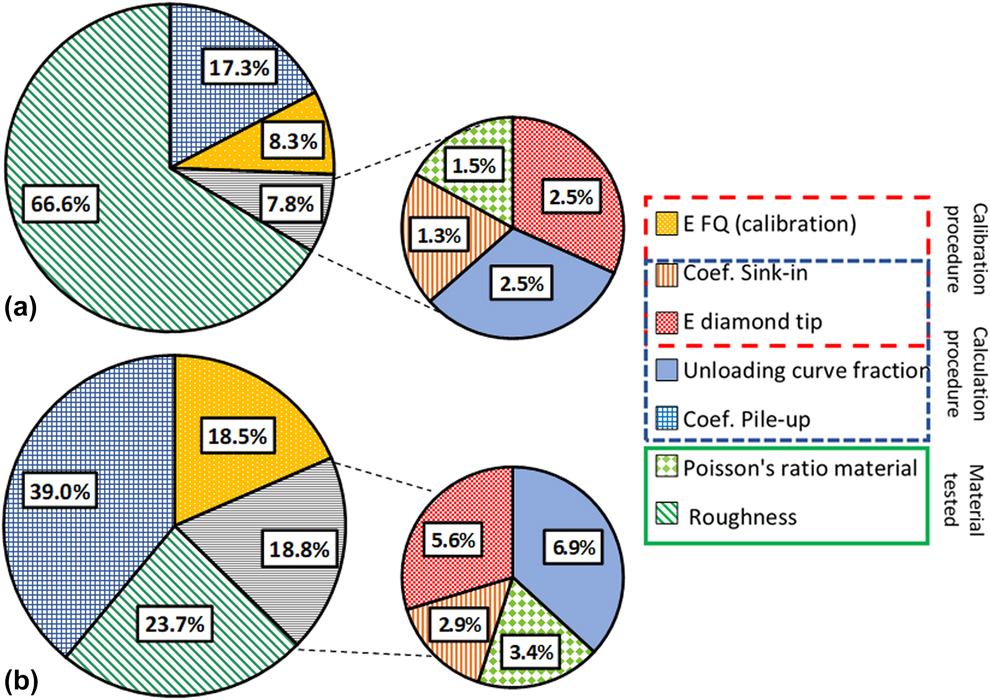
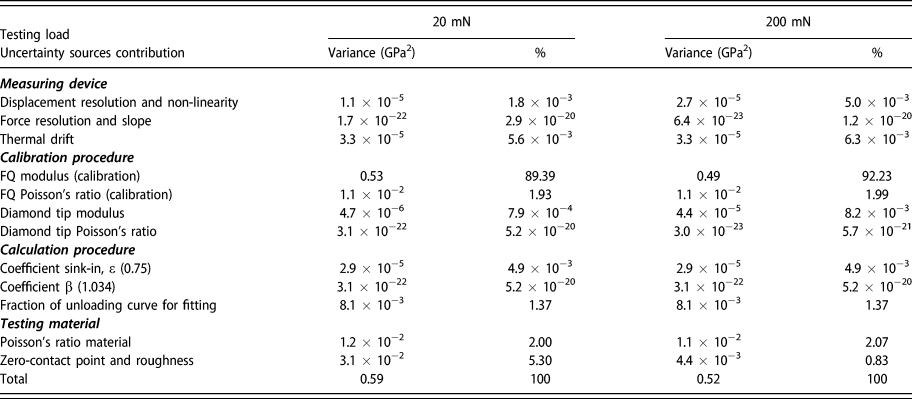
The sensitivity analysis was performed for both samples at two loads, 20 and 200 mN. The results are presented by pie charts in Fig. 4 for fused silica and in Fig. 5 for steel. Pie charts representation only shows the sources that contribute more than 0.5% to the total uncertainty, from the list of sources given in Table I. In addition, all the sources considered during the VM calculations are listed in Tables III and IV, including those with a contribution lower than 0.5%.
Sensitivity analysis of fused silica at (a) 20 mN and (b) 200 mN. Considering the relevant sources, with a contribution higher than 0.5% of the total uncertainty.
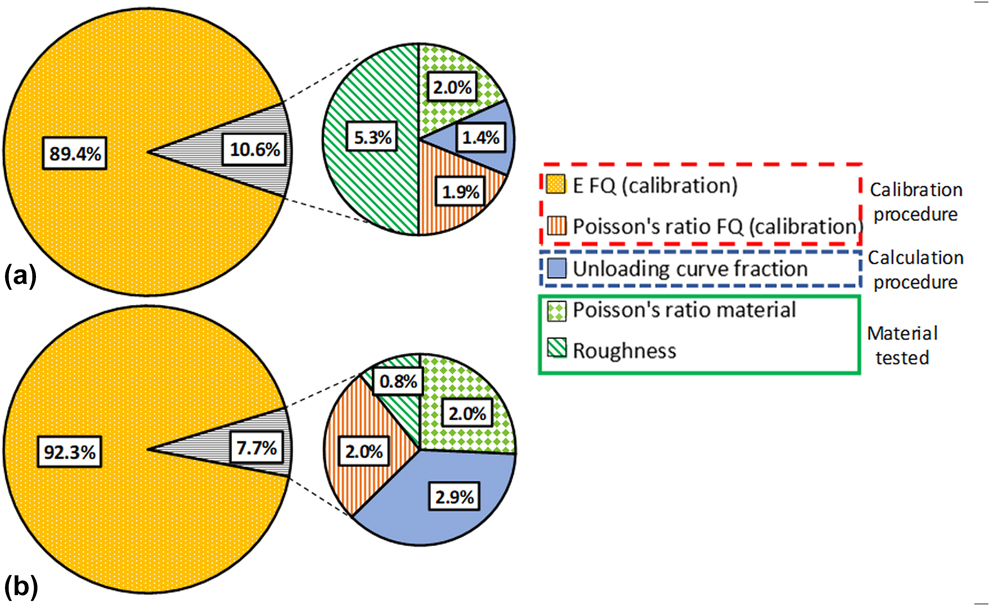
Sensitivity analysis of steel sample at (a) 20 mN and (b) 200 mN. Considering the relevant sources, with a contribution higher than 0.5% of the total uncertainty.
Results of sensitivity analysis obtained by the one at time method for fused silica sample.
Results of sensitivity analysis obtained by the one at time method for steel sample.
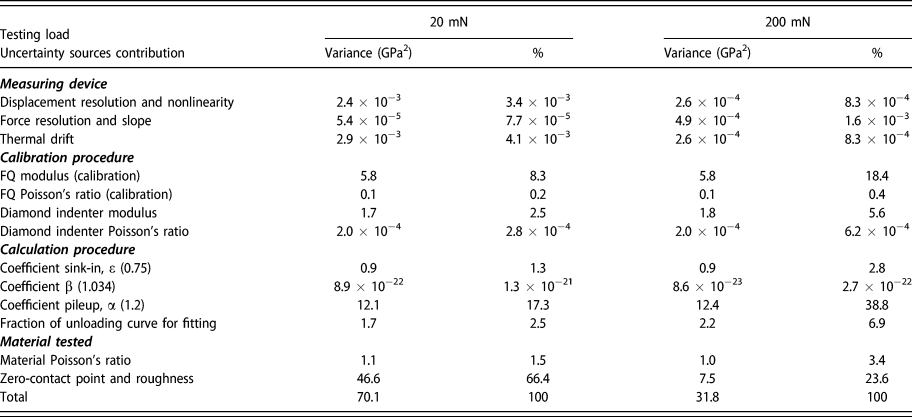
The uncertainty sources considered in this study are classified into different categories relative to (i) the measuring device, (ii) the calibration procedure, (iii) the methodology used to calculate the mechanical properties, and (iv) the tested material. However, some of them are involved at different steps in the elastic modulus calculation, e.g., the elastic modulus of the indenter.
Measuring device
The sensitivity analysis of the two materials revealed that the sources related to the instrument itself, specifically the force and displacement sensors are not relevant in the uncertainty estimation. Likewise, thermal drift, which is related to the instrument and materials, resulted in a negligible source.
Calibration procedure
The uncertainty sources associated with the calibration procedure have a significant effect on the total uncertainty. The sensitivity analysis of fused silica sample (Fig. 4) shows that the main source is the elastic modulus of fused silica used for the tip area function calibration, approximately 90% of the total uncertainty. The calibration elastic modulus is also relevant to the sensitivity analysis of steel (8% for 20 mN and 18% for 200 mN) (Fig. 5). However, it does not represent the predominant source as for fused silica (evaluated as a material), indicating that this uncertainty source is more critical for materials with properties similar to those of the calibration material. These results are appalling, since the tip indenter calibration is practically the basis of nanoindentation data analysis. Bamber et al. [Reference Bamber, Cooke, Mann and Derby54] mentioned that a 2% variation in the elastic modulus of the fused silica is adequate to calculate the area function. However, it has a significant effect at shallow depths. Nevertheless, the sensitivity analysis revealed that this parameter is relevant regardless the penetration depth. The uncertainty on the calibration elastic modulus affects the calculation of the tip area coefficients. Those are modified during the fitting of the tip area function, affecting the determination of the elastic modulus of the testing material. The area function might not accurately reflect the shape of the indenter at all depths for the elastic–plastic contact [Reference Bamber, Cooke, Mann and Derby54]. However, this procedure is typically used in nanoindentation.
It is worth mentioning that fused silica can undergo densification and cracking during indentation [Reference Gadelrab, Bonilla and Chiesa55, Reference Keryvin, Meng, Gicquel, Guin, Charleux, Sanglebœuf, Pilvin, Rouxel and Le Quilliec56]; this phenomenon is not usually considered in the nanoindentation data analysis, where as a general use, fused silica is presented as a homogeneous material for calibration. Hence, this assumption was used in our analysis to follow this typical practice. Gadelrab et al. [Reference Gadelrab, Bonilla and Chiesa55] concluded that tip area calibration produces an artificial area that considers fused silica properties, masking the details of the tip itself. Using this area in materials that deform differently could produce erroneous results. For better accuracy in the measurement of the tip geometry, AFM can be used, avoiding the necessity of a calibration material [Reference Herrmann, Jennett, Wegener, Meneve, Hasche and Seemann57]. However, the uncertainties of this instrument should be also considered. Consequently, it is important to consider the existing uncertainty related to the calibration process, which is related to the tip geometry and to the mechanical response of the material selected as reference.
It should be emphasized that the effect of the tip geometry is not represented as a direct source in the VM evaluation, since the tip area coefficients represent an intermediary calculation result, which is a consequence of the uncertainties related to physical sources. This obviously implies that the calculation of the area function is a correct mathematical representation of the tip geometry.
Furthermore, the Poisson’s ratio of fused silica used for calibrating is a minor source in the evaluation of fused silica considered as an unknown material, and it is a negligible source in the evaluation of elastic modulus of steel. However, this parameter intervenes in two steps in the calculation process of fused silica, leading to a separate effect on the total uncertainty.
Another parameter of the calibration procedure is the elastic modulus of the indenter, which is considered during the calibration step and at the final calculation of the material elastic modulus. This source has a greater impact on the uncertainty evaluation of the steel elastic modulus than that of fused silica, since steel has a modulus closer to that of diamond (a difference of one order of magnitude) and fused silica (a difference of two orders of magnitude).
Moreover, Poisson’s ratio of diamond tip does not represent a relevant source in both tested materials. Diamond tips used in nanoindentation are made of single crystal diamond, free of impurities or inclusions. Nevertheless, the mechanical properties reported in the literature are not identical and vary with the atomic crystal orientation (usually between 1050 and 1141 GPa) [40, Reference Klein41]. On the other hand, the details of the diamond tip are not commonly provided by the manufacturers; only the information regarding the geometry of the tip itself is given. Consequently, the uncertainty on the diamond tip properties is important to determine accurately the mechanical properties of the testing material. Its relative importance increases when the properties of the testing material are closer to those of diamond.
Calculation procedure
The sensitivity analysis revealed that the fraction of the unloading curve data used in the fit to compute the specimen stiffness, has a minor impact in the total uncertainty. Nevertheless, this effect is greater for materials like steel, because the unloading slope is steeper than that of fused silica, which shows greater elastic recovery. Hence, the Oliver and Pharr power law model [Reference Oliver and Pharr21] becomes more sensitive to the fraction of the unloading curve selected for calculation, as mentioned by Kossman et al. [Reference Kossman, Coorevits, Iost and Chicot58].
In addition, the coefficients used during this calculation step to estimate the contact depth are relevant for the steel sample. The pileup coefficient α represents 17% of the total uncertainty at P max = 20 mN and 39% at P max = 200 mN, being the main source at this load. This coefficient is related to the increase in contact area due to the pileup around the indent [Reference Loubet, Bauer, Tonck, Bec and Gauthier-Manuel44, Reference Bec, Tonck, Georges, Georges and Loubet45]. In the analysis of fused silica, the analogous coefficient ε for contact depth calculation when sink-in is the predominant deformation mode is not a relevant source. This result is explained by the fact that the related uncertainties of α and ε are multiplied by the factor h max − P/S and P/S, respectively; hence, P/S is always numerically smaller than h max − P/S (h max is the maximum displacement, P the load, and S the stiffness), leading to a smaller influence of ε in the calculations.
It is worth mentioning that in the evaluation of the steel sample, the coefficient ε used to calculate the contact depth during the calibration step with fused silica represents a minor source but not a negligible one like for fused silica studied as material.
The correction factor β = 1.034 intervenes in the calibration procedure; however, in the elastic modulus calculation, it does not significantly affect the total uncertainty. This parameter considers the radial material displacements in the region of contact [Reference Oliver and Pharr21].
Material tested
Regardless the tested material, uncertainty sources related to the material itself, such as roughness and Poisson’s ratio, are not negligible considering the total uncertainty.
The uncertainty on the Poisson’s ratio of the evaluated materials does not represent a relevant source of uncertainty for elastic modulus estimation, which is commonly mentioned in IIT. This statement agrees with the sensitivity analysis in both materials (2% for fused silica and 3.4% for steel), corresponding to an assigned uncertainty of 5%, which we consider as a realistic estimation according to the literature. However, Poisson’s ratios for fused silica and steel are easily found in the literature; nevertheless, for an unknown material having a Poisson’s ratio between the range of most of the materials (0–0.5), it is possible to introduce an uncertainty modelized by a rectangular law between 0 and 0.5, and in this case, the impact on the uncertainty of elastic modulus would be greater.
Roughness is a minor source in the evaluation of fused silica. Nevertheless, its effect is greater at P max = 20 mN, since at this load the assigned uncertainty is higher (0.1% h max, for h max < 1000 nm; Table I).
For the steel sample, roughness is a major source of uncertainty. At Pmax = 20 mN it represents the main source (∼67%). This result is not surprising; it is well known that surface roughness is a parameter that directly affects the experimental measurements in indentation [Reference Marteau and Bigerelle59, Reference Kim, Lee, Lee, Jang and Kwon60, Reference Laurent-Brocq, Béjanin and Champion61]. At P max = 200 mN, the roughness influence decrease to 24%, which is logic due to the initial definition in the VM program (2.5% h max for h max < 1000 nm and 1% h max for h max > 1000 nm). According to the standard ISO 1477-1 [47] to maintain the contribution of surface roughness to the uncertainty in indentation depth below 5%, the maximum displacement should be at least 20 times R a (30–70 nm), and the measurements at P max = 20 mN (h max ∼ 1000 nm) barely accomplish this requirement.
The results are similar regardless the load in fused silica. Nevertheless, for steel the sensitivity analysis changes according to the load, and the relevant sources are the same, but their contribution varies with the load.
The sensitivity analysis of the studied materials allowed to identify the predominant uncertainty sources. This work showed that the uncertainties are material dependent. The most relevant sources are related to the calibration procedure and testing material, emphasizing that these results are specific to this study, since the VM evaluation depends on the instrument, the measuring scale, the studied material, the analysis and the calculation method, and a precise definition of the measurand. Moreover, through the application of the VM concept, it is possible to obtain a more realistic probability interval among which is the measurand.
The identification of the calibration elastic modulus (fused silica) as a major source of uncertainty for both materials leads to an important reflection about the typical practices in nanoindentation.
It is important to create a sense of awareness in the community of users and manufacturers of indentation instruments to promote the traceability of the different elements that compose them. For example, it is necessary to have traceable certificates of the indenter tip and reference sample used for calibration, which are frequently very difficult to obtain. In addition, it is important to consider whenever possible to use other methods, such as AFM, to measure the tip geometry to obtain more accurate information, avoiding a material dependent calibration.
For materials showing pileup, the relevance of the coefficient α in the total uncertainty indicates that the evaluation of the contact area should be carefully performed. Divers methods have been proposed to consider pileup in the contact area [Reference Loubet, Bauer, Tonck, Bec and Gauthier-Manuel44, Reference Bec, Tonck, Georges, Georges and Loubet45, Reference Zhou, Jiang, Wang and Yu62, Reference Hay, Oliver, Bolshakov and Pharr63, Reference Bolshakov and Pharr64, Reference Lee, Hahn, Nahm, Jang and Kwon65]. Loubet et al. [Reference Loubet, Bauer, Tonck, Bec and Gauthier-Manuel44, Reference Bec, Tonck, Georges, Georges and Loubet45] consider the pileup coefficient α = 1.2, generally works well for the estimation of elastic modulus for materials showing pileup [Reference Kossman, Chicot and Iost50, Reference Yetna N’jock, Chicot, Ndjaka, Lesage, Decoopman, Roudet and Mejias66] and represents a simple methodology to compute the contact area. However, due to the relevance of this uncertainty source, it could be more convenient to measure the pileup by profilometry or AFM to reduce its uncertainty in the elastic modulus estimation.
The use of AFM could give more accurate results; however, it is more difficult to put into practice and it is time consuming. The calibration method using fused silica is practically mandatory in nanoindentation in great part due to the facility to perform it, because it is a process that should be performed regularly. So, it is hard to imagine that users would change this methodology. Nevertheless, what we want to emphasize is the importance of creating good practices in users and manufactures. In other words, it is necessary to have access to the characteristics and details of the studied system. Hence, this information would help in a better identification of the main sources of uncertainty. Being the ultimate purpose, to reduce the effect of these sources, whenever is possible, in order to obtain more reliable results.
Conclusions
The application of the VM concept to IIT must be adapted to each studied system: experimental device, analytical method, sample material, experimental conditions, and studied mechanical property (elastic modulus, hardness, plastic energy, etc.). Nevertheless, the overall approach is the same and is completely consistent with the documents JCGM 100 [5] and JCGM 101 [19]. The three level–based model allowed to stay as close as possible to the physics of the test and to consider the covariances, which may even introduce corrections to the uncertainty.
This work gives the first insides of the VM concept applied to IIT, and more researches on this field are necessary to apply this concept to the various experimental conditions. Ideally, it would be necessary to integrate this concept into the software of the indentation device to directly take into account the uncertainties on the investigated properties like in CMM. Although the phenomena during indentation testing are complex and material dependent, this approach makes possible to obtain more realistic uncertainties that to consider only the experimental dispersion in addition to identifying the main sources and possible systematic errors in the system.
The uncertainty evaluation through the VM concept is material dependent. The sensitivity analysis revealed that the main source of uncertainty in the study of fused silica considered as an unknown material is the elastic modulus of the reference material used for indenter tip calibration. For steel sample, three main sources of uncertainty were identified: surface roughness, pileup coefficient, and again elastic modulus of the reference material used for calibration. The expanded uncertainty over the estimated elastic modulus was 2% and 10% for fused silica and steel samples, respectively. Minor sources in both materials are related to the material Poisson’s ratio, the portion of the unloading curve used for the stiffness calculation, the elastic modulus of the diamond tip, and the coefficient ε (calibration); these last two were identified only for the steel sample. Negligible sources are related to the instrument (resolution, sensor linearity, force slope, thermal drift), constant β, and Poisson’s ratio of the diamond tip. It is worth mentioning that through the sensitivity analysis, the main uncertainty sources are recognized, and then the further analysis should be focused in reducing the effect of these sources in the measurand, knowing that these sources are specific to each conducted study.
It is necessary to create a sense of awareness in the community of users and manufacturers of instrumented indentation systems. In order to obtain accurate information on the indentation instrument, calibration procedure, and models used to compute the mechanical properties. Being the objetive to identify the relevant sources of uncertainty and to minimize measurement uncertainties on the required mechanical properties.
Instrument, materials, and experimental procedure
Instrument
The instrument selected for this work was the Nano Indenter® XP (MTS Systems Corporation, Tennessee). The nanoindenter is a load-controlled instrument, where the force is imposed by passing current through a coil in a circular magnet, which is directly proportional to the current. The force signal is calibrated at the factory by using standard weights. The maximum load is 600 mN and the contact force is <1 μN.
The displacement system consists of a three-plate (circular disks) capacitive arrangement. The two outside plates are fixed to the head and have holes at the center to accommodate the indenter shaft. The position of the indenter column is determined by the difference in voltage between the middle plate and either of the two outside plates. The displacement sensor is calibrated at the factory by laser interferometry. The plate-indenter assembly is supported by two leaf springs, with low stiffness in the vertical direction and high stiffness in the horizontal one [37]. The load frame stiffness is ∼5 × 10⁶ N/m [37].
The instrument is on a special table to isolate it from mechanical vibrations transmitted through the floor, and a surrounding isolated box protects it from acoustic waves. The system mounting consists of a sample tray and a clamping system. The positioning system allows the x–y movement. The test positions are selected using an integrated optical microscope and then the software drives the motion system and moves the sample under the indenter column.
Materials
The materials used for this study were fused silica and hypoeutectoid steel (S235JR, C < 0.17%). The fused silica sample was provided by MTS Systems Corporation; it is a homogeneous material with smooth surface finish of R a = 0.50 nm, where R a is the arithmetic average of the roughness profile. The steel sample was provided by Depery Dufour (Scionzier, France); its microstructure is constituted by ferrite grains and small fraction of pearlite.
The steel sample was polished using a semiautomatic polishing machine to achieve R a between 30 and 70 nm (evaluated through different measurements in the surface).
Tests
Single load–unload nanoindentation tests were performed at different maximum loads (P max) between 20 and 600 mN. The time for loading and unloading was 30 s (2P max N/min). The dwell time at maximum load was 15 s. The tests were repeated at least 10 times per load. The distance between tests was set to approximately 30 times the maximum penetration depth (h max).
Each sample is fixed to an aluminum sample holder with a mounting glue. Then, they are inserted into the sample tray and fixed by screws.
The tests were performed using a diamond Berkovich indenter from Synton-MDP (Port, Switzerland). The tip area function calibration is estimated by performing continuous stiffness measurement tests on fused silica according to the Oliver and Pharr fit [Reference Oliver and Pharr21]. The calibration was performed before each set of tests in the two materials. The testing parameters were h max 2000 nm, frequency 45 Hz, strain rate 0.05 s−1, harmonic displacement 2 nm, number of tests 9, and distance between tests 70 μm.
Analysis
The calculation steps to estimate the elastic modulus from a load–displacement curve adapted to the Nano Indenter® XP are listed below. The used data correspond to the load–displacement curves where the zero-contact point and the thermal drift were automatically corrected by the instrument software Testworks4 (MTS Systems Corporation, Tennessee).
(i) Calibration of the tip area function [Reference Oliver and Pharr21].
(ii) Load–displacement curve from classic tests
(a) Fitting of the unloading curve [Reference Kossman, Coorevits, Iost and Chicot58].
 $${h \over {{h_{\max }}}} = {{{h_{\rm{f}}}} \over {{h_{\max }}}} + G \times {\left( {{P \over {{P_{\max }}}}} \right)^n}\quad ,$$
where G, h f/h max, and n are fitting parameters obtained by least squares methods; P max and h max are the maximum load and displacement, respectively; and h is the displacement.
(b) Determination of the frame compliance (C f) for each batch of tests [Reference Oliver and Pharr21].
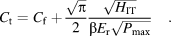 $${C_{\rm{t}}} = {C_{\rm{f}}} + {{\sqrt \pi } \over 2}{{\sqrt {{H_{{\rm{IT}}}}} } \over {\beta {E_{\rm{r}}}\sqrt {{P_{\max }}} }}\quad .$$
The total measured compliance C t is the sum of the frame compliance (C f) and the contact compliance linked to the material response [second term in Eq. (3)], assuming that the reduced elastic modulus (E r) and hardness (H IT) do not change with load. The frame compliance is determined as the intercept of the straight line with the ordinate axis. The higher loads are used for the calculation.
(c) Correction of the displacement data with the frame compliance [Reference Oliver and Pharr21].
 $${h_{\rm{i}}}^{\rm{c}} = {h_{\rm{i}}} - {C_{\rm{f}}}{P_{\rm{i}}}\quad .$$
(d) Calculation of the contact area A c according to the deformation mode: for fused silica sink-in [Reference Oliver and Pharr21] and for steel pileup [Reference Loubet, Bauer, Tonck, Bec and Gauthier-Manuel44, Reference Bec, Tonck, Georges, Georges and Loubet45].
 $${A_{\rm{c}}} = C{h_{\rm{c}}}^2 + {C_1}{h_{\rm{c}}}^1 + {C_2}{h_{\rm{c}}}^{1/2} + {C_3}{h_{\rm{c}}}^{1/4} + \cdots + {C_8}{h_{\rm{c}}}^{1{\rm{/}}128}\quad ,$$
where C n is fitting constant and h c is the contact depth given by the following relations:
 $${h_{{c_{{\rm{sink}}}} - {\rm{in}}}} = {h_{\max }} - \varepsilon {{{P_{\max }}} \over S}\quad ,$$
 $${h_{{c_{{\rm{pile}}}} - {\rm{up}}}} = \alpha \left( {{h_{\max }} - {{{P_{\max }}} \over S}} \right)\quad .$$
(e) Calculation of elastic modulus with the corrected load–displacement data [Reference Oliver and Pharr21].
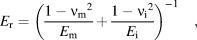 $${E_{\rm{r}}} = {\left( {{{1 - {\nu _{\rm{m}}}^2} \over {{E_{\rm{m}}}}} + {{1 - {\nu _{\rm{i}}}^2} \over {{E_{\rm{i}}}}}} \right)^{ - 1}}\quad ,$$
where E m, νm and E i, νi are the elastic modulus and Poisson’s ratio of the material and indenter, respectively. For fused silica, E m = 72 GPa and νm = 0.17; for the diamond tip, E i = 1140 GPa and νi = 0.07. For the calibration procedure, the elastic modulus of fused silica is considered as a fixed value.
Supplementary material
The linearity of the displacement sensor and asymmetrical, normal, and uniform distributions are explained in the supplementary material of this article.
To view supplementary material for this article, please visit https://doi.org/10.1557/jmr.2019.203.