INTRODUCTION
Since 1996, when genetically modified (GM) crops were first commercially cultivated, the global area under GM crops has increased dramatically. The growth rate has been 12%/year and the area of GM crops under cultivation reached 800 million ha in 2008, c. 74 times that in 1996. By 2008, there were 25 countries growing GM crops, with 17 of these growing GM maize. In 2008, when the GM crop area reached 800 million ha, GM maize covered 0·3 of that (373 million ha). To meet the increasing market demands of GM maize for ethanol, the area under GM maize has increased by about 40% in recent years (James Reference James2008).
Numerous studies on pollen-mediated gene flow in the USA and European countries have been reported. The Communities of the European Commission define the maximum proportion for the adventitious presence of genetically modified organisms (GMOs) in conventional food and fodder crops as 0·009 (EU 2003). China, which is the world's second largest maize producer, generally grows about 24 million ha annually, but has not yet begun to produce GM commercially. On 27 November 2009, phytate maize was granted a transgenic biosafety certificate by the Chinese Ministry of Agriculture. It is anticipated that China, one of the largest maize producing countries, will plant transgenic maize in the near future (James Reference James2009).
Maize is a wind-pollinated, highly hybridized species. Although maize pollen is relatively large among anemophilous species (Eastham & Sweet Reference Eastham and Sweet2002), and easily dispersed (Raynor et al. Reference Raynor, Ogden and Hayes1972; Di-Giovanni et al. Reference Di-Giovanni, Kevan and Nasr1995; Aylor Reference Aylor2002), numerous studies have shown that cross-pollination is inevitable under suitable meteorological conditions (Treu & Emberlin Reference Treu and Emberlin2000; Devos et al. Reference Devos, Reheul and De Schrijver2005). As a wind-pollinated species, gene flow in maize is mediated mainly by pollen transfer; thus, it is often assessed by monitoring the out-crossing rate from the pollen source to the recipient. Strategies for controlling pollen-mediated gene flow in transgenic maize include physical barrier systems and biological barrier systems. The physical barrier system comprises temporal and/or spatial separation to control the dispersal of pollen.
The frequency of gene flow is determined by the isolation distance between the pollen source and the recipient, flowering synchrony, the ability of the maize to shed pollen, pollen viability, the size, shape and orientation of the donor plot in relation to the receptor plot and climatic conditions such as wind intensity and direction, amount of rainfall and humidity (Devos et al. Reference Devos, Reheul and De Schrijver2005; Porta et al. Reference Porta, Ederle, Bucchini, Prandi, Verderio and Pozzi2008). The most important factors that influence the frequency of gene flow are the isolation distance and the synchrony of anthesis and silking (Bassetti & Westgate Reference Bassetti and Westgate1994; Bock et al. Reference Bock, Lheureux, Libeau-Dulos, Nilsagard and Rodriguez-cerezo2002; Uribelarrea et al. Reference Uribelarrea, Carcova, Otegui and Westgate2002; Westgate et al. Reference Westgate, Lizaso and Batchelor2003; Messeguer et al. Reference Messeguer, Penas, Ballester, Bas, Serra, Salvia, Palaudelmas and Mele2006; Angevin et al. Reference Angevin, Klein, Choimet, Gauffreteau, Lavigne, Messean and Meynard2008; Bannert et al. Reference Bannert, Vogler and Stamp2008; Palaudelmàs et al. Reference Palaudelmàs, Melé, Peñas, Pla, Nadal, Serra, Salvia and Messeguer2008; Beckie & Hall Reference Beckie and Hall2008). Since so many factors may influence the frequency of gene flow, researchers working under different environmental conditions have reported different results (Emberlin et al. Reference Emberlin, Adams-Groom and Tidmarsh1999; Eastham & Sweet Reference Eastham and Sweet2002; Stevens et al. Reference Stevens, Berberich, Sheckell, Wiltse, Halsey, Horak and Dunn2004; Goggi et al. Reference Goggi, Caragea, Lopez-Sanchez, Westgate, Arritt and Clark2006). For example, Emberlin et al. (Reference Emberlin, Adams-Groom and Tidmarsh1999) reported that an isolation distance of 60 m resulted in a 0·019 rate of cross pollination, whereas another study showed that the gene flow frequency was less than 0·001 at 18 m (Simpson et al. Reference Simpson, Norris, Law, Thomas, Sweet and Lutman1999). Goggi et al. (Reference Goggi, Caragea, Lopez-Sanchez, Westgate, Arritt and Clark2006) reported that the gene flow frequency was <0·001 at an isolation distance of 100 m, while Bannert et al. (Reference Bannert, Vogler and Stamp2008) showed that for fields smaller than 2 ha, the distance between the pollen source and the recipient had no effect on the cross-pollination within 20 m, but flowering synchronization was a significant factor.
In China, the Ministry of Agriculture has declared that the isolation distance should not be less than 300 m and the temporal isolation should not be less than 25 days for prevention of transgenic gene flow (Wei & Ma Reference Wei and Ma2002).
Although the results of the previous studies on gene flow in transgenic maize are useful, caution must be exercised when drawing conclusions from studies conducted under different conditions (Luna et al. Reference Luna, Figueroa, Baltazar, Gomez, Townsend and Schoper2001; Aylor Reference Aylor2004). To date, there have been no reports about the effect of spatial or temporal separation on the gene flow frequency in China, especially in the Huang-huai-hai region. More studies are needed to determine the extent to which the available information could be applied to local situations. Thus, these field experiments were conducted in Jinan in 2006 and 2007 to examine gene flow under different temporal and spatial separation conditions in the Huang-huai-hai region, to provide information for defining related regulations and to improve the production of transgenic maize.
MATERIALS AND METHODS
Plant materials
In the present study, the transgenic maize (Zea mays L.) Qi-319-als was used as the pollen source and the inbred line Qi-319 as the pollen recipient.
Transgenic maize Qi-319-als was obtained by transferring the herbicide resistance gene als into the embryonic calli of inbred line Qi-319 through microprojectile bombardment. Seedlings were regenerated from the transformed calli and selected with the herbicide chlorsulphuron (as product Lvhuanglong, Shenyang Pesticide Factory, containing 250 g a.i./kg chlorsulphuron). The stable and homozygous transgenic maize strain used in the present study was produced through four generations of self-pollination, and these plants grew and developed normally. The transgenic plants were homozygous for the als resistant gene, which was stable in these lines. The herbicide-resistant transgenic plants grew normally with 20 mg/l Lvhuanglong and could continue to grow with 30 mg/l Lvhuanglong. In contrast, the non-transgenic control plants had no resistance to 30 mg/l Lvhuanglong (Li et al. Reference Li, Yang, Zhang, Bi and Shan2001).
Acetolactate synthase (ALS) is the key enzyme in the biosynthetic pathway of branched chain amino acids and is also the target of sulphonylurea herbicide. The mutation of a specific base in als (197th proline was converted to valine) in Arabidopsis thaliana resulted in a herbicide-resistant plant (Mazur et al. Reference Mazur, Chui and Smith1987; Li et al. Reference Li, Zhang, Zhang, Bi and Shan2002).
Experimental site conditions
Field experiments were conducted in Dongquanlu village, Zhonggong, Jinan (36°40′N; 117°00′E) in the growing seasons of 2006 and 2007. Jinan has a temperate monsoon climate. The weather is usually hot and rainy in July and August. In summer, the prevailing wind direction is generally from the south. The annual average temperature is 13–14°C and the annual average rainfall is 650–700 mm. Field management, involving weed and pest control and field irrigation, followed normal production and cultivation practices for this region as explained by Luna et al. (Reference Luna, Figueroa, Baltazar, Gomez, Townsend and Schoper2001). Soil samples (0–300 mm) were taken from experimental sites before planting each year to determine soil nutrient status and general properties to ensure adequate fertilizer applications. Adequate nitrogen (N), phosphorus (P) and potassium (K) were applied during the land preparation according to the soil test recommendations. Fertilizer was applied at 150 kg N/ha (urea), 75 kg P/ha (calcium superphosphate) and 20 kg K/ha (KCl) and incorporated into the soil before planting at each site. Wind intensities and directions were monitored hourly with a wind speed meter from 07.00 to 19.00 h.
Experimental field design
Measuring the effects of distance on the frequency of gene flow
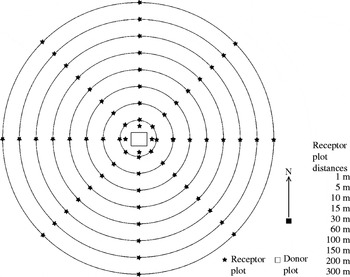
A field of c. 36 ha (600×600 m) was used in this experiment. The field was flat with no buildings or trees surrounding it. The pollen source, Qi-319-als, was planted in a 0·25 ha (50×50 m) plot in the centre of the field, termed the donor plot. The non-transgenic pollen recipient was planted at distances of 1, 5, 10, 15, 30, 60, 100, 150, 200 and 300 m away from the donor plot in eight directions (north, south, east, west, northeast, northwest, southeast and southwest), termed the receptor plot. That is to say, there were eight receptor plots at each isolation distance surrounding the donor plot. Each receptor plot was 15 m2 (3×5 m; Fig. 1), with the short axis oriented radially from the centre donor plot. Maize was planted in the donor and receptor plots at a density of 66 000 plants/ha with row spacing of 0·60 m and plant spacing of 0·25 m in all plots. Soybean (cvar Ludou No. 5) was planted in the field when the maize plants reached the five-leaf stage. The plant height of mature Ludou No. 5 did not exceed 0·50 m. The ears from all maize plants were harvested manually when mature and saved for als gene analysis. Details of the locations where the ears were harvested were recorded.
Field experiment designed for detection of gene flow frequencies at different isolation distances in Dongquanlu, Zhonggong, Jinan. □, donor plots of transgenic maize Qi-319-als; ★, receptor plots of non-transgenic maize Qi-319. The concentric circles represent isolation distances away from the donor plot.

Measuring the effects of planting time on the gene flow frequency
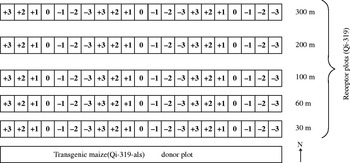
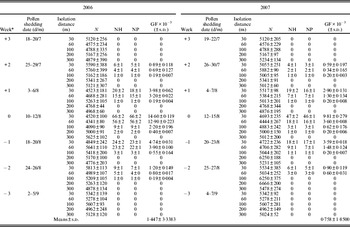
The size of the field in this experiment was c. 4 ha (105×350 m). A donor plot (5×10⁵ m, 0·053 ha), located at the southern end of the experimental field, was planted with the pollen source Qi-319-als in 2006 and 2007. The non-transgenic pollen recipient was planted in receptor plots at 30, 60, 100, 200 and 300 m north of the donor plot. Three replications of receptor plots were planted at each distance and at weekly intervals from 3 weeks before the donor plot (+3, +2 and +1) to 3 weeks after the donor plot (−1, −2 and −3, see Fig. 2). The transgenic maize seeds in the donor plot were sown on 13 June. The size of each receptor plot was 15 m2 (3×5 m). Maize was planted in the donor and receptor plots at a density of 66000 plants/ha with row spacing of 0·60 m and plant spacing of 0·25 m in all plots. Soybean (cvar Ludou No. 5) was planted in between the maize plots when the maize reached the five-leaf stage. The dates when the maize pollen was shed were recorded for all plots with different sowing dates. Maize ears from all plants were harvested manually and stored for analysis. The distances from the harvested ears to the donor plot and the sowing dates were recorded in detail.
Field design for temporal separation experiments in Dongquanlu, Zhonggong, Jinan. The donor plot was located at the southern end of the experimental field and planted with the transgenic maize Qi-319-als. Non-transgenic maize Qi-319 as pollen recipient was planted at 30, 60, 100, 200 and 300 m distances north of the donor plot termed receptor plot. Three replications of receptor plots were planted at each distance and each planting date (+3 to −3) from the donor plot.

Detection of gene flow
Herbicide resistance analysis
Ten ears were harvested randomly from receptor plots 1–60 m away from the donor plot, while 20 ears were harvested from the plots 100–300 m away from the donor plot. Seeds were sown and the non-transgenic maize Qi-319 was planted as a control. At the 3-leaf stage, the maize seedlings were treated with 30 mg/l of the herbicide Lvhuanglong (Li et al. Reference Li, Yang, Zhang, Bi and Shan2001). The number of seedlings surviving 14 days later for each receptor plot was recorded.
Molecular analysis
DNA was extracted from the leaves of the herbicide-resistant maize plants using the cetyltrimethyl ammonium bromide (CTAB) protocol (Permingeat et al. Reference Permingeat, Romagnoli and Vallejos1998) with the addition of 20 g/litre polyvinylpyrrolidone (PVP) in the extraction buffer. Polymerase chain reactions (PCRs) were conducted in a total volume of 25 μl containing 50 ng of template DNA, 10 mm Tris–Cl pH 8·3, 50 mm KCl, 1·5 mm MgCl2, 0·25 mm dNTP, 0·5 μm forward and reverse primers and 1 unit Taq DNA polymerase (Takara, Dalian, China). Primers of 5′>ACAGGACAAGTCTCTCGTCG<3′ and 5′>GGGTTAGCAACAGACGCTC<3′ were used to amplify an 1100-bp fragment from the als gene. The PCR reaction conditions were: DNA denaturation for 5 min at 95°C followed by 34 amplification cycles (95°C, 1 min; 58°C, 1 min; 72°C, 1 min 10 s) and a final extension step at 72°C for 7 min. The PCR products were analysed by electrophoresis in agarose gels (10 g agarose/litre) stained with ethidium bromide.
The frequency of pollen-mediated gene flow in transgenic maize was calculated as GF=NH×NP/(NHP×N), where GF is the gene flow frequency; NH is the number of herbicide-resistant seedlings; NHP is the number of seedlings analysed by PCR; NP is the number of PCR-positive seedlings and N is the number of seedlings used for detection.
The data were analysed using one-way analysis of variance in SPSS version 16.0.
RESULTS
Herbicide resistance and molecular analysis
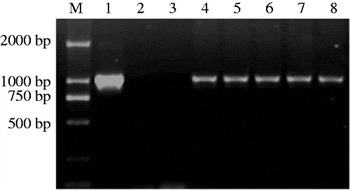
Under the selection pressure of 30 mg/l herbicide Lvhuanglong, the leaves of the seedlings turned yellow and withered after 14 days. The number of surviving seedlings (that were presumed to contain the exogenous gene als) was recorded and PCR analysis was carried out to confirm the presence of the gene in the herbicide-resistant seedlings. Sixty herbicide-resistant plants from the receptor plots at 1, 5, 10 and 15 m were sampled randomly and screened by PCR. All the herbicide-resistant plants from the receptor plots at 30, 60, 100, 150, 200 and 300 m, and the herbicide-resistant seedlings from the temporal separation trial, were screened by PCR. Molecular analysis indicated that the als gene had been integrated into the genomes of maize showing herbicide resistance in receptor plots (Fig. 3).
PCR analysis of herbicide-resistant seedlings. M, marker DL2000; 1, plasmid; 2, water; 3, non-transgenic plants (Qi-319); 4–8: herbicide-resistant plants.

Effects of distance on the frequency of gene flow
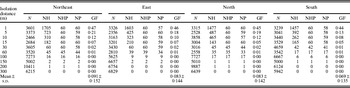
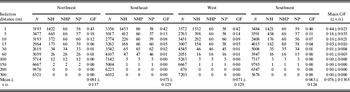
Combination analysis of the results from the PCR and the herbicide screening indicated that there were differences in the frequencies of pollen-mediated gene flow between the plots located at different distances and directions. The frequency of gene flow decreased markedly with increasing distance. In 2006, at the isolation distance of 1 m, the gene flow frequencies in eight directions ranged from 0·40 to 0·47 and decreased from 0·11 to 0·21 at 5 m. The gene flow frequency was <0·0001 at a distance of 200 m and no gene flow occurred at 300 m (Tables 1 and 2).
Gene flow frequencies of maize at different isolation distances in four directions in 2006

N, no. of maize seedling for test; NH, no. of herbicide-resistant seedlings; NHP, no. of herbicide-resistant seedlings for PCR analysis; NP, no. of PCR positive seedlings; GF, gene flow frequency.
Note: Sixty herbicide-resistant plants from the receptor plots at 1, 5, 10 and 15 m were sampled randomly and validated by PCR. All the herbicide-resistant plants from the receptor plots at 30, 60, 100, 150, 200 and 300 m were validated by PCR. GF=NH×NP/(N×NHP). During the peak pollen shedding period, there was no rain and the wind direction was mainly southwest.
Gene flow frequencies of maize at different isolation distances in four directions in 2006

N, no. of maize seedling for test; NH, no. of herbicide-resistant seedlings; NHP, no. of herbicide-resistant seedlings for PCR analysis; NP, no. of PCR positive seedlings; GF, gene flow frequency.
Note: Sixty herbicide-resistant plants from the receptor plots at 1, 5, 10 and 15 m were sampled randomly and validated by PCR. All the herbicide-resistant plants from the receptor plots at 30, 60, 100, 150, 200 and 300 m were validated by PCR. GF=NH×NP/(N×NHP).
During the peak pollen shedding period, there was no rain and the wind direction was mainly southwest.
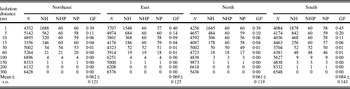
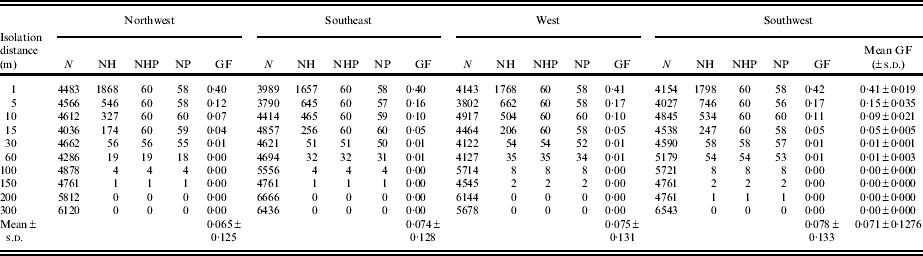
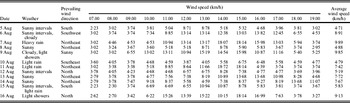
In 2007, gene flow frequency in eight directions ranged from 0·38 to 0·44 at an isolation distance of 1 m and from 0·10 to 0·20 at 5 m. The gene flow frequency was <0·0002 at 200 m and no gene flow occurred at 300 m (Tables 3 and 4). The average gene flow frequency for 2007 was lower than that of 2006 at equal distances. This could be due to differences in wind speed during these 2 years, and the absence of rain during the peak pollen shedding period. The average wind speed during the 3 days of peak pollen shed was 6·9 and 8·5 km/h for 2007 and 2006, respectively (Tables 5 and 6).
Gene flow frequencies of maize at different isolation distances in four directions in 2007

N, no. of maize seedling for test; NH, no. of herbicide-resistant seedlings; NHP, no. of herbicide-resistant seedlings for PCR analysis; NP, no. of PCR positive seedlings; GF, gene flow frequency.
Note: Sixty herbicide-resistant plants from the receptor plots at 1, 5, 10 and 15 m were sampled randomly and validated by PCR. All the herbicide-resistant plants from the receptor plots at 30, 60, 100, 150, 200 and 300 m were validated by PCR. GF=NH×NP/(N×NHP). During the peak pollen shedding period, there was no rain and the wind direction was mainly northeast.
Gene flow frequencies of maize at different isolation distances in the other four directions in 2007
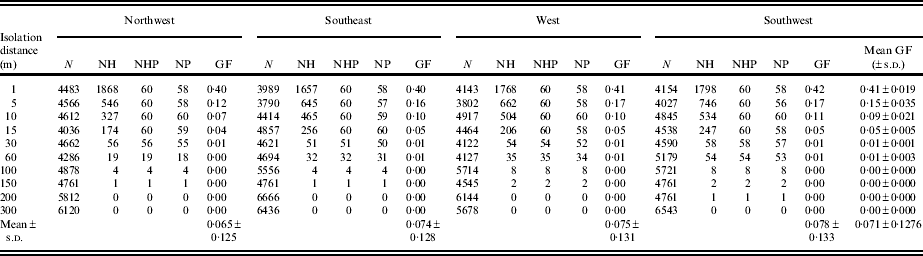
N, no. of maize seedling for test; NH, no. of herbicide-resistant seedlings; NHP, no. of herbicide-resistant seedlings for PCR analysis; NP, no. of PCR positive seedlings; GF, gene flow frequency.
Note: Sixty herbicide-resistant plants from the receptor plots at 1, 5, 10 and 15 m were sampled randomly and validated by PCR. All the herbicide-resistant plants from the receptor plots at 30, 60, 100, 150, 200 and 300 m were validated by PCR. GF=NH×NP/(N×NHP). During the peak pollen shedding period, there was no rain and the wind direction was mainly northeast.
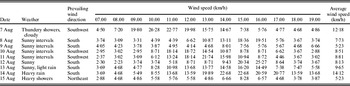
Weather, dominant wind direction and wind speed from 7 to 15 August 2006 in Jinan, China

Pollen production began on 8 August 2006, and the peak pollen shedding was from 10 to 12 August. Wind speed was monitored hourly from 07.00 to 19.00 h and the main wind direction and wind speed were recorded.
Weather, dominant wind direction and wind speed from 5 to 16 August 2007 in Jinan, China

Pollen production began on 10 August and the peak pollen shedding was from 12 to 14 August. Wind speed was monitored hourly from 07.00 to 19.00 h and the main wind direction and wind speed were recorded.
After release from the anther, most of the pollen fell near the donor plot in all directions due to gravity (Pleasants et al. Reference Pleasants, Hellmich, Dively, Sears, Stanley-Horn, Mattila, Foster, Clark and Jones2001; Halsey et al. Reference Halsey, Remund, Davis, Qualls, Eppard and Berberich2005). With increasing isolation distance, the effects of wind on gene flow were more pronounced. In 2006, no significant differences were observed at 1 m among the gene flow frequencies in eight directions. At 5 m, the northeast (NE) plot had the highest (0·21) frequency, while the southwest (SW) plot had the lowest (0·11). The frequency of the NE plot was 1·84 times that of SW plot. At 60 m, the frequency of NE plot was 3·29 times that of SW plot. These differences in gene flow frequencies in different directions were closely related to the wind direction, especially during the pollen shedding period. Maize pollen production began on 8 August and peak pollen shed occurred from 10 to 12 August. According to the meteorological records, the average wind speed was 8·5, 8·8 and 8·1 km/h on 10, 11 and 12 August, respectively. The wind speed during most of the period from 09.00 to 14.00 h on 10–12 August was 6·6–13·0 km/h, and the dominant wind direction was from southwest (Table 5). Thus, this was consistent with the result that the gene flow frequencies were higher in the NE plots. In 2007, pollen shed began on 10 August and the peak pollen shed was from 12 to 14 August. Meteorological records from 2007 showed that average wind speed was 5·2, 7·7 and 7·3 km/h on 12, 13 and 14 August, respectively. The wind speed during most of the period from 09.00 to 14.00 h on 12–14 August was 5·9–7·1 km/h, and the wind direction was mainly from the northeast (Table 6). Thus, there were differences in wind direction between 2006 and 2007. In 2006, gene flow frequency was highest in the NE plots and lowest in the SW plots, while in 2007, the gene flow frequency was highest in southern plots and lowest in northern plots.
Effects of planting time on the frequency of gene flow
Planting was done on a weekly basis with the receptor plots planted 1, 2 or 3 weeks earlier or later than the donor plots. The time of planting had a significant effect on the frequency of gene flow. With the same planting date (0 week), the gene flow frequencies were 0·015, 0·013, 0·002 and 0·0004 at the isolation distances of 30, 60, 100 and 200 m, respectively (Table 7). With the same distance, the frequency of gene flow was higher in the receptor plots that were planted at the same time as the donor plots (full synchrony) than that sown at different times (temporal separation). The gene flow frequency was reduced to about 70% of full synchrony at the same distance when the receptor plots were planted 1 week before or after the donor plot. In contrast, when the receptor plots were planted 2 weeks before or after the donor plot, there was almost no overlap of silking and pollen shed, and the gene flow frequency decreased to c. 0·0009–0·0012 at 30 m, which was equal to the frequency at an isolation distance of 200 m with the same planting time as the donor plot. When the planting dates were separated by 3 weeks, there was no overlap of silking and pollen shedding, and the gene flow frequency tended to be zero. In general, the trends of gene flow frequencies in 2007 were consistent with those in 2006, except for a slight reduction of the gene flow frequencies in the receptor plots with same management in 2007.
Effect of planting time on gene flow frequency in maize

N, no. of maize seedling for test; NH, no. of herbicide-resistant seedlings; NP, no. of PCR positive seedlings; GF, gene flow frequency (=NP/N).
* 0,+1, +2, +3: the receptor plot was planted 0, 1, 2 and 3 weeks, respectively, before the donor plot; −1, −2, −3=delay of 1, 2, or 3 weeks between sowing the receptor and donor plots.
DISCUSSION
Distance separation has been demonstrated to be one of the most effective strategies for minimizing pollen-mediated gene flow in maize (Ingram Reference Ingram2000; Luna et al. Reference Luna, Figueroa, Baltazar, Gomez, Townsend and Schoper2001; Uribelarrea et al. Reference Uribelarrea, Carcova, Otegui and Westgate2002; Westgate et al. Reference Westgate, Lizaso and Batchelor2003; Anderson et al. Reference Anderson, Lauer, Schoper and Shibles2004). Based on studies in recent years (Luna et al. Reference Luna, Figueroa, Baltazar, Gomez, Townsend and Schoper2001; Ma et al. Reference Ma, Subedi and Reid2004; Goggi et al. Reference Goggi, Lopez-Sanchez, Caragea, Westgate, Arritt and Clark2007), it can be concluded that gene flow frequencies can be as low as 0·0001 at 200 m from the pollen source. The results in the present study show that the frequency of gene flow was c. 0·40 at a separation distance of 1 m and decreased to <0·002 at a distance of 100 m. When the separation distance was 200 m, only low levels of gene flow frequency (c. 0·0002) were detected downwind. No gene flow occurrence was detected at 300 m distance.
Disruption of flowering synchrony (usually called temporal separation) is a well-established mechanism for genetic isolation in maize. The planting date had an important impact on the frequency of gene flow by controlling anthesis-silking synchrony. Synchronization of pollen shedding by the donor maize plants and silking by the receptor plants is necessary for high rates of out-crossing (Bock et al. Reference Bock, Lheureux, Libeau-Dulos, Nilsagard and Rodriguez-cerezo2002; Westgate et al. Reference Westgate, Lizaso and Batchelor2003). The results of the present study indicate that for the same distance from the donor plot, the gene flow frequencies were highest in those plots that were planted on the same date as the donor plot, because male and female flowering were synchronized. With a planting delay of 2 weeks or an isolation distance of 200 m, the gene flow frequency decreased to just beyond the limits of detection. This was also achieved with an isolation distance of 30 m or 3 weeks’ difference in planting dates. The results of 2007 were consistent with those of 2006. The present study illustrates the possibility of reducing the gene flow frequency through temporal separation of flowering dates on the basis of appropriate delay in sowing dates.
The current demonstration that sowing and flowering delay are effective strategies for decreasing gene flow frequency is consistent with the findings of Halsey et al. (Reference Halsey, Remund, Davis, Qualls, Eppard and Berberich2005), Bannert et al. (Reference Bannert, Vogler and Stamp2008) and Palaudelmàs et al. (Reference Palaudelmàs, Melé, Peñas, Pla, Nadal, Serra, Salvia and Messeguer2008), but differences in measurement of gene flow frequency were also found. Halsey et al. (Reference Halsey, Remund, Davis, Qualls, Eppard and Berberich2005) showed that a 2-week sowing delay at 62 m or less could decrease the gene flow frequency below the limit of detection (c. 0·000002), while Palaudelmàs et al. (Reference Palaudelmàs, Melé, Peñas, Pla, Nadal, Serra, Salvia and Messeguer2008) found that a 7-day flowering delay resulted in a gene flow frequency close to zero and Bannert et al. (Reference Bannert, Vogler and Stamp2008) reported that during the mid-phase of silking in the receptor plots, cross-pollination with a 7-day temporal separation decreased by more than 80% compared to full synchrony. The results of the present study differ from these previous studies, showing that a 2-week sowing delay at 200 m or a 3-week sowing delay at 30 m decreased the gene flow frequency below the limit of detection. The arid desert climate during the flowering period in Halsey's experiments, the drier Mediterranean climate in Catalonia, Spain in Palaudelmàs's experiments, the hilly landscape of Switzerland in Bannert's experiments and the plain landscape with temperate monsoon climate in the present experiment could be responsible for the different gene flow frequencies found. Obviously, the differences in gene flow frequencies obtained by experimenters could be attributed, to some extent, to the different weather conditions and landscapes in the different test sites.
In the present experiment, both the donor and receptor plots were planted with maize having the same genetic background. This ensured that the anthesis of the maize started at the same time and the plants were completely synchronized under the same sowing conditions. Additionally, the anthesis of maize could be staggered in a predictable way (by varying the sowing date). Compared with data obtained from maize of different genetic backgrounds planted in the donor and receptor plots, the errors should be smaller here (it should be noted here that different genotypes were used by the other workers cited above).
Wind speed and direction also influence gene flow frequencies. Several workers (Ma et al. Reference Ma, Subedi and Reid2004; Halsey et al. Reference Halsey, Remund, Davis, Qualls, Eppard and Berberich2005; Pla et al. Reference Pla, La Paz, Penas, García, Palaudelmàs, Esteve, Messeguer and Melé2006; Weber et al. Reference Weber, Bringezu, Broer, Eder and Holz2007) have observed that the out-crossing rate is high in the direction of the prevailing wind. Long-distance pollen transfer could be seriously affected by, and might be related to, the vertical wind (Bannert & Stamp Reference Bannert and Stamp2007). In the present experiment, gene flow frequencies in 2006 were higher than that in 2007, and may be related to the average wind speed between 09.00 and 12.00 h in the 3 days of peak pollen shed of 9·2 and 6·1 km/h respectively (Tables 5 and 6). Gene flow frequency was higher in the downwind direction than in the upwind in both years. In 2006, the dominant wind direction was southwest, resulting in the highest gene flow frequencies in the NE plot, and lowest frequencies in the SW plots. In 2007, the wind direction was northeast during flowering and gene flow frequency was highest in the south and lowest in the north. These results indicated that the wind speed and direction affected the out-crossing rate significantly. This is consistent with the results of Pla et al. (Reference Pla, La Paz, Penas, García, Palaudelmàs, Esteve, Messeguer and Melé2006).
The scale of pollen release also had a potential effect on cross-pollination (Treu & Emberlin Reference Treu and Emberlin2000). Although the frequency of gene flow can be increased by increasing the size of the donor plot and the planting density, this relationship is not linear (Eastham & Sweet Reference Eastham and Sweet2002; Glover Reference Glover2002). In the present study, the areas of the donor plots (50×50 m or 5×10⁵ m) and the receptor plots (3×5 m) are small in size. It is possible that there may be some errors in the data for the gene flow frequencies for the large distance away from the donor plot. However, the present study provides valuable information.
The surroundings of the experimental field are also important in the study of gene flow. For example, in an experiment by Bateman (Bateman Reference Bateman1947), the donor plot was surrounded by a 3·3 m high wall, which reduced the effects of wind on gene flow. In the present experiments, the fields were flat and there were no buildings or trees surrounding the field; this is representative of the conditions in the Yellow River valley maize-producing zone. Thus, the results of the present study have significance for guiding the commercial production of GM maize.
The present study was characterized by the use of small pollen source fields (50×50 m or 5×10⁵ m), small receiving plots (3×5 m) and non-continuous source-receiving fields. Pollen was unhindered from moving from the source to the recipients. This was similar to fields where the areas between the plots are left fallow, which would dilute the pollen density of the non-transgenic maize in the receptor plot and increase the competitiveness of the incoming transgenic pollen. At greater distances from the pollen source, the chance of an outcross event in the present study may be higher than that in experiments where maize was planted between plots (Goggi et al. Reference Goggi, Lopez-Sanchez, Caragea, Westgate, Arritt and Clark2007; Langhof et al. Reference Langhof, Hommel, Husken, Schiemann, Wehling, Wilhelm and Ruhl2008; Porta et al. Reference Porta, Ederle, Bucchini, Prandi, Verderio and Pozzi2008).
To avoid pollen-mediated gene flow, appropriate isolation distances or isolation time should be used. The results obtained in the Huang-huai-hai region indicated that an isolation distance of 300 m or a 3-week delay in planting time could reduce gene flow to zero. Thus, an effective isolation distance of over 300 m, or a delay in planting date by more than 3 weeks, could prevent the flow of external genes into conventional maize.
The authors thank Shandong Province Science and Technology Development Plan (2009GG10009010), programmes involved in research on transgenic plants in China (2008ZX08005-004) and the Natural Science Foundation of Shandong for the financial support of Project (Y2004D04). We also thank Dr. Roberta Greenwood for assistance in editing this manuscript.