


Introduction
Lack of information regarding mass change in Himalayan glaciers is one of the main causes of uncertainties in the contribution of mountain glaciers to current and future sea-level rise. Ice mass loss in this region over past decades was estimated by several studies on the basis of satellite and field data with the aid of mass-balance modelling (e.g. Reference DyurgerovDyurgerov, 2010; Reference Radić and HockRadić and Hock, 2011), as well as satellite gravimetric measurements (Reference Matsuo and HekiMatsuo and Heki, 2010; Reference Jacob, Wahr, Pfeffer and SwensonJacob and others, 2012). However, these studies yielded significantly different estimates with relatively large uncertainties. The primary reason for the discrepancy and ambiguity is insufficient field data, which hampers the understanding of processes controlling glacier changes in the Himalaya. In situ data are important for this region because of the uniqueness and diversity of geographical conditions (e.g. monsoon climate, summer accumulation, high elevation and debris-covered surface). Nevertheless, field observations of the Himalayan glaciers are sparse in space and time.
The Nepal Himalaya form the central part of the Himalayan mountain system. High mountains with deeply incised terrain accommodate a large number of glaciers, which are frequently covered by debris. The glacier mass balance is dominated by Indian monsoon, and thus summer accumulation regime is a characteristic feature in this region (Reference Ageta and HiguchiAgeta and Higuchi, 1984; Reference FujitaFujita, 2008). Glacier changes are of particular importance for Nepal, not merely because glacier runoff is an essential water resource in mountain areas, but also because it influences the discharge in lowland rivers. Studies based on satellite imagery showed that the glaciers have been retreating and losing mass since the 1970s (Reference Bolch, Pieczonka and BennBolch and others, 2011; Reference Scherler, Bookhagen and StreckerScherler and others, 2011; Reference Nuimura, Fujita, Yamaguchi and SharmaNuimura and others, 2012), but accurate estimation of glacier volume change is still difficult because satellite-derived surface elevation is often insufficiently accurate. Detailed analysis of the mechanisms that control changes in glaciers is also difficult because essential information (e.g. ice velocity, ice thickness and mass balance) is usually unavailable.
In the Nepal Himalaya, reliable long-term ground-based data are available from only a limited number of glaciers. Yala Glacier has been the focus of several studies since the 1980s (e.g. Reference Ageta, Iida and WatanabeAgeta and others, 1984; Reference HiguchiHiguchi, 1984) and thus is regarded as a benchmark glacier in the region. Together with data from two other glaciers in Nepal, surface elevation data from Yala Glacier were used to compute mass-balance variations over the three decades since the 1970s (Reference Fujita and NuimuraFujita and Nuimura, 2011). The results showed spatially non-uniform distributions of mass balance over the Nepal Himalaya, and the data from Yala Glacier represented the changes in the glaciers in a relatively humid environment at lower altitudes. The aim of this paper is to report the observational data from the 2009 field campaign on Yala Glacier. We present the results of a ground-penetrating radar (GPR) ice thickness survey performed for the first time on this glacier. The GPR data were used to estimate the total ice volume of the glacier by several methods. We also compared surface elevation and ice velocity with those measured in previous campaigns to discuss their changes since 1982. Surface elevation change over Yala Glacier was presented by Reference Fujita and NuimuraFujita and Nuimura (2011), but we focus the study on our GPR survey route to investigate the details of ice thickness change and its influence on the ice dynamics.
Method
Study site
Yala Glacier is located in the Langtang valley in north-central Nepal (Fig. 1). The glacier covers a southwest-facing slope over an area of 1.82 km2 in 2006 and an elevation range of 5000–5600 ma.s.l. It is one of the most frequently studied glaciers in the Himalaya. The research conducted here includes an ice-core drilling project undertaken in 1981 and 1982 (Reference Watanabe, Takenaka, Iida, Kamiyama, Thapa and MulmiWatanabe and others, 1984) and mass-balance, ice flow and climatic observations in the 1980s and 1990s (Reference Steinegger, Braun, Kappenberger and TartariSteinegger and others, 1993; Reference Nakawo, Fujita, Ageta, Shankar, Pokhrel and YaoNakawo and others, 1997; Reference Fujita, Takeuchi and SekoFujita and others, 1998). The ice thickness is known to be 30 and 60m at two ice-core drilling sites (Fig. 2a) (Reference Watanabe, Takenaka, Iida, Kamiyama, Thapa and MulmiWatanabe and others, 1984), but ice radar measurements have never been carried out. Borehole observations showed that ice was temperate at the upper drilling site and slightly cold (∼–1°C) at the lower site (Reference Watanabe, Takenaka, Iida, Kamiyama, Thapa and MulmiWatanabe and others, 1984; Reference OzawaOzawa, 1991). The glacier has been thinning since the 1980s, and the rate of thinning has been increasing (Reference Fujita, Takeuchi and SekoFujita and others, 1998; Reference Fujita and NuimuraFujita and Nuimura, 2011).
(a) Map of Nepal showing the location of the study site. (b) A satellite image of Yala Glacier taken on 3 January 2006 (data source: Google Earth). The bold curve on the glacier indicates the GPR and GPS survey route, and the triangle shows the location of the GPS reference station. Contours show surface elevation with intervals of 50 m.

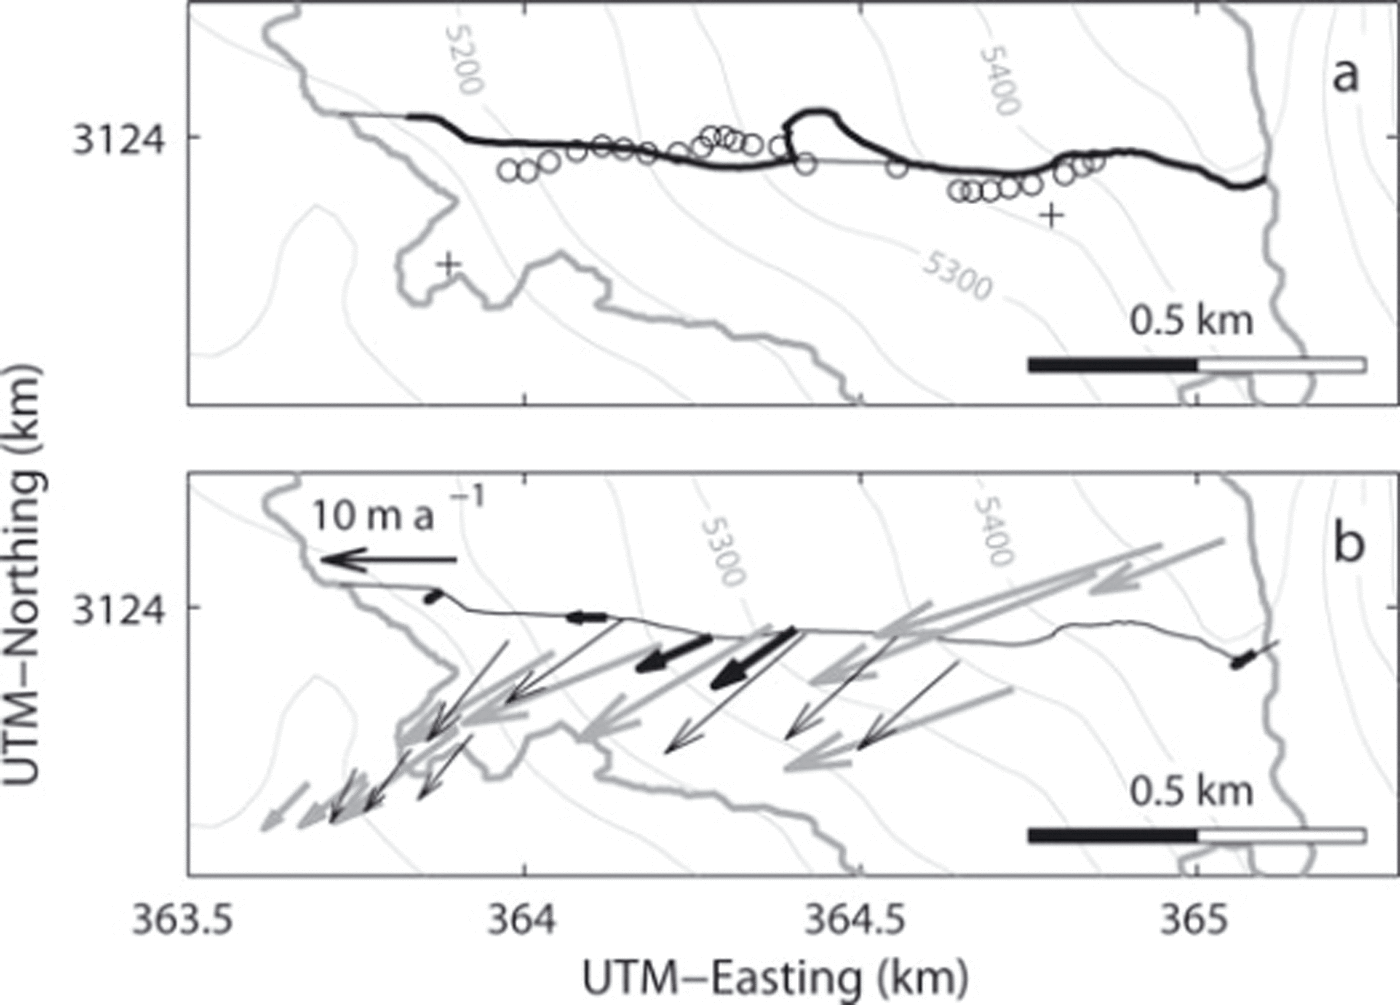
Maps showing the GPR and GPS survey route in 2009 (bold black curve): (a) surface elevation survey sites in 1996 (open circles) and 1981 and 1982 borehole sites (crosses); (b) ice flow vectors in 2009 (bold black arrows), 1996 (thin black arrows) and 1982 (bold grey arrows). Ice surface elevation and thickness were interpolated along the thin black curve to present the data in Figures 4 and 5. Contours show surface elevation at intervals of 50 m. The velocities in (b) were measured at the origins of the vectors. The coordinates are in Universal Transverse Mercator (UTM) zone 45N.
Ice thickness
We employed GPR (Geophysical Survey Systems Inc., SIR3000) with a centre frequency of 270MHz to measure ice thickness. The field measurement was carried out on 1 November 2009. The instrument was mounted on a sledge, which was towed along a survey route from the top of the glacier to the terminus (Figs 1 and 2). The route was diverted to the north at an elevation between 5300 and 5350 m because of crevasses. Antennas enclosed in a box were aligned perpendicular to the survey route. Radar echo signals were recorded with a scanning frequency of 24 Hz (2048 samples per scan) and processed using Radan 7 software for Windows (Geophysical Survey Systems Inc.). We determined the two-way travel time of return waves from the bed by carefully inspecting a radargram. Ice thickness was computed from the travel time by assuming a wave velocity in a glacier as 170 m u,s–1. An ice thickness profile along the route was obtained using the GPS survey data described in the following subsection. An error due to uncertainty in the reflection peaks in the radargram was evaluated as ±0.9 m from repeated identification of the peak locations. We also expect errors due to ambiguity in the wave velocity, GPS positioning errors and vertical resolution limited by the wavelength. As a sum of these, the maximum error in the ice thickness measurement was estimated as 1.5 m plus 2% of ice thickness.
Surface elevation
Glacier surface elevation was measured along the GPR survey route using paired GPS equipment. A GPS antenna and receiver (Magellan, ProMark3) were mounted on a backpack carried by a surveyor, and the continuously recorded GPS satellite signals were post-processed with those from a reference GPS station (GNSS Solutions, GEM-1) installed southwest of the glacier (Fig. 1b). The positioning error in the vertical direction, including uncertainty in the height of the antenna carried by a surveyor, was estimated as 0.3 m (Reference Fujita and NuimuraFujita and Nuimura, 2011). Errors in the horizontal direction were smaller than this value and negligible for our analyses described below. The surface elevation was compared with that measured in 1982 and 1996 to compute ice thickness changes over the periods. The surface elevation in 1982 was surveyed by ground photogrammetry (Reference YokoyamaYokoyama, 1984) and later digitized into a 10 m resolution digital elevation model (DEM) (Reference Fujita and NuimuraFujita and Nuimura, 2011). The accuracy of this DEM was reported as ∼10m (Reference Fujita and NuimuraFujita and Nuimura, 2011). The 1982 DEM was interpolated to the 2009 GPR survey route to compute the elevation change from 1982 to 2009. Because the 1996 survey sites are not exactly on our survey route (Fig. 2a) (Reference Fujita, Takeuchi and SekoFujita and others, 1998), we compared the 1996 and 2009 data at the same surface elevation according to an Advanced Spaceborne Thermal Emission and Reflection Radiometer (ASTER) DEM in 2003 (i.e. 1996 and 2009 survey sites that were compared were at the same elevation in the 2003 DEM). This procedure assumes an equal ice thickness change at the same surface level. The ASTER DEM was generated by stereographic analysis of ASTER images and distributed by the Earth Remote Sensing Data Analysis Center in Japan. The root-mean-square error of the DEM is typically in the range 10-20m (Reference Fujita, Suzuki, Nuimura and SakaiFujita and others, 2008). The GPS data in 2009 were also used to locate the GPR data.
Ice flow velocity
Ice flow velocity was measured by surveying stakes installed at five locations on the glacier (Fig. 2b). The upper three stakes were installed on 26 September 2008 and resurveyed on 31 October 2009, with kinematic GPS measurements (Magellan, ProMark3). The lower two stakes were surveyed for 4 days from 31 October to 4 November 2009, with dual-frequency static GPS measurements (Leica, System 1200). The GPS measurements were performed using reference GPS receivers located at ∼500m from the glacier margin (Fig. 1b), and the baseline length of the relative positioning was within 2 km. Positioning errors in the kinematic and static GPS measurements were 0.3 m and 2 mm in the horizontal plane. Accordingly, errors in the computed velocity were within 3% and 16% for the upper three and lower two measurement sites, respectively.
Results
Ice thickness
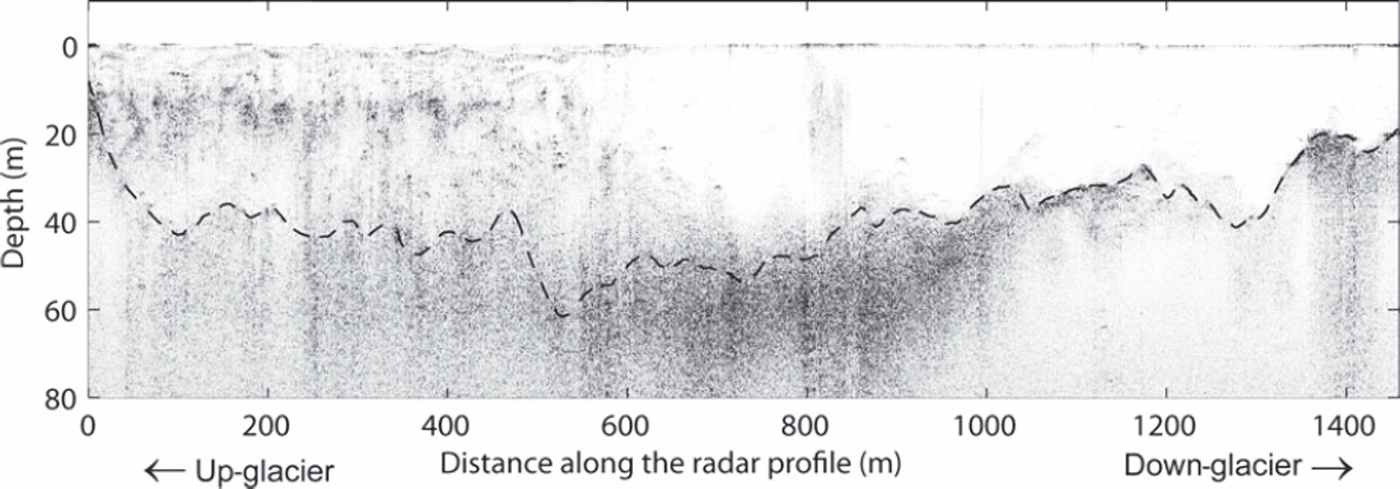
Figure 3 shows the intensity of GPR return signals along the survey route. The glacier bed was clearly identified by a transition from low to high return power at a certain depth in the lower half of the glacier. In contrast, the reflection from the bed was less clear and obscured by englacial return signals in the upper portion. We identified the bed reflection as much as possible in these regions by taking return power maxima, which were observed continuously up- and down-glacier. The GPR survey route followed a detour in the middle of the glacier to bypass crevasses. Hereafter, the detour was eliminated and the data blank near the terminus was interpolated, i.e. the bed and surface profiles are analyzed and depicted along the thin line in Figure 2. The mean ice thickness along the corrected route was 36 m and the maximum ice thickness was 61 ± 3 m at 530 m from the top of the glacier. Bed elevation was obtained as shown in Figure 4a by subtracting the thickness from the surface elevation measured by GPS. Owing to a bed depression at 500-600 m from the top of the glacier, relatively thick ice is present in this region. The bed slopes upwards (to the direction of ice flow) near the terminus at 1200-1300 m, which accompanies a depression in the surface.
A GPR radargram along the survey route. The intensity of the reflection power is represented by an arbitrary greyscale.
Surface elevation
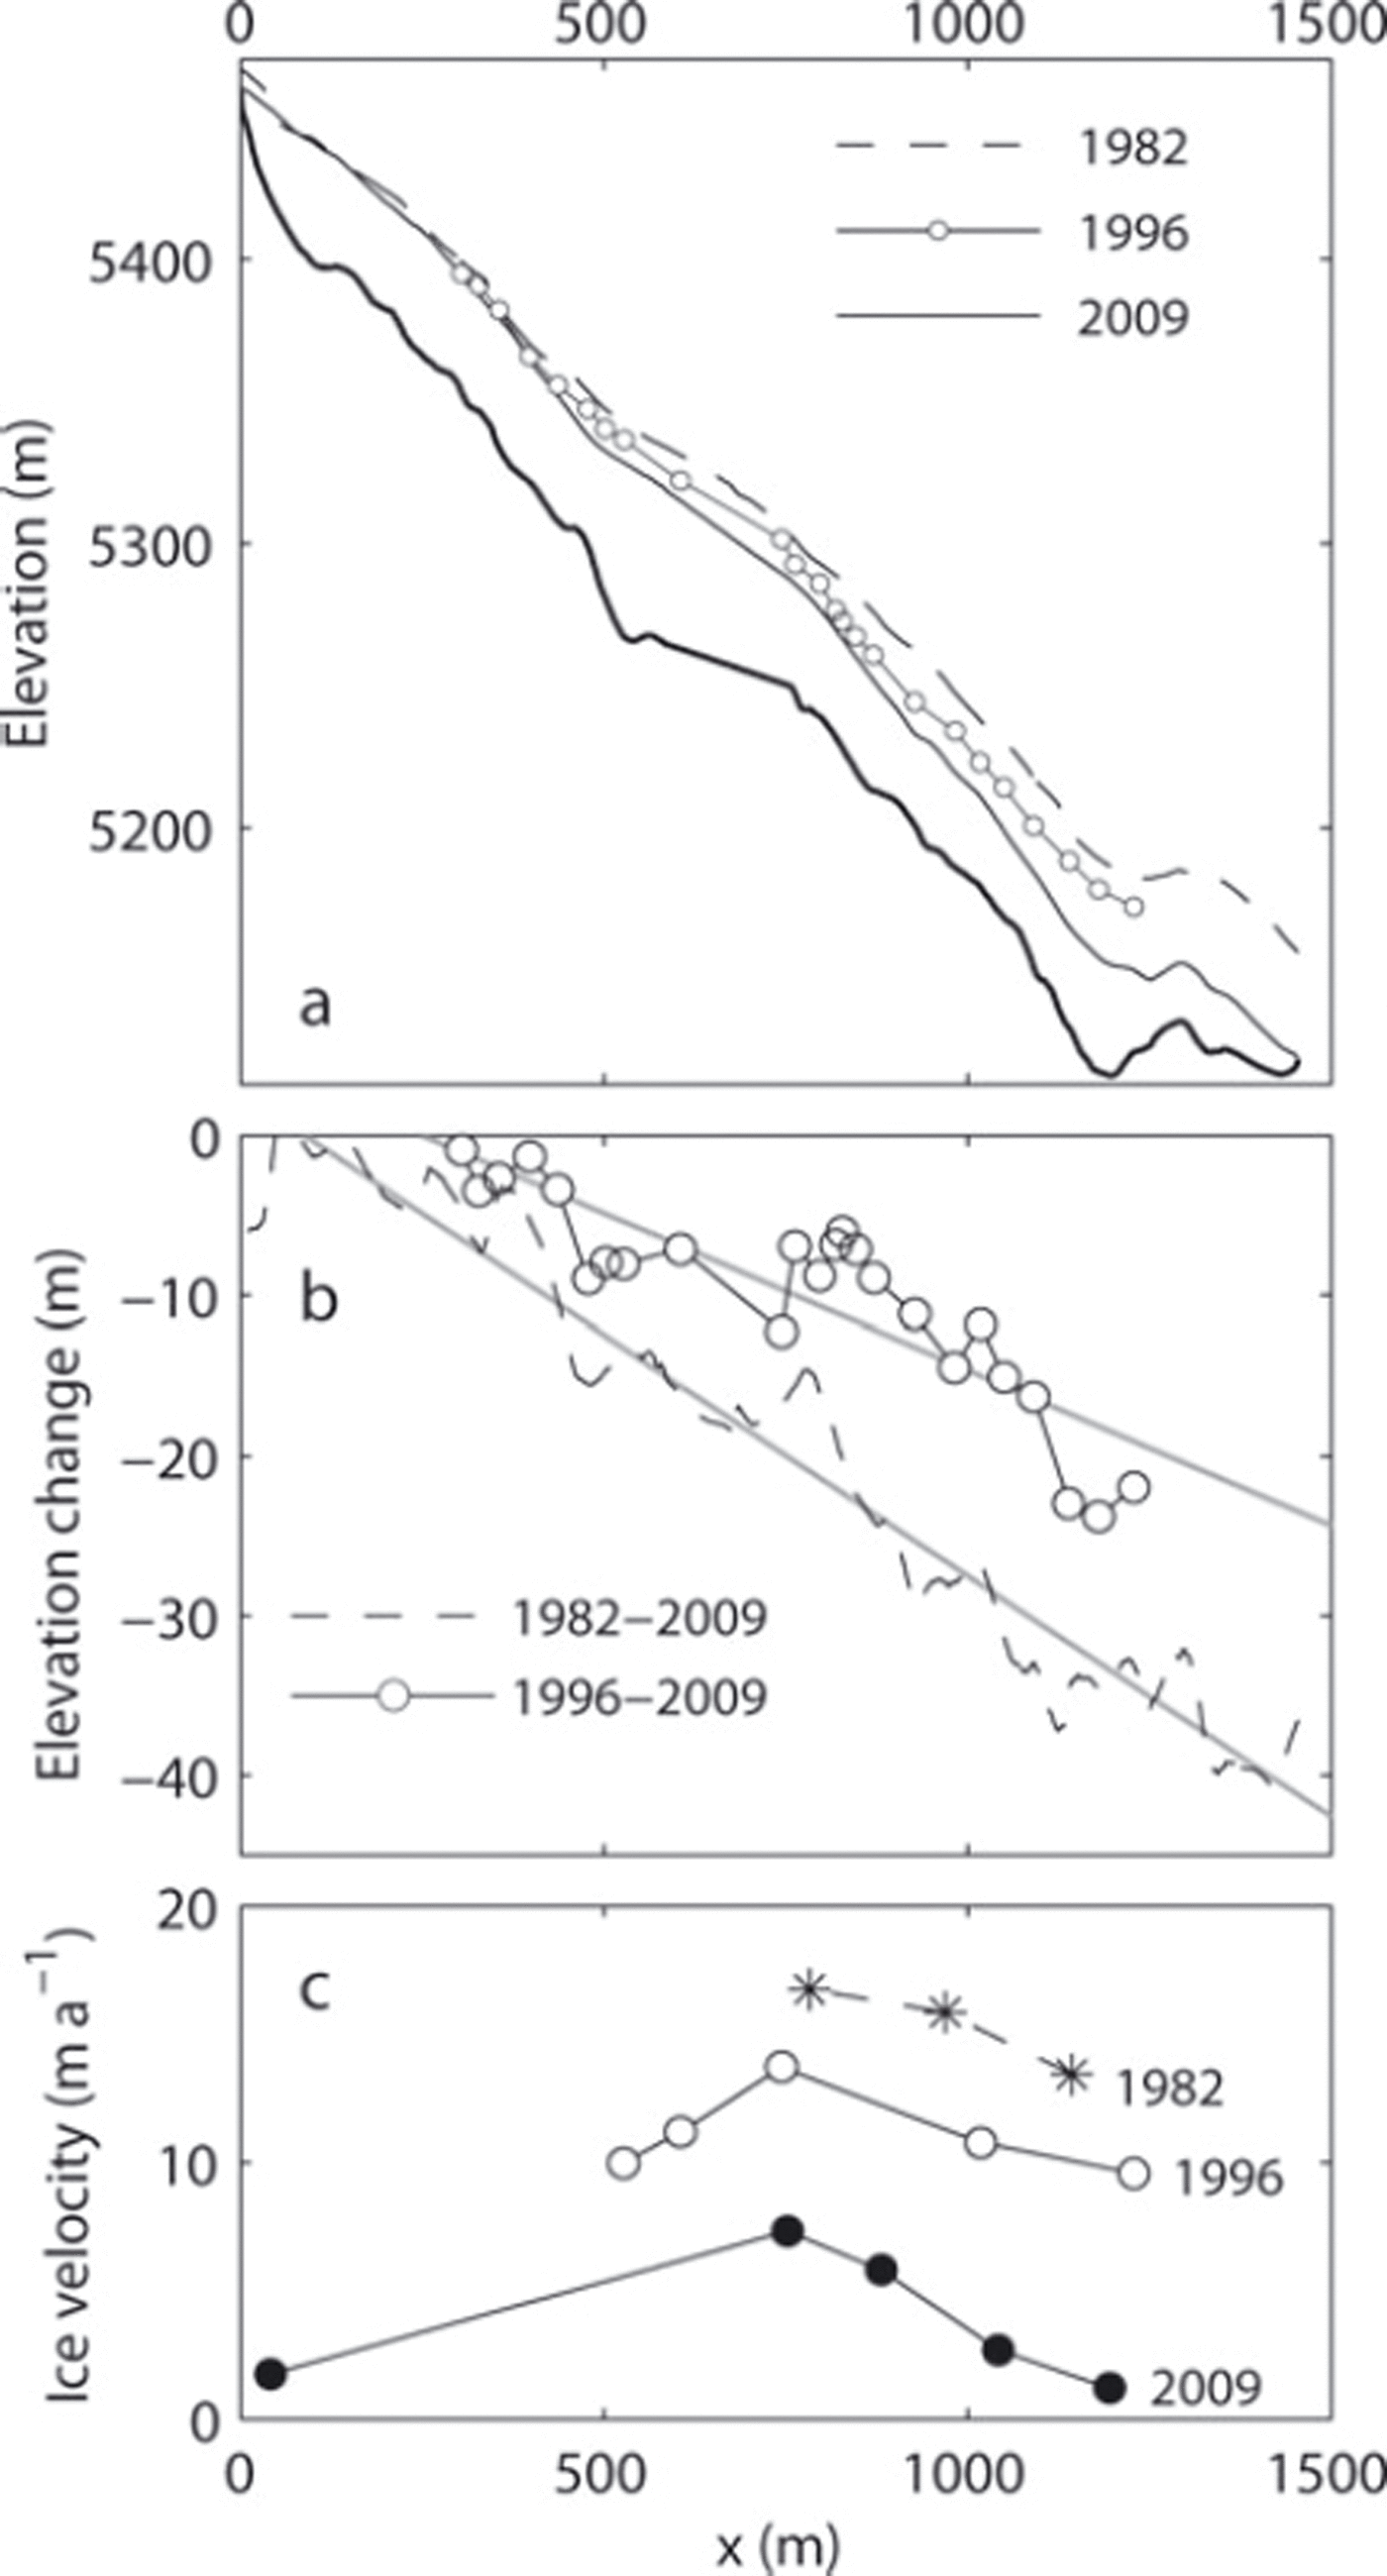
Glacier surface elevation obtained in this study was compared with the values measured in 1982 and 1996 (Fig. 4a). The results show that the surface has been continuously lowering since 1982 and that the magnitude of the change was greater down-glacier. The greatest change is found near the terminus, which is ∼–40m over the 27 years from 1982 to 2009 (Fig. 4b). The magnitude decreases up-glacier, approaching zero near the top of the survey route. The magnitude of elevation change within the upper 400 m of the glacier is less than -3.5 m for 1996-2009 and -7.5 m for 1982-2009. Mean rates of elevation change over the survey route were computed by assuming a linear relationship between the surface elevation change Δz and the distance from the top x (Fig. 4b). Obtained relationships are Δz =–0:0195x +4:87 m for 1996-2009 and Δz = 0:0302x + 2:66 m for 1982-2009. Assuming Δz = 0 in the upper reaches, where the linear functions give positive values, the mean rates along the survey route were –0:75 ± 0:24 m a-1 for 1996-2009 and -0.72 ± 0.09 m a-1 for 1982-2009 (-0.69 ± 0.25 m a-1 for 1982-96 as a residual). The uncertainties were estimated from the standard deviation of the data from the linear regression in Figure 4b.
(a) Surface elevation measured in 1982 (dashed curve), 1996 (solid curve with open circles) and 2009 (solid curve). The bold curve indicates the bed elevation. (b) Change in surface elevation from 1982 to 1996 (open circles) and from 1982 to 2009 (dashed curve). The grey lines are linear regressions of the data. (c) The horizontal component of ice flow velocity in 2009 (solid circles), 1996 (open circles) and 1982 (asterisks). The 1982 and 1996 velocities are only those measured within 50m from the 2009 survey route.
Ice flow velocity
Measured flow velocities are shown in Figures 2b and 4c, together with those from 1982 and 1996 (Reference Ageta, Iida and WatanabeAgeta and others, 1984; Reference Fujita, Takeuchi and SekoFujita and others, 1998). The 1982 and 1996 data in Figure 4c are only those measured within 50 m of the 2009 survey route. The glacier has slowed down significantly since the previous measurements. The change in velocity from 1982 to 2009 ranged from -10 to -12 m a-1 in the lower half of the glacier (x > 700 m). This is equivalent to a 60-90% velocity reduction. Most of the velocities were not measured for an annual interval (October-November at the lower two stakes in 2009, May-October in 1996 and September-October in 1982), which leaves the possibility that the velocities were influenced by seasonal variations. Nevertheless, the influence of the short measurement period on the velocity is probably insignificant since the bed is frozen in the ablation area according to the drilling in the 1980s (Reference Watanabe, Takenaka, Iida, Kamiyama, Thapa and MulmiWatanabe and others, 1984). Moreover, the observed velocity changes are much greater than those explained by possible seasonal variations.
Discussion
Our results showed that Yala Glacier has been losing ice mass since 1982 and that the rate of mass loss is not uniform over the glacier. The ice thinning rate is clearly dependent on the glacier surface elevation (Fig. 5a). The relationships between the thinning rate and elevation in 1982-96 and 1996-2009 are similar in the elevation range from 5200 to 5400 m. However, the magnitude of the thinning rate in 1996-2009 is greater than that in 1982-96 near the terminus in the region below 5200 m a.s.l. Such variations in the elevation change, i.e. gradual increase from high to low elevations and greater increase near the terminus, are commonly observed on other debris-free Himalayan glaciers (Reference Fujita and NuimuraFujita and Nuimura, 2011). Considering that the ice was relatively thin and slow-moving at ∼5200ma.s.l. in 2009 (Fig. 5b and c), only a little ice mass was advected into the lower elevation range. Thus, the reduction in down-glacier ice flux might have caused a decrease in vertical strain rate and a significant increase in thinning rate near the terminus, as has been reported in a valley glacier in the European Alps (Reference Berthier and VincentBerthier and Vincent, 2012).
(a) Change in surface elevation from 1982 to 1996 (open circles) and from 1996 to 2009 (solid circles); (b) the horizontal component of ice flow velocity in 2009 (solid circles), 1996 (open circles) and 1982 (asterisks); and (c) ice thickness along the survey route measured with GPR (solid curve) and computed with a constant driving-stress assumption (dashed curve). Surface elevation coordinates are in the years of the second measurements for (a) and (b) and in 2009 for (c).

The mean ice velocity at 5120-5300 m a.s.l. reduced by 29% and 62% from 1982 to 1996 and from 1996 to 2009, respectively (Fig. 5b). Presumably, the most important driver of this deceleration is glacier thinning. The mean ice thickness in this elevation range was 60 m in 1982, which decreased to 45 m in 1996 and 31 m in 2009. If we assume ice flow was entirely due to viscous deformation and proportional to the fourth power of ice thickness (Reference Cuffey and PatersonCuffey and Paterson, 2010), the velocity reduction expected from the ice thinning is 68% for 1982-96 and 93% for 1996-2009. Apparently, the observed velocity change is smaller than this estimation, probably because the ice surface has been steepening because of greater elevation change in the lower reaches of the glacier. The surface slope is another important factor in the ice deformation rate, and thus surface steepening partly compensated the deceleration due to ice thinning. In addition to the geometrical conditions, changes in ice thermal structure since the 1980s have to be taken into account. The borehole temperature measurements in 1981 and 1982 showed that ice was temperate in the accumulation zone while it was cold in the ablation zone (Reference Watanabe, Takenaka, Iida, Kamiyama, Thapa and MulmiWatanabe and others, 1984; Reference OzawaOzawa, 1991). Such polythermal structure is expected to be influenced by ice thinning as well as warming climate conditions. For example, ice temperature might have decreased after the glacier thinning, which has potentially reduced the ice velocity. On the other hand, meltwater increase due to warming might have enhanced basal sliding over a temperate bed.
GPR bed reflection was not clearly observed in the upper half of the glacier. Presumably, wave transmission and scattering within the ice were influenced by the thermal structure of the glacier. The drilling in 1982 confirmed that ice was temperate in the upper reach at 5405 m a.s.l. (Fig. 2a) (Reference Watanabe, Takenaka, Iida, Kamiyama, Thapa and MulmiWatanabe and others, 1984). Thus, we can expect more significant attenuation and scattering by temperate ice as well as snow meltwater percolated into firn and ice. In the lower reaches, cold ice was observed by the drilling in 1981 near the current terminus at 5180 m a.s.l. (Fig. 2a). This is consistent with our GPR data, i.e. clear reflection from the bed and less scattering within the ice. Our data suggest that Yala Glacier is a polythermal glacier with temperate and cold ice in the upper and lower portions, which agrees with the structure proposed in previous studies (Reference Watanabe, Takenaka, Iida, Kamiyama, Thapa and MulmiWatanabe and others, 1984; Reference OzawaOzawa, 1991).
The ice thickness measured along the GPR survey route (Fig. 5c) provides a clue to estimate the ice volume of Yala Glacier. If we simply multiply the mean ice thickness (h = 36 m) along the route to the surface area obtained from the satellite image in 2006 (A = 1:82 km2), the ice volume is V= 0:066 km3. This value can be regarded as the upper bound because the survey route was taken in the central part of the glacier, where ice is relatively thick. Next, we assume the driving stress (τd = ρghsinθ, where p = 910 kgm–3 is ice density, g = 9:8 ms–2 is the gravitational acceleration, h is ice thickness and a is surface slope) is constant over the glacier and rd is represented by the mean value along the survey route. By using surface slope from the ASTER DEM in 2003, the mean driving stress along the route was T
d
= 98 kPa and the total ice volume was computed as
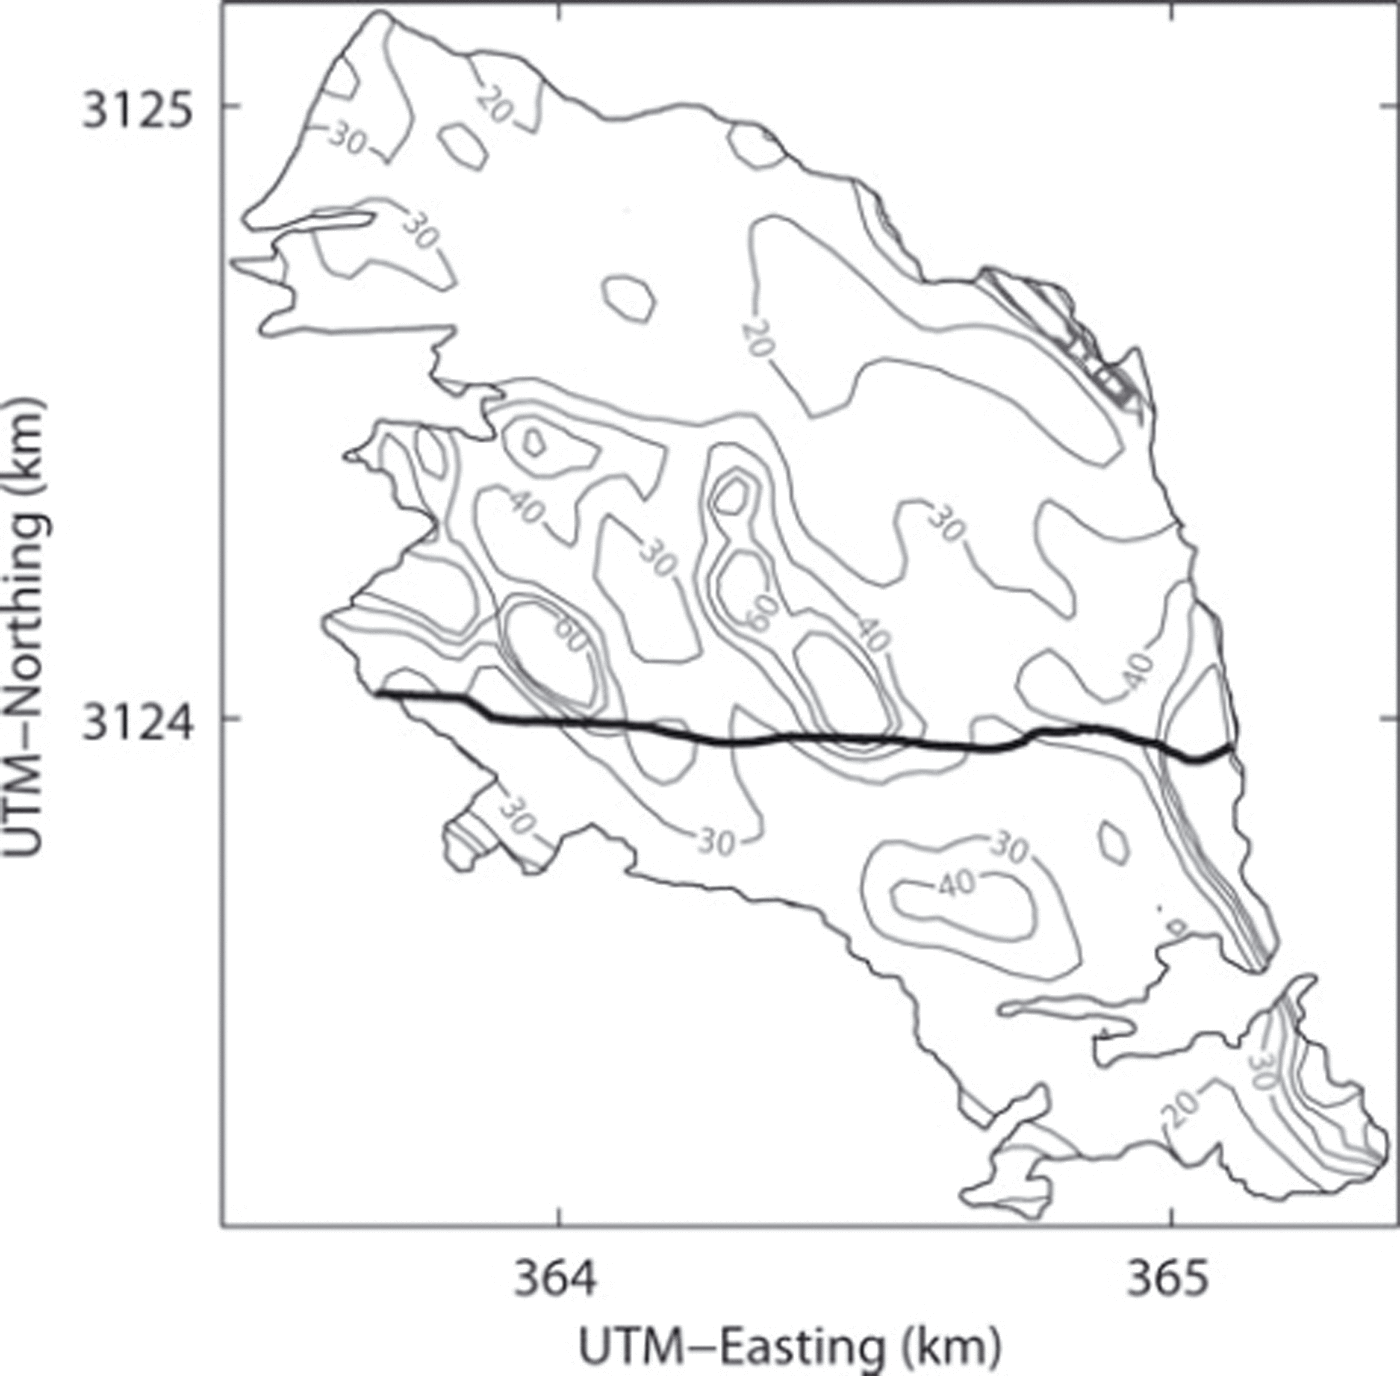
 = 0:061 km3. This method overestimates actual values over a flat terrain and near glacier margins. Nevertheless, thickness measured along the survey route is reasonably well reproduced by the computation (Fig. 5c). The computed thickness distribution shows relatively thick ice in the lower middle part of the glacier (Fig. 6). A very similar total ice volume 0.062 km3 was obtained from an equation of area-volume scaling analysis (V = cAγ) by using one of the proposed parameter sets (c = 0:191, 7 = 1:36) (Reference Bahr, Meier and PeckhamBahr and others, 1997; Reference Radić and HockRadic and Hock, 2010). This choice of parameter values gives a relatively smaller volume estimate by this method among the parameters proposed for mountain glaciers. Another parameter set proposed by Reference Chen and OhmuraChen and Ohmura (1990) (c = 0:2055, 7=1 : 3 7 5 ) gives a volume of 0.083 km3, which is greater than that obtained above from the mean thickness along the survey route. A likely reason why the area-volume scaling analysis tends to overestimate the volume of Yala Glacier is the relatively steep slopes of this glacier. According to these analyses, we propose 0.061 km3 as a likely value and 0.066 km3 as the upper bound for the total ice volume in 2009.
Ice thickness computed by assuming a constant driving stress. The intervals of the contours are 10 m, and the coordinates are in UTM zone 45N. The bold curve on the glacier indicates the GPR and GPS survey route.
In addition to the elevation data along the GPR survey route presented in this study, Reference Fujita and NuimuraFujita and Nuimura (2011) measured surface elevation extensively in the lowermost region of the glacier to compute the mean thinning rate of Yala Glacier from 1982 to 2009. The area-averaged ice thinning rates were shown as -0.746 ± 0. 2 0 2 and -0.879 ± 0.088 m a- 1 for the periods 1982-96 and 1996-2009, respectively. If we assume these rates and the ice volume estimated in this study (0.061 km3 in 2009), the total volume loss from 1982 to 2009 corresponds to 43 ± 5% of the 1982 volume.
Conclusion
To contribute to the accurate understanding of recent glacier changes in the Himalaya, surface elevation and ice velocity of Yala Glacier were resurveyed in 2009. The results were compared with those measured in 1982 and 1996. The glacier has been thinning since 1982 at an increasing rate: -0.69 ± 0.25 m a- 1 from 1982 to 1996 and -0.75 ±0.24 m a- 1 from 1996 to 2009. The magnitude of the thinning rate increased from the top to the lower reaches of the glacier, for example from -0.3 m a- 1 in the upper 400 m to - 1 .8 m a- 1 near the terminus in 1996-2009. Ice velocity has reduced by 60-90% from 1982 to 2009 in the lower half of the glacier. The lower reaches of the glacier became steeper as a result of the greater thinning rate down-glacier, suggesting that deceleration due to ice thinning was partly compensated by the steepening surface slope. We also measured ice thickness using GPR along a survey route from the top to the terminus. Mean thickness along the route was 36 m and the thickest ice (61 ± 3 m) was found on a bedrock depression at 530 m from the top. Assuming a constant driving stress over the glacier, the total ice thickness of the glacier was estimated as 0.061 km3. By assuming this value and the area-averaged thinning rates reported by a previous study (Reference Fujita and NuimuraFujita and Nuimura, 2011), Yala Glacier has lost ∼ 4 0% of ice volume from 1982 to 2009.
Acknowledgements
We thank members of the 2009 field campaign for their help in the measurements on Yala Glacier. T. Fukuda helped in satellite data analysis. The manuscript was handled by the scientific editor, A. Booth, and was improved by constructive comments from two anonymous reviewers. This research was funded by the Japanese Ministry of Education, Science, Sports and Culture, Grant-in-Aid for Scientific Research A, 19253001, 2007-10.



