Introduction
Over the last several decades, there has been an enormous increase in interest in the neural substrates of language processing. Accordingly, there has been a proliferation of studies using event-related brain potentials (ERPs) which have revealed a great deal about how and when different types of information are integrated during real-time comprehension in native (L1) speakers of a language. ERPs have also been used to study neurocognitive aspects of second language (L2) processing, as ERPs’ multidimentional nature allows the investigation of fundamental questions about the cognitive processes subserving late-learned languages. In studies of L2 learning, identifying whether or not learners’ ERP waveforms approximate those of native speakers has sometimes been taken as a ‘litmus test’ for whether L2 processing is fundamentally similar to or different from native language processing. For example, an experimental effect size smaller than that found in native speakers is often taken to mean less robust processing in the learner population, while a qualitatively different ERP effect or the inability to detect some effect is often taken to reflect a fundamental difference in the neural substrates of L2 processing or a lack of that specific neurocognitive process in the group of learners, respectively (see e.g., Rossi, Gugler, Friederici & Hahne, Reference Rossi, Gugler, Friederici and Hahne2006; Sabourin & Stowe, Reference Sabourin and Stowe2008, for examples of these types of inferences).
An important caveat, however, is that much of the published work has reported ERPs that represent averages over both trials and individuals. In order to achieve an adequate signal-to-noise ratio, voltages from the raw electroencephalogram (EEG) in a time epoch of interest are averaged over all trials in a given experimental condition within subjects, and then averaged again over subjects. These grand mean waveforms represent brainwave activity which is time- and phase-locked to the onset of the stimulus of interest and consistent across both trials and subjects (see Handy, Reference Handy2005; Luck, Reference Luck2005). In terms of L1 processing, researchers generally assume that monolingual native speakers of a language will exhibit similar neural signatures of language processing. This assumption seems reasonable, as there is a remarkable consistency in ERP responses seen across experiments and languages. However, L2 learning is subject to significant individual variation, which in turn can lead to problems of interpretation for traditional ERP analyses. We show here that in certain circumstances this variability is highly systematic. We show further that new insights into L2 learning result when the cross-subject variability is treated as a source of evidence rather than a source of noise.
Within the context of native languages, the use of grand means has proven to be a useful tool for studying language processing. One of the most remarkably consistent and replicable results over 30 years of cross-linguistic language-related ERP research is that lexico-semantic and morphosyntactic manipulations elicit qualitatively different brain responses. All content words elicit a negative-going brain wave with a peak at around 400 ms after presentation (the N400), but the size of this peak can be modulated by numerous factors, such as a word's semantic relatedness to a preceding context, cloze probability, and corpus frequency (Bentin, Reference Bentin1987; Kutas & Federmeier, Reference Kutas and Federmeier2000; Kutas & Hillyard, Reference Kutas and Hillyard1980; Osterhout & Nicol, Reference Osterhout and Nicol1999). Larger peak amplitudes are thought to reflect greater difficulty with lexical access and integration (the N400 ‘effect’). On the other hand, relative to well-formed controls, a wide range of sentence-embedded morphosyntactic anomalies (such as violations of agreement, tense, case, and verb subcategorization) elicit a large positive-going wave with a peak around 600 ms poststimulus (the P600: Ainsworth-Darnell, Shulman & Boland, Reference Ainsworth-Darnell, Shulman and Boland1998; Friederici, Hahne & Mecklinger, Reference Friederici, Hahne and Mecklinger1996; Hagoort, Brown & Groothusen, Reference Hagoort1993; Kaan, Harris, Gibson & Holcomb, Reference Kaan, Harris, Gibson and Holcomb2000; Osterhout & Holcomb, Reference Osterhout and Holcomb1992, Reference Osterhout, Holcomb, Rugg and Coles1995). Some studies of morphosyntactic processing have reported an additional negative-going wave with an onset of 100–400 ms poststimulus with a largely left anterior distribution preceding the P600 (the Left Anterior Negativity, or LAN: Friederici et al., Reference Friederici, Hahne and Mecklinger1996; Neville, Nicol, Barss, Forster & Garrett, Reference Neville, Nicol, Barss, Forster and Garrett1991; Osterhout & Holcomb, Reference Osterhout and Holcomb1992). Given the reliability of these results across languages, experimental manipulations, and task demands, it is clear that ERPs are differentially sensitive to distinct levels of processing, and that grand mean analyses capture this consistency.Footnote 1
Other research has shown that ERPs are also sensitive to individual differences in L1 processing. For example, the amplitude and onset of ERP effects can be modulated by individuals’ working memory capacity (King & Kutas, Reference King and Kutas1995; Vos, Gunter, Kolk & Mulder, Reference Vos, Gunter, Kolk and Mulder2001). More recent research has indicated that individuals’ brain responses to syntactic anomalies can vary systematically with differences in language proficiency, even among monolingual native speakers of a language. Pakulak and Neville (Reference Pakulak and Neville2010) reported a correlation between waveform characteristics (the laterality of an early LAN component and the amplitude of the P600 component) and participants’ L1 (English) proficiency. The anomalies elicited a more left-lateralized LAN and a larger-amplitude P600 in more proficient participants. Other researchers have shown that not only can quantitative aspects of ERP responses vary across individuals, but also the type of response. For example, some studies have demonstrated that under certain conditions, biphasic negative–positive responses to anomalies seen in grand mean waveforms may not represent true biphasic responses within individuals, but rather be an artifact of averaging across individuals, some of whom show an N400 and some of whom show a P600 (Nieuwland & Van Berkum, Reference Nieuwland and Van Berkum2008; Osterhout, Reference Osterhout1997; Osterhout, McLaughlin, Kim, Greewald & Inoue, Reference Osterhout, McLaughlin, Kim, Greewald, Inoue, Carreiras and Clifton2004). More recently, results from Inoue & Osterhout (Reference Inoue and Osterhout2012) indicate that within and across individuals, N400 and P600 effect magnitudes are negatively correlated, such that as one increases in magnitude, the other decreases to a similar degree. Furthermore, Nakano and colleagues (Nakano, Saron & Swaab, Reference Nakano, Saron and Swaab2010) showed that working memory span can modulate type of response to verb–argument animacy violations. In their study, those with lower span measures showed N400 effects to animacy violations whereas those with higher span measures showed P600 effects. It therefore seems that systematic individual variation exists but that this variability is obscured by traditional grand mean ERP waveforms.
For L2 learners the assumption of homogeneity of responses across individuals may be even more tenuous. Unlike L1 acquisition, success in L2 learning has been shown to correlate with a number of individual factors such as general intelligence, specific language aptitude, learning strategy, and motivation (Dörnyei & Skehan, Reference Dörnyei, Skehan, Doughty and Long2003; Naiman, Fröhlich, Stern & Todesco, Reference Naiman, Fröhlich, Stern and Todesco1996; Robinson, Reference Robinson2002; Skehan, Reference Skehan1989). McDonald (Reference McDonald2006) has shown that L2 learners’, but not native speakers’, accuracy and reaction time in a grammaticality judgment task were correlated with working memory and lexical decoding measures. L2 learners also have shown variability in grammaticality judgment accuracy across testing sessions, even when identical items were used on both occasions (Johnson, Shenkman, Newport & Medin, Reference Johnson, Shenkman, Newport and Medin1996). Learners additionally can show knowledge of L2 grammatical information in offline tasks, but no sensitivity in online tasks, suggesting greater variability in the timing of access and integration of that knowledge relative to natives (Clahsen & Felser, Reference Clahsen and Felser2006). This variability is made apparent in a study of reaction time and accuracy in a grammaticality judgment task by McDonald (Reference McDonald2000): the reported standard deviations for late L2 learners were generally two and three times larger for reaction time and accuracy, respectively, than for native speaker controls. In terms of its implications for ERP research into L2 processing, this greater variation, both between individuals and between trials within individuals, means that there may be increased fluctuation in the timing and nature of neural responses to L2 stimuli, thus obscuring what may be true effects from surfacing in grand mean waveforms.
Indeed, ERP research into L2 processing has yielded somewhat mixed results regarding the nature and status of syntactic processes in non-native speakers. Several studies have shown that P600s can be reliably elicited in non-native speakers, suggesting some continuity between native and non-native syntactic processing systems, especially for grammatical features shared across the L1 and L2, and for novel L2 features for learners at high L2 proficiency (Foucart & Frenck-Mestre, Reference Foucart and Frenck-Mestre2011; Frenck-Mestre, Osterhout, McLaughlin & Foucart, Reference Frenck-Mestre, Osterhout, McLaughlin and Foucart2008; Gillon Dowens, Guo, Guo, Barber & Carreiras, Reference Gillon Dowens, Guo, Guo, Barber and Carreiras2011; Hahne, Mueller & Clahsen, Reference Hahne, Mueller and Clahsen2006; Morgan-Short, Sanz, Steinhauer & Ullman, Reference Morgan-Short, Sanz, Steinhauer and Ullman2010; Morgan-Short, Steinhauer, Sanz & Ullman, Reference Morgan-Short, Steinhauer, Sanz and Ullman2012; Rossi et al., Reference Rossi, Gugler, Friederici and Hahne2006; Tokowicz & MacWhinney, Reference Tokowicz and MacWhinney2005). Others have failed to find robust P600 effects to syntactic anomalies, usually when the L2 feature is not found or is realized differently in the L1 (Foucart & Frenck-Mestre, Reference Foucart and Frenck-Mestre2011; Hahne & Friederici, Reference Hahne and Friederici2001; Ojima, Nakata & Kakigi, Reference Ojima, Nakata and Kakigi2005; Sabourin & Haverkort, Reference Sabourin, Haverkort, van Hout, Hulk, Kuiken and Towell2003; Sabourin & Stowe, Reference Sabourin and Stowe2008). Still others have reported that syntactic anomalies can elicit qualitatively different responses in L2 learners versus native speakers, usually in the form of a negativity rather than a positivity (Chen, Shu, Liu, Zhao & Li, Reference Chen, Shu, Liu, Zhao and Li2007; Guo, Guo, Yan, Jiang & Peng, Reference Guo, Guo, Yan, Jiang and Peng2009; Sabourin & Stowe, Reference Sabourin and Stowe2008) or a biphasic negative–positive response (Weber & Lavric, Reference Weber and Lavric2008).
It should be noted that the studies mentioned above which have failed to find classic P600 effects in L2 learners used traditional grand averages to study ERP effects. However, as pointed out by Osterhout and colleagues (Osterhout, McLaughlin, Pitkänen, Frenck-Mestre & Molinaro, Reference Osterhout, McLaughlin, Pitkänen, Frenck-Mestre and Molinaro2006) and McLaughlin and colleagues (McLaughlin, Tanner, Pitkänen, Frenck-Mestre, Inoue, Valentine & Osterhout, Reference McLaughlin, Tanner, Pitkänen, Frenck-Mestre, Inoue, Valentine and Osterhout2010), null results in L2 ERP research are especially problematic to interpret, since a given electrophysiological effect may be present on most trials in a few individuals, or on a few trials in most individuals, but be obscured in the averaging process due to noise in the raw electroencephalogram. Variability in timing of the effect across trials and individuals can additionally reduce effect sizes in ERP grand means, even when the true amplitude of a given electrophysiological effect is consistent across trials (Luck, Reference Luck2005). Nonetheless, given the findings of systematic variability in L1 processing reported above, it seems likely that at least some variability between L2 learners may also be systematic and therefore observable in analyses of individuals’ ERPs.
Only a few studies have investigated individual differences in ERP correlates of L2 syntactic processing. These experiments have generally used grouped designs to investigate the impact of some individual-level variable, such as age of arrival (Weber-Fox & Neville, Reference Weber-Fox and Neville1996) or L2 proficiency (Rossi et al., Reference Rossi, Gugler, Friederici and Hahne2006), on learners’ brain responses to syntactic violations. Using this approach could reduce problematic between-subject variability, as group members would be relatively homogenous with regard to some individual difference dimension (e.g., proficiency; see Steinhauer, White & Drury, Reference Steinhauer, White and Drury2009; van Hell & Tokowicz, Reference van Hell and Tokowicz2010, for discussion). Others have further reduced between-subject variability by adopting within-subjects longitudinal designs to study changes in individuals’ brain responses over time as L2 proficiency increases (McLaughlin et al., Reference McLaughlin, Tanner, Pitkänen, Frenck-Mestre, Inoue, Valentine and Osterhout2010; Morgan-Short et al., Reference Morgan-Short, Sanz, Steinhauer and Ullman2010; Morgan-Short et al., Reference Morgan-Short, Faretta, Brill, Wong and Wong2012; Osterhout et al., Reference Osterhout, McLaughlin, Pitkänen, Frenck-Mestre and Molinaro2006), or artificial language training paradigms which allow learners to reach high proficiency in a very short amount of time (Friederici, Steinhauer & Pfeifer, Reference Friederici, Steinhauer and Pfeifer2002; Morgan-Short et al., Reference Morgan-Short, Sanz, Steinhauer and Ullman2010; Morgan-Short et al., Reference Morgan-Short, Faretta, Brill, Wong and Wong2012). Another possibility for studying individual differences in processing is to use regression-based statistical techniques, as regression models have the ability to capture potentially linear and graded effects of individual differences measures. However, only a few studies have used this approach, and nearly all of these have focused on modulations of the N400 component associated with semantic processing (Moreno & Kutas, Reference Moreno and Kutas2005; Newman, Tremblay, Nichols, Neville & Ullman, Reference Newman, Tremblay, Nichols, Neville and Ullman2012; Ojima, Matsuba-Kurita, Nakamura, Hoshino & Hagiwara, Reference Ojima, Matsuba-Kurita, Nakamura, Hoshino and Hagiwara2011; though see Bond, Gabriele, Fiorentino & Alemán Bañón, Reference Bond, Gabriele, Fiorentino, Alemán Bañón, Tanner and Herschensohn2011).
In the study reported below we cross-sectionally investigated grammatical processing in English-speaking learners of L2 German who were enrolled in classroom-based university German courses. Our participants are therefore representative of a common L2 learner population in the United States. We recorded participants’ brain responses as they read sentences that were either well-formed or contained violations of German subject–verb agreement. Verb agreement is a grammatical feature shared by both English and German.Footnote 2 Shared features are often transferred from the L1 to the L2, and should thus be acquired early during the L2 learning process (MacWhinney, Reference MacWhinney, Kroll and De Groot2005; Sabourin, Stowe & de Haan, Reference Sabourin, Stowe and de Haan2006; Schwartz & Sprouse, Reference Schwartz and Sprouse1996). We quantified learners’ brain responses first using grand mean analyses, and then analyzed individual variation among learners’ ERP responses with regression-based models. We demonstrate that although grand mean analyses showed statistically robust findings in L2 learners of all levels, they obscured systematic, qualitative and quantitative differences among learners’ brain responses to L2 grammatical anomalies.
Method
Participants
Our participants included 13 native speakers of German (mean age: 28 years; range: 18–51; eight female) and 33 native English-speaking students enrolled in university-level second language German courses. Twenty were novice learners enrolled in the final course of the first-year German sequence (mean hours of instruction = 123.8, SD = 10.0; mean age: 20 years; range: 18–25; 10 female) and 13 were enrolled in third-year German courses (mean age: 20 years; range: 19–24; six female). All participants were healthy and had normal or corrected-to-normal vision and gave their informed consent after the nature and possible consequences of the study were explained. Participants received a small monetary compensation for taking part in the study.
Materials
Stimuli were sentences in German consisting of lexical items chosen from the first seven chapters of the textbook used in first-year German courses at the University of Washington. Sixty sentence pairs were created, with one member of each pair being semantically coherent and grammatical and the second member being identical, except for showing incorrect agreement between the subject pronoun and verb (e.g., Ich wohne/*wohnt in Berlin, “I live/*lives in Berlin”). All person/number combinations in German are marked with overt, phonologically realized morphemes. Grammatical and ungrammatical sentence pairs were distributed across two lists in a Latin-square design, such that each list contained only one version of each sentence. Experimental sentences were randomized among 140 filler sentences (70 ungrammatical) containing other types of syntactic anomalies. Sixty sentences contained violations of number agreement between a determiner or quantifier and noun (e.g., Viele/*ein Bücher liegen auf dem Tisch, “Many/*a books are on the table”) and 10 sentences contained an extra auxiliary verb (e.g., *Mein Bruder macht sind seine Arbeit, “My brother does are his work”). Each list contained a total of 200 sentences, half of which were ungrammatical.
Procedure
Participants were tested in a single session lasting approximately 85 minutes (including about 30 minutes of experimental preparation). Upon arrival in the laboratory, each participant was asked to fill out an abridged version of the Edinburgh Handedness Questionnaire and a language history questionnaire. Each participant was randomly assigned to one of the stimulus lists and was seated in a comfortable recliner in front of a CRT monitor. Participants were instructed to relax and minimize movements while reading and to read each sentence as normally as possible. Each trial consisted of the following events: each sentence was preceded by a blank screen for 1000 ms, followed by a fixation cross, followed by a stimulus sentence, presented one word at a time. The fixation cross and each word appeared on the screen for 475 ms followed by a 250 ms blank screen between words. Sentence-ending words appeared with a full stop followed by a “Good/Bad” response prompt. Participants were instructed to respond “good” if they felt it was a well-formed, grammatical sentence in German and “bad” if they felt it was ungrammatical or violated some rule of German. Participants were randomly assigned to use either their left or right hand for the “good” response.
Data acquisition and analysis
Continuous EEG was recorded from 19 tin electrodes attached to an elastic cap (Eletro-cap International) in accordance with the 10–20 system (Jasper, Reference Jasper1958). Eye movements and blinks were monitored by two electrodes, one placed beneath the left eye and one placed to the right of the right eye. The electrodes were referenced to an electrode placed over the left mastoid and were amplified with a bandpass of 0.01–100 Hz (3 dB cutoff) by an SA Instruments bioamplifier system. EEG was recorded from an additional electrode placed on the right mastoid to identify if there were any experimental effects detectable over the mastoids; no such effects were found. Impedances at scalp and mastoid electrodes were held below 5 kΩ and below 15 kΩ at eye electrodes.
Continuous analog-to-digital conversion of the EEG and stimulus trigger codes was performed at a sampling frequency of 200 Hz. ERPs, time-locked to the onset of the critical word, were averaged off-line for each participant at each electrode site in each condition. A digital low-pass filter of 30 Hz was applied to individuals’ averaged waveforms prior to analysis. Grand average waveforms were created by averaging over participants. Trials characterized by eye blinks, excessive muscle artifact, or amplifier blocking were not included in the averages; 11.8% of trials overall were removed due to artifacts. The number of rejections did not differ significantly between conditions or groups.
Behavioral results were quantified both using d-prime scores (Wickens, Reference Wickens2002) and proportion correct in the grammatical and ungrammatical sentence conditions. Behavioral results were analyzed with ANOVAs using group (native, third year, first year) as a between-subjects factor; ANOVAs on proportion correct contained grammaticality (grammatical, ungrammatical) as an additional repeated-measures factor. ERP components of interest were quantified by computer as mean voltage within a window of activity. In accordance with previous literature and visual inspection of the data, the following time windows were chosen: 50–150 ms (N1), 150–300 ms (P2), 300–500 ms (N400), and 500–800 ms (P600), relative to a 100 ms prestimulus baseline. Within each time window ANOVAs were calculated with grammaticality (grammatical, ungrammatical) as a within-subjects factor. Data from midline (Fz, Cz, Pz), medial–lateral (right hemisphere: Fp2, F4, C4, P4, O2; left hemisphere: Fp1, F3, C3, P3, O1), and lateral–lateral (right hemisphere: F8, T8, P8; left hemisphere: F7, T7, P7) electrode sites were treated separately in order to identify topographic and hemispheric differences. ANOVAs on midline electrodes included electrode as an additional within-subjects factor (three levels), ANOVAs on medial–lateral electrodes included hemisphere (two levels) and electrode pair (five levels) as additional within-subjects factors, and ANOVAs over lateral–lateral electrodes included hemisphere (two levels) and electrode pair (three levels) as additional within-subjects factors. The Greenhouse–Geisser correction for inhomogenetity of variance was applied to all repeated measures on ERP data with greater than one degree of freedom in the numerator. In such cases, the corrected p-value is reported.
Results
Behavioral results
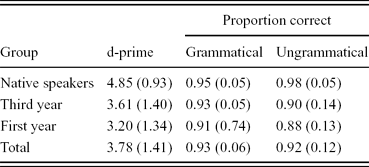
Mean d-prime scores, proportions judged correctly, and standard deviations are reported in Table 1. On average, all participants, including first-year learners, performed very well in the acceptability judgment task. Statistical analyses for d-prime scores showed a main effect of group, F(2,43) = 6.991, MSE = 1.578, p = .002. A Tukey's HSD post-hoc test showed significant differences between the first-year learners and native speakers, p = .002, and between the third-year learners and native speakers, p = .040. There were no differences between the first and third-year learners, p = .637. An ANOVA on proportion judged correctly showed a main effect of group, F(2,43) = 4.216, MSE = 0.010, p = .021, but no effect of grammaticality, F < 1, and no grammaticality by group interaction, F(2,43) = 1.185, MSE = 0.007, p = .316. A Tukey's HSD post-hoc test showed a significant difference between native speakers and first-year learners, p = .016, but no differences between the other groups, ps > .167.
Mean d-prime scores and proportion of sentences judged correctly for native speakers, third-year learners, and first-year learners. Standard deviations are reported in parentheses.

Note: A d-prime of 0 indicates chance performance on the acceptability judgment task; a d-prime of 4 indicates near-perfect discrimination between well-formed and ill-formed sentences.
Event-related potentials results
Grand mean analyses
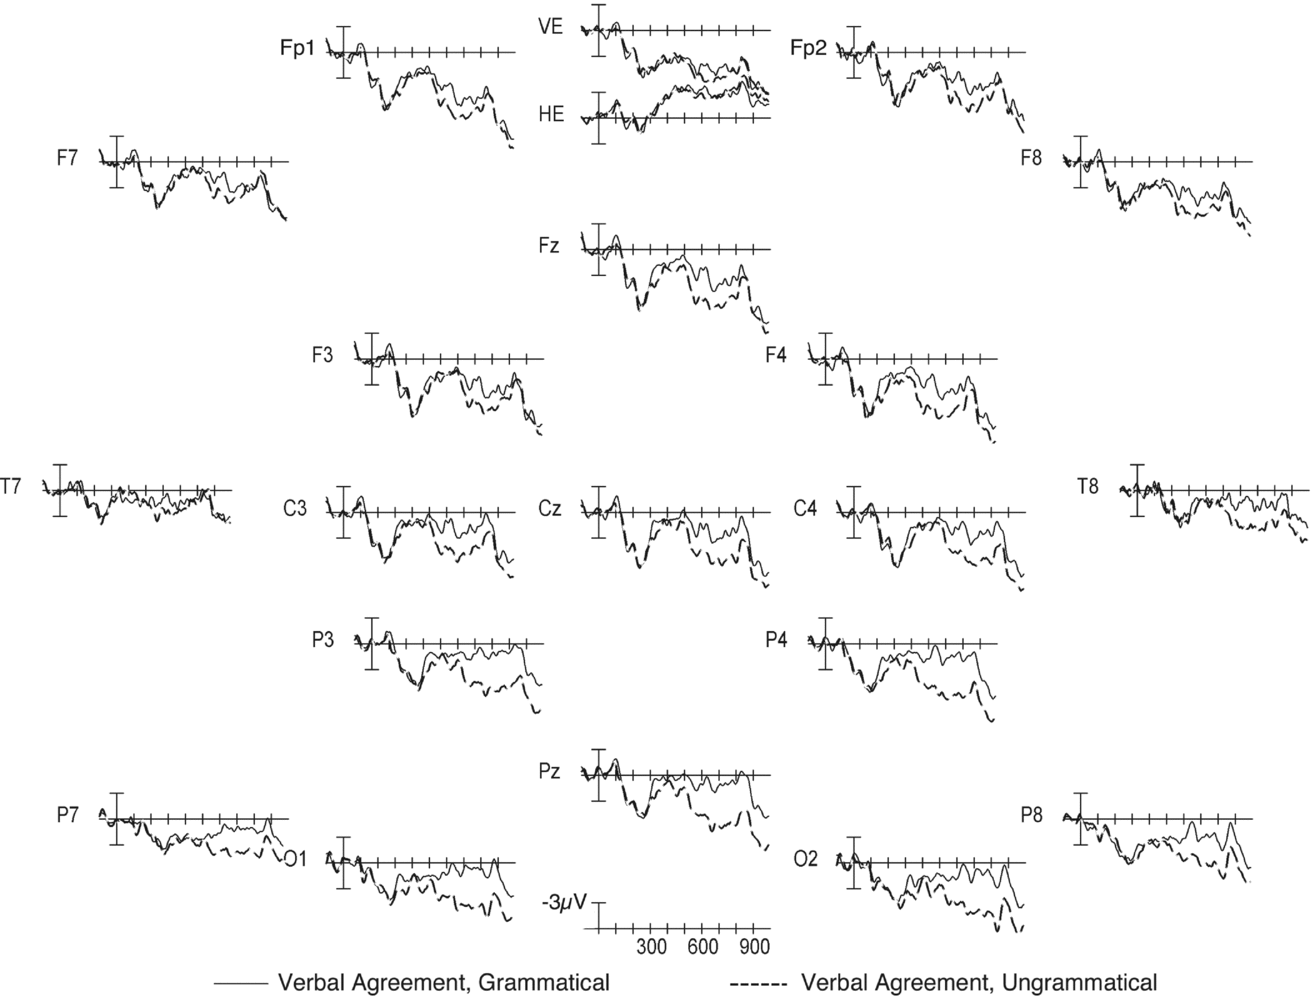
Grand mean waveforms for native speakers are plotted in Figure 1. In these and all subsequent waveforms, the general shapes of the waveforms were consistent with previous data using visually presented language stimuli (e.g., Osterhout & Holcomb, Reference Osterhout and Holcomb1992; Osterhout & Mobley, Reference Osterhout and Mobley1995). Statistical analyses of native speakers’ ERP responses showed that there were no reliable effects in the early time windows; however, there was a trend toward a main effect of grammaticality in the 300–500 ms time window [midline: F(1,12) = 3.651, MSE = 6.284, p = .080; medial–lateral: F(1,12) = 4.047, MSE = 9.992, p = .067], suggesting the onset of a positivity to ungrammatical verbs. In the 500–800 ms time window there was a significant main effect of grammaticality, indicating a P600 effect to ungrammatical verbs [midline: F(1,12) = 26.407, MSE = 6.956, p = .0003; medial–lateral: F(1,12) = 31.163, MSE = 16.473, p = .0001; lateral–lateral: F(1,12) = 19.302, MSE = 7.075, p = .0009] that was largest over posterior electrodes [grammaticality × electrode interaction, midline: F(2,24) = 3.766, MSE = 1.291, p = .045; medial–lateral: F(4,48) = 5.249, MSE = 3.329, p = .014; lateral–lateral: F(2,24) = 5.098, MSE = 0.949, p = .024]. The P600 additionally showed a slight right-hemisphere bias over lateral–lateral electrodes [grammaticality × hemisphere interaction: F(1,12) = 6.273, MSE = 1.044, p = .028].
Grand average ERP waveforms for native German speakers (n = 13) to grammatical (solid line) and ungrammatical (dashed line) verbs. Onset of the verb is indicated by the vertical bar. Calibration bar shows 3μV of activity; each tick mark represents 100 ms of time. Positive voltage is plotted down.

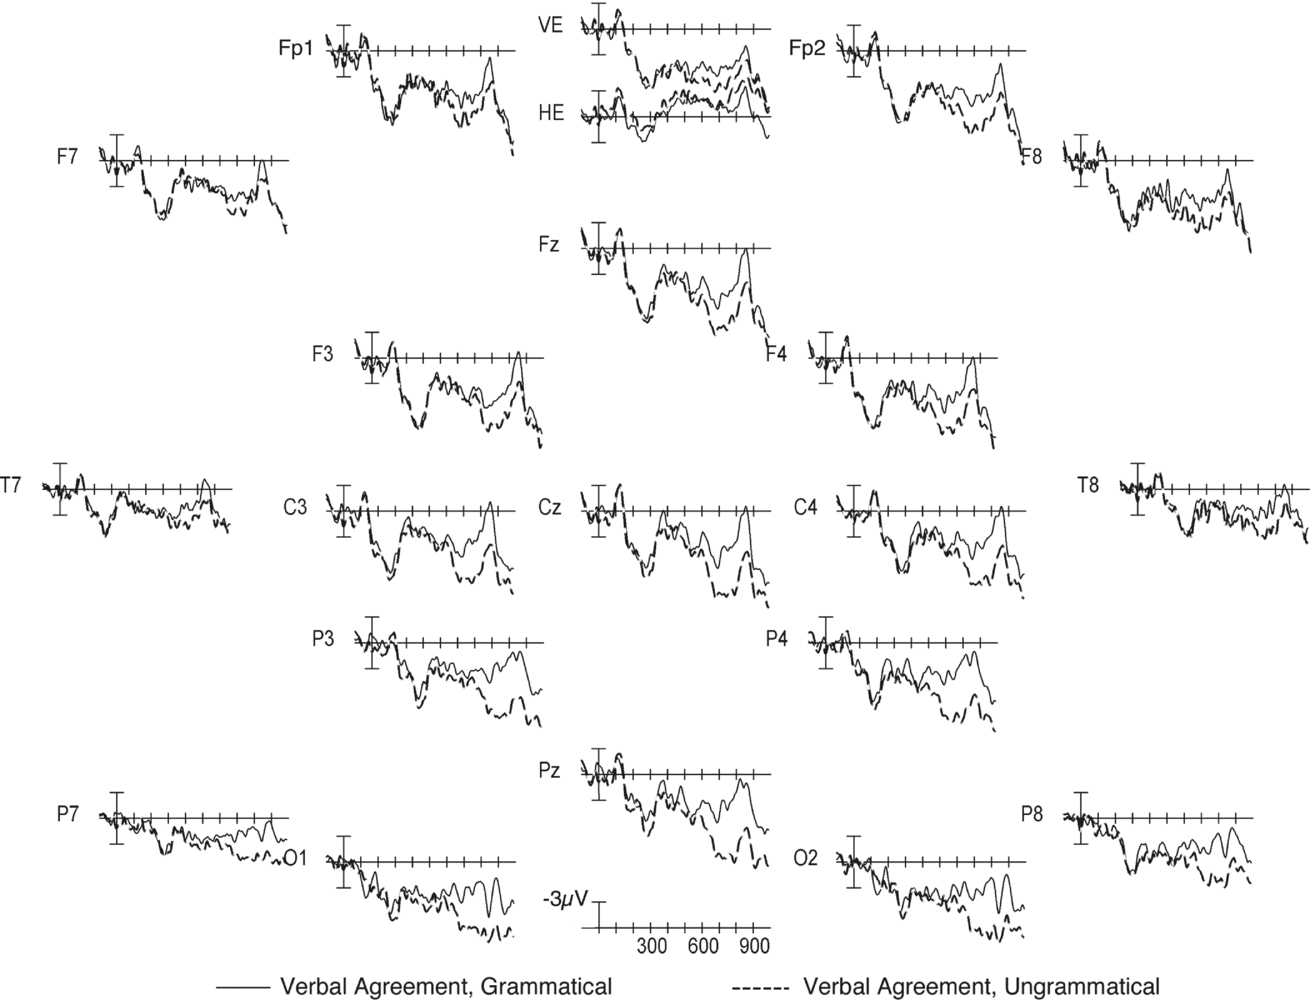
Third-year learners’ brain responses (Figure 2) showed no significant effects in the N1, P2, or N400 time windows. In the 500–800 ms time window there was a main effect of grammaticality, indicating a reliable P600 effect to violations of subject–verb agreement [midline: F(1,12) = 18.316, MSE = 9.731, p = .001; medial–lateral: F(1,12) = 22.103, MSE = 18.826, p < .0005; lateral–lateral: F(1,12) = 17.804, MSE = 5.566, p = .001]. However, there were no significant interactions with electrode or hemisphere in this time window.
Grand average ERP waveforms for learners enrolled in third-year German courses (n = 13) to grammatical (solid line) and ungrammatical (dashed line) verbs. Onset of the verb is indicated by the vertical bar. Calibration bar shows 3μV of activity; each tick mark represents 100 ms of time. Positive voltage is plotted down.

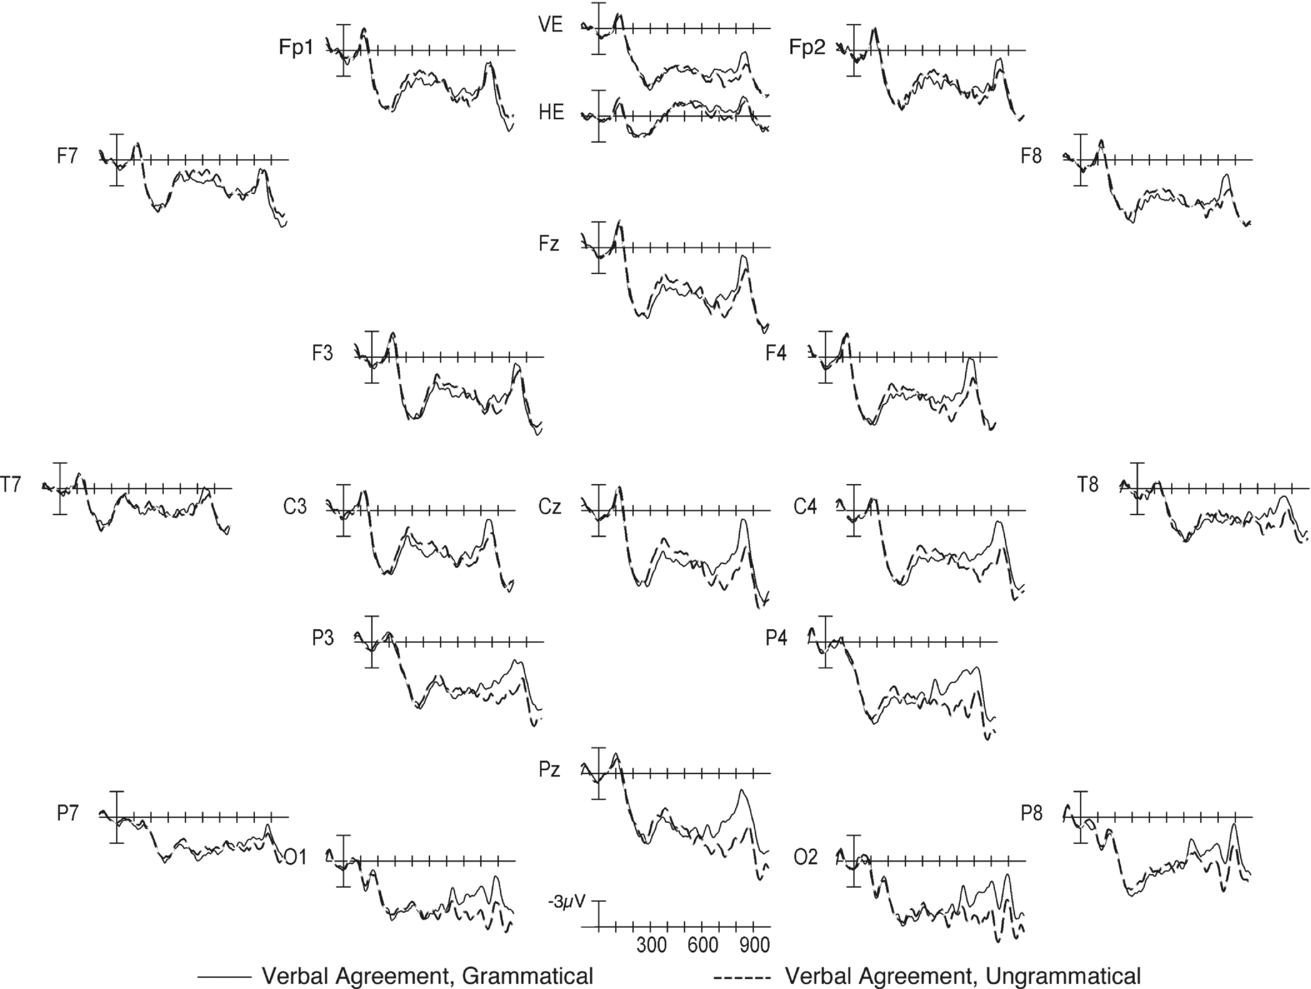
ERPs from first-year learners (Figure 3) showed no significant effects in the N1 and P2 time windows, but there was a significant main effect of grammaticality over midline electrodes and a near-significant effect over lateral sites in the 300–500 ms window, indicating an N400-like negativity to disagreeing verbs [midline: F(1,19) = 5.776, MSE = 7.251, p = .027; medial–lateral: F(1,19) = 3.759, MSE = 16.772, p = .068; lateral–lateral: F(1,19) = 3.751, MSE = 5.412, p = .068]. There were no interactions with electrode or hemisphere. This N400 was followed by a trend toward a P600 effect over midline electrodes in the 500–800 ms time window [main effect of grammaticality: F(1,19) = 3.156, MSE = 13.493, p = .092]; there were no significant or near-significant effects over medial–lateral or lateral–lateral sites. Thus, grand mean waveforms to disagreeing verbs showed a small biphasic response: ungrammatical verbs elicited a broadly distributed negativity in the 300–500 ms time window, but a small positivity in the 500–800 ms time window that did not reach full significance.
Grand average ERP waveforms for learners enrolled in first-year German courses (n = 20) to grammatical (solid line) and ungrammatical (dashed line) verbs. Onset of the verb is indicated by the vertical bar. Calibration bar shows 3μV of activity; each tick mark represents 100 ms of time. Positive voltage is plotted down.

Analyses of individuals’ ERP responses
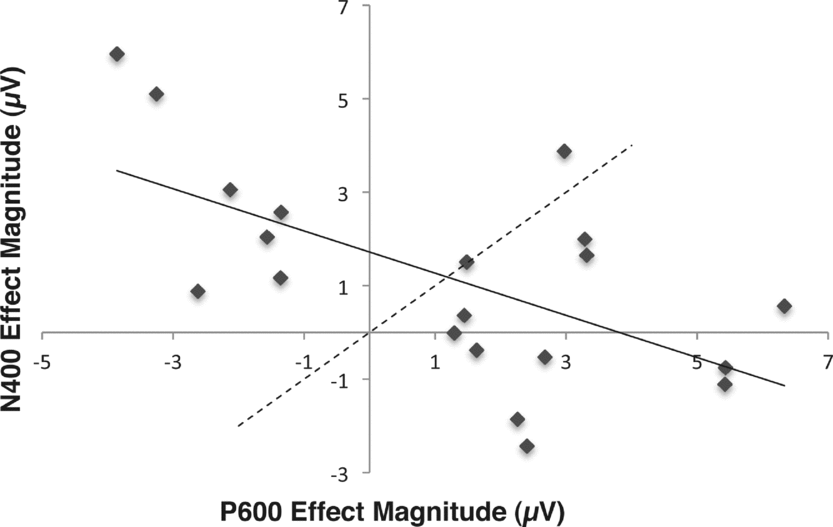
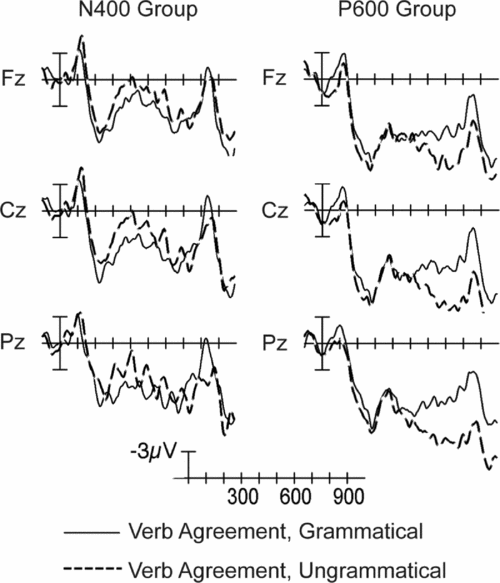
As noted above, first-year learners’ grand mean waveforms showed a small biphasic response to disagreeing verbs. However, inspection of individuals’ waveforms showed that most learners did not show this biphasic response. Rather, for most subjects the response to these words was either dominated by an enhanced N400 or by the later positivity. Following Inoue and Osterhout (Reference Inoue and Osterhout2012), we further investigated this by first computing the magnitude of the N400 and P600 effects for each individual, and then regressing the N400 effect magnitude onto that of the P600 effect for first-year learners. N400 effect magnitude was computed as mean amplitude in the 300–500 ms window in the grammatical condition minus mean amplitude in the ungrammatical condition, averaged over midline electrodes; P600 effect magnitude was computed as mean amplitude in the 500–800 ms window in the ungrammatical condition minus the mean amplitude in the grammatical condition, again averaged over midline electrodes. The two effects were significantly negatively correlated, r = –.616, p = .004. As can be seen in Figure 4, learners’ brain responses showed a similar function to that reported by Inoue and Osterhout for native speakers of Japanese processing case violations: brain responses varied along an N400–P600 continuum such that as one response increased, the other decreased. First-year learners were divided into N400 (n = 9) and P600 (n = 11) groups, based on whether the individual's response showed an N400 or P600 dominance. Grand mean waveforms for learners in the N400 group showed mild differences in the prestimulus baseline, so a corrected 50 ms prestimulus to 50 ms poststimulus baseline was used for this group. ERP responses over midline electrodes for these separate groups are shown in Figure 5. Learners in the N400 group showed a significant effect of grammaticality in the 300–500 ms time window, indicating a reliable N400 effect, F(1,8) = 10.020, MSE = 6.940, p = .013, but no significant effects in the P600 window, Fs < 1. Learners in the P600 group showed no effects over midline electrodes in the N400 time window, Fs < 1.5; however, there was a significant effect of grammaticality in the later time window, F(1,10) = 37.290, MSE = 4.609, p = .0001. Thus, the biphasic response seen in the grand mean waveform was in fact an artifact of averaging over individuals who showed qualitatively different brain responses to disagreeing verbs (see Nieuwland & Van Berkum, Reference Nieuwland and Van Berkum2008; Osterhout, Reference Osterhout1997; Osterhout & Inoue, Reference Osterhout, Frenck-Mestre, Inoue, McLaughlin, Tanner and Herschensohn2012).
Scatterplot showing the distribution of N400 and P600 effect magnitudes across first-year learners, averaged across three midline electrodes (Fz, Cz, and Pz). Each dot represents a data point from a single learner. The solid line shows the best-fit line for the data from the regression analysis. The dashed line represents equal N400 and P600 effect magnitudes and shows where learners were divided into groups: individuals above/to the left of the dashed line showed primarily an N400 effect to German verb agreement violations, while individuals below/to the right of the dashed line showed primarily a P600 effect.

ERPs over midline electrodes to grammatical (solid line) and ungrammatical (dashed line) verbs for first-year learners who showed either N400-dominant (left panel; n = 9) or P600-dominant (right panel; n = 11) brain responses. Onset of the verb is indicated by the vertical bar. Calibration bar shows 3 μV of activity; each tick mark represents 100 ms of time. Positive voltage is plotted down.

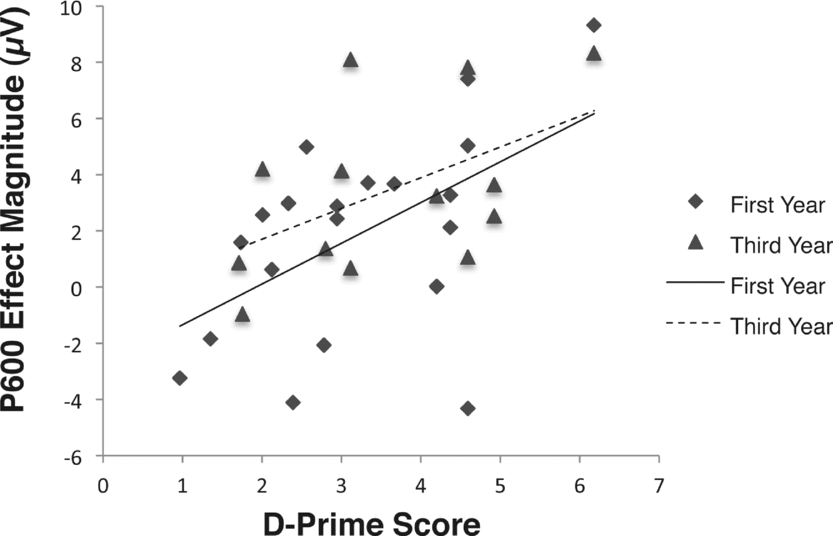
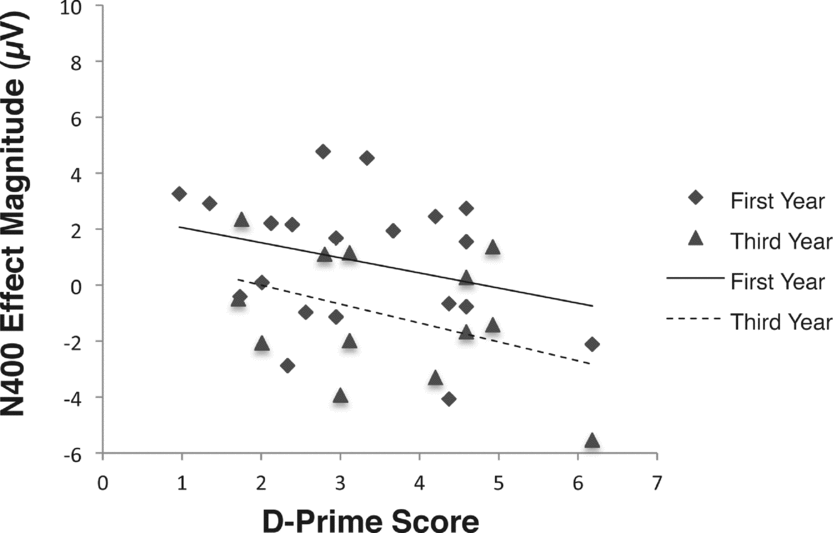
In order to investigate what factors may have been important in predicting the type and magnitude of response learners showed to disagreeing verbs, we conducted a series of correlation analyses using individuals’ N400 and P600 effect magnitudes over electrode Pz, where ERP effects were the largest. First-year learners’ P600 effect magnitudes were reliably correlated with d-prime scores, r = .532, p = .016; for third-year learners the correlation neared significance, r = .504, p = .079; and for all learners (first- and third-year) combined the correlation was highly significant, r = .534, p = .001 (Figure 6). Thus, learners’ P600 effect magnitudes increased linearly with their ability to detect agreement anomalies. For native speakers there was no relationship between d-prime and P600 amplitude, r = .274, p = .344. Since learners’ P600 responses were associated with better performance in the acceptability judgment task, it is also possible that N400 responses were associated with poorer performance. Correlations did not reach significance for first-year learners, r = –.297, p = .204; third-year learners, r = –.406, p = .169; or native speakers, r = –.322, p = .261. However, the correlation for all learners combined was weak, but did reach statistical significance, r = .367, p = .036 (Figure 7). In this time window enhanced negativities to ungrammatical verbs were associated with poorer performance in the acceptability judgment task.
Correlation between P600 effect magnitude and d-prime scores from the acceptability judgment task for all learners. P600 effect magnitude is quantified as mean amplitude in 500–800 ms time window over Pz in the ungrammatical minus grammatical condition. More positive values on the y-axis reflect larger P600 effects.

Correlation between N400 effect magnitude and d-prime scores from the acceptability judgment task for all learners. N400 effect size is quantified as mean amplitude between 300–500 ms time window over Pz in the grammatical minus ungrammatical condition. More positive values on the y-axis reflect larger N400 effects.

In a study of word learning in L2 French, McLaughlin and colleagues (McLaughlin, Osterhout & Kim, Reference McLaughlin, Osterhout and Kim2004) found that learners’ individual N400 amplitudes to French-like pseudowords were highly correlated with the number of hours of instruction the subjects had been exposed to during the first quarter of classroom French instruction. In order to test for a similar correlation in the current data, the number of hours of classroom exposure was computed for all first-year learners. There was no correlation between hours of exposure and amplitude difference over any of the midline electrodes in the N400 or in the P600 time window. Moreover a regression model including d-prime score as an independent variable and P600 magnitude at Pz as the dependent variable was significant, R2Adjusted = .243, F(1,18) = 7.098, p = .016; a model including both d-prime score and hours of instruction only neared significance, R2Adjusted = .198, F(2,17) = 3.352, p = .059. Whereas d-prime scores alone account for approximately 24% of the variance in P600 effect magnitude, including hours of instruction as an independent variable actually removed predictive power from the overall model. Partial correlations in the second model show that after controlling for effects of d-prime score, there was no relationship between hours of instruction and P600 magnitude, r = .004, while d-prime remained significant after controlling for hours of instruction, r = .514, p = .02. No regression model including d-prime score, hours of instruction, or a combination of the two accounted for a significant portion of the variance in N400 amplitudes. It therefore seems that the variation in individuals’ brain responses is more a function of grammatical learning than pure classroom exposure.
A further issue is the relationship between participants’ end-of-sentence judgments and their online brain responses. One possibility is that the correlation between d-prime scores and P600 magnitude might reflect a scenario where individuals who performed more poorly on the grammaticality judgment task showed a smaller P600 effect on any given trial than those who performed better. Alternately, participants might show a full P600 on any trial when they recognized the agreement error, but no P600 on the other trials; the result after averaging would then be that those who recognized fewer errors (and who had lower d-prime scores) would show smaller average P600 effects. Moreover, it is also possible that correctly- and incorrectly-judged trials elicited qualitatively different ERP effects, such that incorrectly judged ungrammatical trials would elicit an N400, while correctly judged ungrammatical trials would elicit a P600 effect. The net result would be that those who show poorer judgment performance would show an N400-dominant brain response, whereas those who show better judgment would show a P600-dominant response.
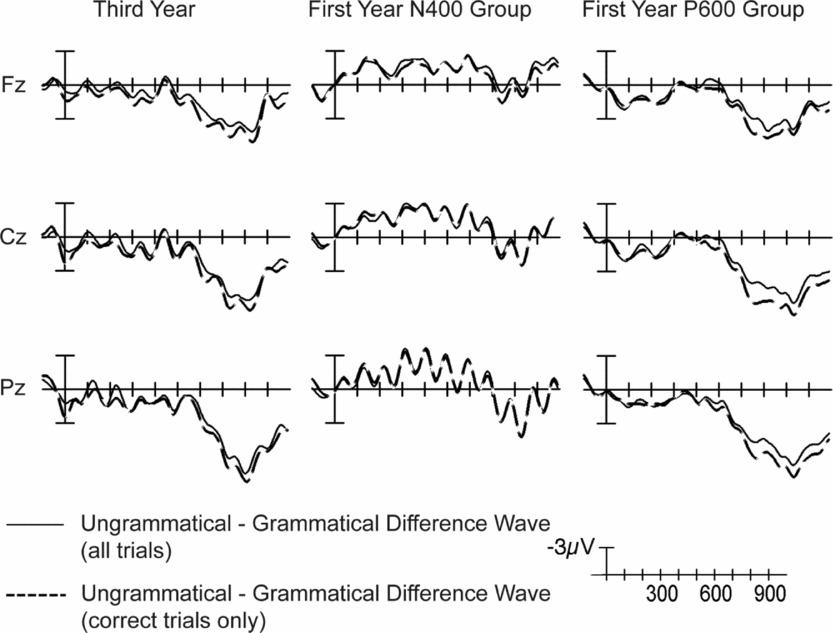
To investigate these possibilities, we computed response-contingent averages, including only those trials which were ultimately judged correctly by the participants. Difference waveforms comparing all-trial averages and response-contingent averages for third-year learners and first-year learners in the N400- and P600-dominant groups are shown in Figure 8. As can be seen, the two sets of averages show very similar effects of the grammaticality manipulations. N400 and P600 effect magnitudes in the all-trial and response-contingent averages were nearly perfectly correlated within learners (N400 effect magnitude: r = .907, p < .000001; P600 effect magnitude: r = .969, p < .000001). Additionally, the correlation between d-prime scores and P600 magnitude for all learners remained significant even when including only correctly-judged trials in the ERP averages, r = .494, p = .004. Overall this indicates that N400 effects were not driven only by incorrectly-judged trials, as the N400 effects remained robust even when considering only correctly-judged trials. The remaining correlation between d-prime and P600 magnitude also indicates that the full P600 on correctly-judged trials/no P600 on incorrectly-judged trials account is incorrect. Nonetheless, this does not unequivocally show that P600 effects on any given trial were consistently smaller across all trials in those with lower d-prime scores. Indeed, the linear change in P600 magnitude may still have been driven by cross-trial differences in effect amplitude. The present results simply indicate that these differences were not directly associated with an individual's eventual judgment about a given sentence (see McLaughlin et al., Reference McLaughlin, Osterhout and Kim2004; Tokowicz & MacWhinney, Reference Tokowicz and MacWhinney2005, for evidence of dissociations between on-line brain responses and off-line judgments). Future research on trial-level modeling of brain responses may shed light on this issue (see Zayas, Greenwald & Osterhout, Reference Zayas, Greenwald and Osterhout2010).
Grand average difference waves for the ungrammatical minus grammatical conditions, comparing effect sizes for the all-trial and response-contingent analyses. Positive or negative deviations from zero indicate a positivity or negativity in the ungrammatical condition relative to the grammatical condition, respectively. Difference waveforms were filtered with a 10 Hz low-pass filter for presentation purposes. Onset of the verb is indicated by the vertical bar. Calibration bar shows 3 μV of activity; each tick mark represents 100 ms of time. Positive voltage is plotted down.

Discussion
The study reported here investigated morphosyntactic processing in native German speakers and in English-speaking university students enrolled in their first or third year of German instruction. Our most striking finding was the existence of systematic individual differences in the learners’ ERP responses to subject–verb agreement anomalies. These anomalies elicited an N400 effect in some learners and a P600 effect in others. The amplitudes of these effects were negatively correlated across learners, and accuracy in the sentence-acceptability judgment task predicted the amplitude of the ERP response to ungrammatical stimuli, with greater accuracy being associated with more positive-going brain activity throughout the N400 and P600 windows.
Prior work has shown that individuals differ with respect to working memory capacity, vocabulary knowledge, neural efficiency, and in many other ways that could impact language processing (Prat, Reference Prat2011). One possibility, therefore, is that the individual differences among the German learners reflect durable subject variables (i.e., “traits”) that persist over time. If so, then the individual differences observed here might be expected to persist even as the learner becomes more proficient in the L2. An alternative possibility, however, is that learners were progressing between two distinct processing stages (as manifested in the N400 and P600 responses to morphosyntactic anomalies), and that individual learners varied with respect to the rate of transition between the two stages. A compelling test of these different interpretations requires a longitudinal design that tracks learners over an extended period of L2 instruction. Some relevant evidence is provided by a longitudinal ERP study of first-year French learners (Osterhout et al., Reference Osterhout, Frenck-Mestre, Inoue, McLaughlin, Tanner and Herschensohn2012; see McLaughlin et al., 2010; Osterhout et al., Reference Osterhout, McLaughlin, Pitkänen, Frenck-Mestre and Molinaro2006, for preliminary reports; see also Morgan-Short et al., Reference Morgan-Short, Sanz, Steinhauer and Ullman2010; Morgan-Short et al., Reference Morgan-Short, Faretta, Brill, Wong and Wong2012, for similar findings from an artificial language learning study). ERPs were recorded to violations of French subject–verb agreement. Most learners responded to these anomalies with an N400 effect after about one month of L2 instruction and a P600 effect after about seven months of instruction. When tested during the middle of the instructional period (after about four months of instruction), the grand average ERP revealed a small-amplitude biphasic N400–P600 effect. Inspection of individual subjects’ ERPs showed that the grand average obscured robust individual differences, such that some learners showed an N400 effect and others a P600 effect to the same set of agreement anomalies. Learners’ N400 and P600 effect magnitudes were negatively correlated at each testing session.
Collectively, the evidence seems to indicate that individual learners progress through distinct stages of learning, but that the rate of progression varies across learners. An important goal is to characterize the functional significance of the developmental stages. Whereas the current state of the field does not allow one to draw a direct link between a given ERP effect and a specific underlying cognitive or linguistic process, some parallels exist between claims in the broader psycholinguistics literature and the pattern of results obtained here. For example, some have argued that although native speakers typically compute detailed syntactic representations, they may sometimes use shallow (or ‘good enough’) processing heuristics instead of full syntactic parses during language comprehension in complex syntactic situations, such as passive constructions and garden path sentences (Christianson, Reference Christianson2008; Christianson, Hollingworth, Halliwell & Ferreira, Reference Christianson, Hollingworth, Halliwell and Ferreira2001; Ferreira, Bailey & Ferraro, Reference Ferreira, Bailey and Ferraro2002). Theorists have proposed a link between the use of a shallower, heuristic or lexical processing stream and a deeper, rule-based or combinatorial processing stream, and the N400 and P600 components, respectively (Kuperberg, Reference Kuperberg2007; Severens, Jansma & Hartsuiker, Reference Severens, Jansma and Hartsuiker2008; Tanner, Reference Tanner2011). One possibility is that novice L2 learners were more reliant on these shallower lexical or probabilistic processing heuristics than native speakers and more advanced learners for even simple grammatical relations, like agreement. The shift to a P600-dominant response might reflect the gradual development of a more abstract, rule-based processing stream for L2 grammar, as is typically employed by L1 speakers in these constructions. The additional negative correlation between the N400 and P600 effect magnitudes might be explainable in terms of processing models which posit a “competitive dynamic” between the two streams (Jackendoff, Reference Jackendoff2007; Kim & Osterhout, Reference Kim and Osterhout2005; MacWhinney, Bates & Kliegl, Reference MacWhinney, Bates and Kliegl1984).
The current data also share some features with predictions made by Ullman's Declarative/Procedural (D/P) model (Ullman, Reference Ullman2001, Reference Ullman2004, Reference Ullman and Sanz2005). For example, the N400 effect elicited by morphosyntactic violations in early-stage L2 acquisition is compatible with the D/P model's prediction that both grammatical and lexical processing in novice learners will show heavy reliance on the declarative memory system. With increasing proficiency, grammatical processing should then show increased reliance on the procedural memory system. However, Ullman argues that use of procedural memory will be indexed by a LAN effect in response to grammatical anomalies. LANs were not found in any group (learners or native) in this study. Moreover, LAN effects are missing in native speakers in many studies of syntactic processing (e.g., Ainsworth-Darnell et al., Reference Ainsworth-Darnell, Shulman and Boland1998; Allen, Badecker & Osterhout, Reference Allen, Badecker and Osterhout2003; Frenck-Mestre et al., Reference Frenck-Mestre, Osterhout, McLaughlin and Foucart2008; Hagoort, Reference Hagoort2003; Hagoort & Brown, Reference Hagoort and Brown1999; Hagoort et al., Reference Hagoort, Brown and Groothusen1993; Kaan, Reference Kaan2002; Nevins, Dillon, Malhotra & Phillips, Reference Nevins, Dillon, Malhotra and Phillips2007; Severens et al., Reference Severens, Jansma and Hartsuiker2008), so it is difficult to interpret the absence of this effect in the current study as reflecting incomplete grammatical acquisition or deficient processing in our more advanced learners or native speakers. More research is needed to precisely identify the experimental conditions under which LAN effects are reliably elicited.
The qualitative change in processing seen in early-stage L2 learners is incompatible with some recent proposals about L2 processing (Clahsen & Felser, Reference Clahsen and Felser2006; Clahsen, Felser, Neubauer, Sato & Silva, Reference Clahsen, Felser, Neubauer, Sato and Silva2010). Clahsen and colleagues argue that L2 learners are restricted to the shallower, ‘good enough’ parses that are sometimes available to native speakers, regardless of L2 proficiency or L1–L2 pairing. However, the current data indicate that adult L2 learners can move beyond shallow processing heuristics and develop deeper grammatical processing strategies within only a few months of classroom instruction. Moreover, L2 proficiency can have an effect on a learner's depth of processing, as a relative reliance on the shallower lexical/heuristic or deeper grammatical/combinatorial processing stream was associated with behavioral measures of grammatical learning in the current study. The data reported here provide strong evidence that learners at different stages of development use qualitatively different processing streams to deal with L2 grammatical information, and are consistent with longitudinal findings that individuals may shift dominance from one stream to the other as their L2 competence increases over time (see McLaughlin et al., Reference McLaughlin, Tanner, Pitkänen, Frenck-Mestre, Inoue, Valentine and Osterhout2010; Steinhauer et al., Reference Steinhauer, White and Drury2009, for further discussion about the possible functional significance of the N400–P600 shift).
In the present study, effect magnitude correlated with accuracy in the grammaticality judgment task for L2 learners. The relationship between effect magnitude and d-prime is reminiscent of that reported by Pakulak and Neville (Reference Pakulak and Neville2010), who found that participants’ P600 effect magnitudes were linearly related to their proficiency in L1 English. Our findings are also consistent with suggestions made by Steinhauer and colleagues (Steinhauer et al., Reference Steinhauer, White and Drury2009; see also van Hell & Tokowicz, Reference van Hell and Tokowicz2010) that increasing L2 proficiency co-occurs with a more L1-like profile of ERP responses to L2 anomalies. However, this result might not generalize to all situations or populations of language learners. Recent results from our lab show a similar profile of brain responses in high-proficiency late L1-Spanish–L2-English bilinguals with long-term L2 immersion as seen here in novice L2 learners (Tanner, Inoue & Osterhout, Reference Tanner, Inoue and Osterhout2012; see also Tanner, Reference Tanner2011). Instead of proficiency, motivation provided the strongest correlate of brain response type in that study. However, there are several demographic differences between the Spanish–English bilinguals and the novice learners in the current study, including age of acquisition and amount of L2 exposure. Also, the types of linguistic input received by immersed versus classroom L2 learners may have had an impact on brain response profiles. More research is needed in order to identify how input and other individual-level variables interact in shaping L2 learning and processing (see e.g., Morgan-Short, Faretta, Brill, Wong & Wong, Reference Morgan-Short, Faretta, Brill, Wong and Wong2012). Language proficiency may therefore be one of many factors responsible for determining the neural substrates of syntactic processing (Prat, Reference Prat2011).
Finally, the present findings compellingly illustrate the dangers inherent in the exclusive use of grand-average ERPs to characterize L2 sentence processing. In some cases a thorough investigation of between-learner variability can be more informative than inspection of grand mean waveforms. Our results add to results from the lexico-semantic processing domain showing that regression-based statistical methods can be used on ERP data to model individual difference profiles (Moreno & Kutas, Reference Moreno and Kutas2005; Newman et al., Reference Newman, Tremblay, Nichols, Neville and Ullman2012; Ojima et al., Reference Ojima, Matsuba-Kurita, Nakamura, Hoshino and Hagiwara2011). However, our strongest predictor of brain responses, namely d-prime scores, was an experiment-internal variable. A logical next question is what other variables may be at play in predicting how quickly novice learners grammaticalize L2 features (i.e., how quickly they move from N400 to P600 responses to subject–verb agreement violations), or what factors predict the magnitude of ERP effects at higher levels of proficiency. Behavioral research has long noted correlations between learning measures and certain cognitive and affective variables. It remains to be seen how these variables map onto the neurocognitive correlates of learning that we report here (see Bond et al., Reference Bond, Gabriele, Fiorentino, Alemán Bañón, Tanner and Herschensohn2011, for a first attempt to link individuals’ specific language aptitude and non-verbal reasoning ability with L2 ERP effects). Nonetheless, the approach taken here demonstrates that ERPs provide a valuable tool for understanding individual factors in L2 grammatical learning, and encourage us to hope that future research will elucidate determinants of the rate and success of L2 acquisition.