1. Introduction
Knowledge of the provenance of ancient clastic sedimentary rocks is important for mineral exploration and basin analysis, as well as for palaeotectonic reconstructions. Minor amounts of heavy minerals such as zircon, rutile, tourmaline, garnet, epidote and chromian spinel (Cr-spinel) are commonly contained in clastic sedimentary rocks. Geochemical and heavy mineral associations of specific detrital minerals are powerful tools in provenance characterization, especially in deciphering the timing of erosion or the tectonic setting of source terrains. Major- and trace-element and isotopic signatures of most of the heavy minerals mentioned above have been used as provenance indicators (e.g. Pober & Faupl, Reference Pober and Faupl1988; Morton, Reference Morton, Morton, Todd and Haughton1991; von Eynatten & Gaupp, Reference von Eynatten and Gaupp1999; Sircombe, Reference Sircombe1999; Faupl et al. Reference Faupl, Petrakakis, Migiros and Pavlopoulos2002; Spiegel et al. Reference Spiegel, Siebel and Frisch2002).
Archaean cratons preserve a record of crustal evolution processes of the primordial Earth, and metasediments of the Archaean provinces preserve remnants of the crust that are no longer exposed on the Earth’s crust. However, such rocks have experienced protracted metamorphic-deformational-alteration events making it difficult to understand the evolution of the early continental areas. Resistant minerals such as zircon, rutile, chromite, etc. associated with the Archaean metasediments are ideal materials as the isotopic and geochemical tracers incorporated in these phases can survive multiple geological processes. Detrital zircon from Archaean metasediments has been used to delineate the regional and geochronological history of such provinces (e.g. Gerdes & Zeh, Reference Gerdes and Zeh2006; Zeh & Gerdes, Reference Zeh and Gerdes2012; Maibam et al. Reference Maibam, Gerdes and Goswami2016). During the past decade, numerous U–Pb dating studies have been conducted on granitoid rocks of the Dharwar Craton using modern microbeam techniques (ion probe and laser ablation multi-collector/quadrupole inductively coupled plasma mass spectrometry (LA-MC/Q-ICP-MS)). Although isotopic age datasets have outlined the geochronological framework of the formation and evolution of the Archaean gneissic continental crust of the Dharwar Craton (Maibam et al. Reference Maibam, Goswami and Srinivasan2011, Reference Maibam, Gerdes and Goswami2016, Reference Maibam, Gerdes, Srinivasan and Goswami2017; Lancaster et al. Reference Lancaster, Dey, Storey, Mitra and Bhunia2015; Guitreau et al. Reference Guitreau, Mukasa, Loudin and Krishnan2017), the provenance study of metasediments of the Archaean supracrustal units is lacking.
Combined in situ U–Pb and Hf isotopic studies of zircon are ideal for providing provenance information and for giving insight into regional crustal growth, providing an overview of magmatism/metamorphism of igneous/metamorphic rocks of different ages over a large area (e.g. Cawood et al. Reference Cawood, Nemchin, Leverenz, Saeed and Ballance1999, Reference Cawood, Hawkesworth and Dhuime2012; Wang et al. Reference Wang, Zhou, Yan, Li and Malpas2013). The Hf isotope composition of zircons is a sensitive tracer for sediment provenance (Kinny & Maas, Reference Kinny and Maas2003; Howard et al. Reference Howard, Hand, Barovich, Reid, Wade and Belousova2009) and is not usually affected by post-crystallization thermal disturbance, so it provides an accurate record of whether the zircons formed during juvenile additions to the crust or are derived from reworked crust, or a combination of the two. The age spectra of the grains and the Hf isotope composition allow comparison with the geochemical characteristics of potential source terrains.
Cr-spinel is a common mineral in mafic and ultramafic rocks, and its chemical composition is influenced by the geodynamic environment of its formation, enabling its use as a petrogenetic indicator (e.g. Irvine, Reference Irvine1967; Dick & Bullen, Reference Dick and Bullen1984; Allan et al. Reference Allan, Sack and Batiza1988; Sack & Ghiorso, Reference Sack and Ghiorso1991; Roeder, Reference Roeder1994; Barnes & Roeder, Reference Barnes and Roeder2001; Zhu et al. Reference Zhu, Kidd, Rowley, Brian and Currie2004). Although the composition of Cr-spinel depends on the geotectonic setting, it is also strongly dependent on processes that occur within a single geotectonic regime. Cr-spinel also occurs as a detrital component in sedimentary rocks, in which the chemical durability and varied geochemical fingerprints of the spinel reflect the origin of the parent rock and allow the identification of a specific provenance. Cr-spinel is mechanically stable, preserves its compositional signature against weathering and diagenesis (Mange & Morton, Reference Mange, Morton, Mange and Wright2007) and is easy to recognize in both transmitted and reflected light (Cookenboo et al. Reference Cookenboo, Bustin and Wilks1997), enabling its widespread use in provenance studies and palaeotectonic reconstruction (Utter, Reference Utter1978; Press, Reference Press1986; Pober & Faupl, Reference Pober and Faupl1988; Arai & Okada, Reference Arai and Okada1991; Cookenboo et al. Reference Cookenboo, Bustin and Wilks1997; Sciunnach & Garzanti, Reference Sciunnach and Garzanti1997; Lenaz et al. Reference Lenaz, Kamenetsky, Crawford and Princivalle2000, Reference Lenaz, Kamenetsky and Princivalle2003, Reference Lenaz, Mazzoli, Spišiak, Princivalle and Maritan2009 b).
In this study, we present U–Pb and Hf isotope datasets for detrital zircons and a geochemical and crystal chemical study of detrital Cr-spinels from the Banavara quartzite, which forms part of the Sargur Group, a supracrustal unit of the Dharwar Craton. We use this data to decipher the probable provenance of the sediments and the tectono-magmatic evolution of the Dharwar Craton.
2. Geological background
2.a. Geological setting of the area
The Dharwar Craton comprises vast areas of tonalitic–trondhjemitic–granodioritic (TTG) gneisses (3.36–2.7 Ga, regionally known as Peninsular Gneisses) and two generations of volcanic–sedimentary greenstone sequences (>3.0 Ga Sargur Group and 2.9–2.6 Ga Dharwar Supergroup). The craton is sub-divided into two parts viz. the Western Dharwar Craton (WDC) and the Eastern Dharwar Craton (EDC) based on the nature and abundance of greenstones as well as the age of their surrounding basement and degree of regional metamorphism (Swami Nath et al. Reference Swami Nath, Ramakrishnan and Viswanatha1976). Maibam et al. (Reference Maibam, Goswami and Srinivasan2011) showed widespread occurrence of Archaean (>3.0 Ga) crustal components in the EDC that suggests that crust formation in both the WDC and EDC took place during Mesoarchaean time (>3.3 Ga) and continued until 2.5 Ga.
The Meso- to Neoarchaean lithostratigraphic sequence of the Dharwar Craton, southern India, consists of the Sargur Group and the Dharwar Supergroup (Swami Nath & Ramakrishnan, Reference Swami Nath and Ramakrishnan1981). The supracrustal rocks of the Sargur Group comprise a range of metasedimentary rocks: fuchsite and muscovite quartzites ± graphite, psammopelites (kyanite/sillimanite ± garnet ± graphite schists), calc-silicate rocks and marbles, and banded iron formation (BIF). They are associated with metamorphosed ultramafic rocks (some komatiite), gabbros and anorthosites (Viswanatha & Ramakrishnan, Reference Viswanatha, Ramakrishnan, Swami Nath and Ramakrishnan1981). Ramakrishnan (Reference Ramakrishnan2009) divided the Sargur Group into two types of lithological associations (i) linear ultramafic-mafic belts containing subordinate clastic sediments and BIF (e.g. Nuggihalli, Nagamangala and Krishnarajpet) and (ii) scattered ultramafic-mafic enclaves associated with a quartzite–carbonate–pelite–BIF assemblage (e.g. Sargur and Mercara). On the basis of the first U–Pb SHRIMP data for detrital zircons from quartzites of the Sargur Group near Holenarasipur and Banavara, Nutman et al. (Reference Nutman, Chadwick, Ramakrishnan and Viswanathan1992) suggested that the sedimentary protoliths of the quartzite were derived from 3.58–3.13 Ga granitoid rocks and attributed a younger population of 3.13–2.9 Ga to the effects of high-grade metamorphism associated with the emplacement of the Peninsular Gneiss. Lancaster et al. (Reference Lancaster, Dey, Storey, Mitra and Bhunia2015) also showed that the Sargur Group metasediments were supplied by a 3580–3130 Ma provenance. Jayananda et al. (Reference Jayananda, Kano, Peucat and Channabasappa2008) and Maya et al. (Reference Maya, Bhutani, Balakrishnan and Rajee Sandhya2017) reported 3.35 and 3.15 Ga ages for komatiitic rocks of the Sargur Group. Pb−Pb zircon and Rb−Sr whole-rock ages for gneisses from the Gorur–Hassan area (Naha et al. Reference Naha, Srinivasan, Gopalan, Pantulu, Subba Rao, Vrevsky and Bogomolov1993; Peucat et al. Reference Peucat, Mahabaleshwar and Jayananda1993) are generally higher, in the range 3300 to 3100 Ma (3.3−3.1 Ga). An overprint of a secondary event at ~2900−2800 Ma (2.9−2.8 Ga) has been inferred from zircon data for both gneisses and metasediments of the adjoining Nuggihalli schist belt (Maibam et al. Reference Maibam, Deomurari and Goswami2003).
Radhakrishna (Reference Radhakrishna, Naqvi and Rogers1983) suggested the Sargur supracrustal rocks were sediments deposited in volcanically active shallow basins. The clastic metasediments (quartzites) are characterized by cross-bedding. Ramiengar et al. (Reference Ramiengar, Devadu, Viswanatha, Chayapathi and Ramakrishnan1978) suggested a detrital nature for the quartzite on the basis of the presence of current-bedding in some of the quartzites. Based on the cross-bedding, palaeocurrent and other sedimentary evidence, Naha et al. (Reference Naha, Srinivasan and Jayaram1991) suggested a fluvial origin for the quartzites.
The division of the Dharwar supracrustal sequence into the Sargur Group (older than 3.0 Ga) and Dharwar Supergroup (3.0–2.55 Ga) contradicts an alternative view that the Sargur Group rocks correspond to rocks of the Dharwar Supergroup together with some older rocks (Ramakrishnan, Reference Ramakrishnan, Ravindra and Ranganathan1994; Srinivasan & Naha, Reference Srinivasan, Naha and Saha1996). The Sargur Group has been considered to be the oldest group in the Archaean sequence of the Dharwar Craton (Ramakrishnan & Vaidyanathan, Reference Ramakrishnan and Vaidyanathan2008) and is assigned an age older than 3.0 Ga, whereas the rocks of the Dharwar Supergroup, consisting of the Dharwar greenstone belts, are younger and were deposited between 3.0 and 2.55 Ga.
The Dharwar greenstone belt rocks are metamorphosed at greenschist to lower amphibolite facies, whereas the Sargur Group was metamorphosed under upper amphibolite to lower granulite facies (e.g. Viswanatha & Ramakrishnan, Reference Viswanatha, Ramakrishnan, Swami Nath and Ramakrishnan1981). Among the major mafic-ultramafic bodies are Holenarasipur, Nuggihalli, Krishnarajpet and Jayachamarajapura. In the Nuggihalli schist belt komatiite affinity chromite seams occur as layers, irregular tabular or lensoid bodies in serpentinized ultramafic rocks (Bidyananda & Mitra, Reference Bidyananda and Mitra2005). Combined single crystal X-ray refinement and Mössbauer spectroscopy study show that the Nuggihalli chromites were not affected by metamorphism (Lenaz et al. Reference Lenaz, Andreozzi, Mitra, Bidyananda and Princivalle2004).
Ramakrishnan (Reference Ramakrishnan2009) and Chadwick et al. (Reference Chadwick, Ramakrishnan, Vasudev and Viswanatha1989) suggested that the Dharwar Supergroup consists of three lithological packages: (1) the Bababudan Group comprising quartz-pebble conglomerate, amygdular metabasalt alternations, felsic volcanic rocks and BIF; (2) the Chitradurga Group classified into (a) the Vanivilas Subgroup, including polymict conglomerate, quartzite, pelite, carbonate and manganese-iron formations, and (b) the Ingaldhal Subgroup, comprising pillowed metabasalts, felsic volcanic rocks and BIF; and (3) the Ranibennur Subgroup composed of greywacke turbidite, polymict conglomerate and a BIF horizon. A generalized stratigraphical sequence of the Dharwar Craton is presented in online Supplementary Material Table S1.
The supracrustal enclave near the Banavara area is ~10 km2. The lithounit comprises fuchsite quartzite, metapelite, ironstone and ultramafic rocks. Varieties of porphyry granites (grey to pink colour) cross-cut the supracrustal units. Younger dolerite dykes cross-cut the rock units. Although primary sedimentary features, cross-bedding, etc. are reported from other metasedimentary units of the Sargur Group, the studied sample does not show any such features, probably owing to intense deformational and metamorphic recrystallization (Ramiengar et al. Reference Ramiengar, Devadu, Viswanatha, Chayapathi and Ramakrishnan1978).
2.b. Sample description
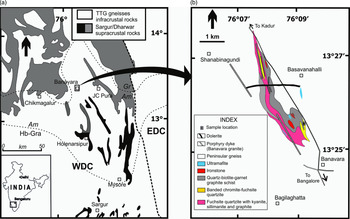
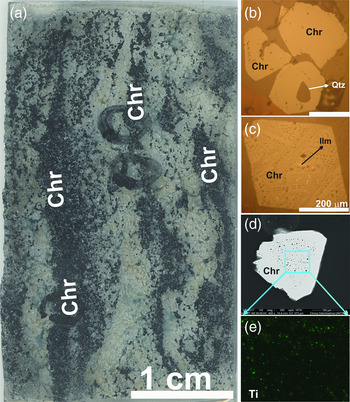
Clastic metasediments are an indispensable rock unit of the Sargur Group. However, Cr-spinels are associated with select quartzite exposures. We have deliberately sampled the Cr-spinel-bearing layered fuchsite quartzite to carry out a combined detrital zircon and Cr-spinel provenance study. The studied sample was collected from the Bangaluru–Honnavara Highway near Banavara (13° 25.322′ N, 76° 09.085′ E; Fig. 1). The chromite-bearing fuchsitic quartzites are 2 to 3 m thick and are intercalated with amphibolites, ultramafic rocks and schistose rocks. The supracrustal rocks occur as enclaves within the Peninsular Gneiss. Cr-spinel makes up 5 to 15 % of the studied sample. Representative photomicrographs of the studied sample are presented in Figure 2 and a scan image of the thin-section presented in Figure 3a.
(a) Geological map of the Dharwar Craton (modified from Peucat et al. Reference Peucat, Mahabaleshwar and Jayananda1993). (b) Geological map of the Banavara area (after Ramiengar et al. Reference Ramiengar, Devadu, Viswanatha, Chayapathi and Ramakrishnan1978). Locations of important cities, towns and sample are marked.

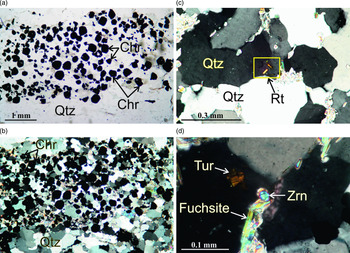
Photomicrographs of studied quartzite all in crossed nicols (except a). (a, b) Parallel alignment of quartz, Cr-spinel and fuchsite mica. Note the distribution of Cr-spinels and fuchsite arranged in subparallel alignment showing a distinct foliation. Interstices are filled with finer quartz grains. (c) Rutile needles as inclusion in quartz. (d) Tourmaline, sub-rounded zircon and fuchsite mica as inclusion in quartz.

(a) Quartzite thin-section showing Cr-spinel (Chr) distribution in the sample. (b) Photomicrograph of a quartz inclusion in a Cr-spinel (Chr) grain. (c) Exsolved ilmenite (Ilm) phases in Cr-spinel (Chr). (d) Scanning electron microscope image of single Cr-spinel grain. (e) Ti distribution in the same Cr-spinel grain showing exsolution pattern.

The quartzite consists dominantly of medium- to coarse-grained (~1 mm) sub-rounded quartz grains; small quartz grains exhibit polygonal outlines and surround the larger grains. The rock shows deformation bands in places and the Cr-spinels are aligned parallel to the foliation (Fig. 2). Individual Cr-spinel grains are mostly 0.2–0.6 mm in size and anhedral in shape. Fuchsite mica (~10 % modal composition) with feeble (slight) pleochroism creates a subparallel arrangement and forms a foliation plane (Fig. 2a, b). Needle-shaped rutile, subhedral reddish tourmaline and sub-rounded zircon grains are also observed (Fig. 2c, d).
3. Methodology
3.a. Zircon
Zircon separation was carried out at the Physical Research Laboratory, Ahmedabad. The sample was crushed into centimetre-sized chips to eliminate weathered portions and thoroughly washed. Clean chips from the sample were pulverized to <250 μm using a stainless steel piston and cylinder. Zircons were concentrated using aqueous sodium polytungstate solution (density = 3 gcm−3) followed by magnetic separation using a Frantz isodynamic separator. Zircon grains were handpicked from the least magnetic fraction using a binocular microscope.
Most of the zircon U–Pb isotope analyses were carried out at the University of Münster, Germany, with an Element 2 mass spectrometer (ThermoFisher) connected to a Photon Machines Analyte G2 laser system. Forward power was 1300 W and reflected power <1 W; gas flow rates were 1.2 l m−1 for He (carrier gas of ablated material), and 0.9 l m−1 and 1.1 l m−1 for the Ar-auxiliary and sample gas, respectively. Cooling gas flow rate was set to 16 l min−1. The laser repetition rate was set to 10 Hz using a fluence of 4 J cm−2 and the system was tuned (torch position, lenses, gas flows) on NIST 612 glass, measuring 139La, 232Th and 232Th16O to get stable signals, high sensitivity and low oxide rates (232Th16O/232Th <0.1 %) during ablation. Laser spot sizes varied between 25 and 45 μm, depending on the size of the zircons. Details of the analytical and data reduction protocols can be found in Kooijman et al. (Reference Kooijman, Berndt and Mezger2012). Cathodoluminescence (CL) images of zircons were used as guides for laser ablation spot selection.
Some of the zircons were U–Pb dated by laser ablation inductively coupled plasma mass spectrometry (LA-ICP-MS) at MQ Geoanalytical, Macquarie University, Sydney. The analyses were carried out using an Agilent 7700 quadrupole ICP-MS instrument, attached to a Photon Machines Excimer 193 nm laser system using a beam diameter of c. 30–40 μm with 5 Hz repetition rate and energy of c. 0.06 µJ and 8 J cm−2. The analytical procedures for U–Pb dating are described in detail by Jackson et al. (Reference Jackson, Pearson, Griffin and Belousova2004).
Hf isotope analyses were carried out at MQ Geoanalytical, Macquarie University, using the methodology and analytical conditions for Lu–Hf isotope analysis described in Griffin et al. (Reference Griffin, Pearson, Belousova, Jackson, van Achterbergh, O’Reilly and Shee2000). Analyses were carried out in situ using a Photon Machines Excimer 193 nm laser attached to a Nu Plasma multi-collector ICP-MS. The analyses were carried out with a beam diameter of 40 µm and a 5 Hz repetition rate and typical ablation times of c. 100 s. He carrier gas transported the ablated sample from the cell via a mixing chamber to the ICP-MS torch.
3.b. Chromian spinels
Three Cr-spinels from the quartzite were studied by X-ray single crystal diffraction. Data were recorded on an automated KUMA-KM4 (K-geometry) diffractometer at the Department of Mathematics and Geosciences (University of Trieste), using MoKα radiation, monochromatized by a flat graphite crystal. X-ray data collection, chemical analyses and cation distribution were made according to the procedures described in Lenaz & Schmitz (Reference Lenaz and Schmitz2017).
Major-element compositions were determined with a JEOL JXA 8900 RL electron microprobe at the University of Mainz. The oxide minerals were measured with five wavelength-dispersive spectrometers at 20 kV acceleration voltage, a current of 12 or 20 nA and either a focused beam or a beam diameter of 2 µm. Natural minerals and oxides (Si, Ti, Al, Fe, Mg, Mn, Cr and Zn) and pure element standards (V, Co) were used.
Trace-element compositions of chromite were determined using a NewWave UP 266 laser system connected to an Agilent 7700cs ICP-MS at MQ Geoanalytical, Macquarie University, following the methods described by Colás et al. (Reference Colás, González-Jiménez, Griffin, Fanlo, Gervilla, O’Reilly, Pearson, Kerestedjian and Proenza2014). The basaltic glass BCR-2g and the in-house chromite secondary standard LCR-1 (Lace mine, South Africa; Locmelis et al. Reference Locmelis, Pearson, Barnes and Fiorentini2011) were analysed as unknowns during each analytical run to check accuracy and precision. The results obtained for these two standards display very good reproducibility (3–8 %) for most trace elements.
4. Results
4.a. Zircon
The majority of the zircons are long prismatic and poorly sorted, although a small number of sub-rounded to subhedral and poorly sorted zircons also occur. Grain morphology shows that the zircons could be of mixed origin (probably both detrital and metamorphic). Zircons are generally colourless to brownish in transmitted light: most of the zircon grains selected for analysis were colourless and prismatic, a few slightly rounded. They were free of visible alteration, cracks and inclusions. CL images of representative analysed grains are shown in online Supplementary Material Figure S1. CL reveals clear core–rim relationships in some zircon grains (online Supplementary Material Fig. S1vi, ix, xi). Some grains show metamict cores.
We conducted 52 analyses on 51 separate grains (online Supplementary Material Table S2a, b). Analyses with >10 % discordance occur but are not used in the discussion. Only 27 analyses yielded concordant ages (92–102 % concordance) ranging between 3150 and 2510 Ma, with a dominant age group between 3150 and 2900 Ma. It may be noted that though the total number of analysed zircons is limited, the majority of our age spectrum falls within the reported detrital zircon ages of the Sargur supracrustal sequences (except <2.9 Ga ages). The discordant (37 to 87 % concordance) dataset of 25 spot analyses yields a similar 207Pb–206Pb age range of 3150 to 2900 Ma. The U–Pb dataset is presented in online Supplementary Material Table S2 and the concordia and probability distribution diagrams in Figure 4. The older age population (3150 to 2900 Ma) showing higher uranium contents ranging between 126 and 452 ppm is similar to the youngest age range of detrital zircons in the Sargur supracrustal rocks reported by Nutman et al. (Reference Nutman, Chadwick, Ramakrishnan and Viswanathan1992). The younger age population between 2.65 and 2.51 Ga is characterized by a lower uranium (11 to 26 ppm) concentration and very low Th/U values (ranging between 0 and 0.01) (online Supplementary Material Table S2b nos. 2–6).
(a) Histogram and (b) Concordia diagram for the Banavara detrital zircons showing bimodal age distribution.

A total of 18 Lu–Hf analyses were made on zircons with robust U–Pb ages (>95 % concordance). The Hf isotope compositions of the 3.15 to 2.9 Ga zircons have chondritic to superchondritic ϵHf values ranging between +0.8 and +6.4, and show variable crustal model (TDM c) ages lying between 3.1 and 3.3 Ga. The Hf isotope results are shown in Figure 5 and the data are presented in online Supplementary Material Table S3. Five data points plot above the depleted mantle (DM) line, probably owing to the mismatching of the analysed U–Pb and Hf isotope spots: these data points are not considered during the discussion. There could be at least two explanations for the data points that plot above the DM reference line: (a) In the present study, we used the model by Griffin et al. (Reference Griffin, Pearson, Belousova, Jackson, van Achterbergh, O’Reilly and Shee2000), where the DM has a present-day 176Hf/177Hf of 0.28323, similar to that of average mid-ocean ridge basalt (MORB). However, the range of MORB Hf isotope ratios is not limited to a thin line, but represents a range in 176Hf/177Hf values varying mainly from 0.283040 to 0.283311, but with some values over 0.283355 (e.g. Nowell et al. Reference Nowell, Kempton, Noble, Fitton, Saunders, Mahoney and Taylor1998). (b) There could be a possibility of core–rim zoning in some of the studied zircons, where Hf isotope analysis spots sample the older core domain, while U–Pb spots are within the younger rim zones.
Plot of ϵHf versus U–Pb ages for the analysed zircons. CHUR – chondritic reservoir (bulk earth); DM – depleted mantle. Data points above the DM line are not considered during the discussion.

4.b. Chromian spinels
Detrital Cr-spinels of varying sizes often occur as continuous bands composed of >80 vol. % chromite within the metasediment. Representative photomicrographs and scanning electron microscope (SEM) images of single grains are shown in Figure 3. Individual Cr-spinel grains are mostly 0.2–2.0 mm across, anhedral and show the effects of corrosion or reaction. Cr-spinel grains are closely packed, with very narrow interstices filled with silicate minerals (Fig. 3b). Exsolved needle-shaped ilmenites a few microns in size are present in some grains (Fig. 3c, e).
Electron probe microanalysis (EPMA) of cores of Banavara Cr-spinels is presented in online Supplementary Material Table S4. The Cr-spinels show relatively variable Cr2O3 contents (30.79 to 37.61 wt %), Al2O3 in the range 20.01 to 25.74 wt %, high FeO (36.77 to 38.61 wt %) and very low MgO (0.53 to 0.91 wt %). TiO2 is less than 1 wt % (except one with 3.37 wt %) and ZnO is high (3.07–3.79 wt %). Other oxides are below 1 wt %, with MnO within 0.85–0.99 wt %, NiO 0.01–0.06 wt % and V2O3 0.16–0.23 wt %. Fe2+ and Fe3+ are calculated from ideal spinel stoichiometry: Fe2+/Fe3+ ranges between 3.3 and 10.2. Given this, the Mg no. value (Mg/(Mg + Fe2+)) is between 0.03 and 0.05, the Cr no. (Cr/(Cr + Al)) between 0.43 and 0.57, and Fe3+ no. (Fe3+/(Fe3+ + Cr + Al)) between 0.05 and 0.13.
For provenance analysis, eight transition metals (Sc, Ti, V, Mn, Co, Ni, Zn and Ga) were consistently above detection limits (DL 0.02 to 1 ppm; online Supplementary Material Table S4). Scandium contents are very low (0.19 to 0.52 ppm), Ti ranges from 1097 to 6122 ppm, V from 1057 to 1316 ppm, Mn from 5891 to 7469 ppm, Co from 313 to 422 ppm, and Ni from 190 to 234 ppm. Zinc content is very high (28961 to 38164 ppm) and Ga varies from 201 to 288 ppm. The low Mg no. and the overall enrichment of Zn, Ga, Mn and V in the Cr-spinels indicates that the enrichment is linked to secondary processes. A MORB-normalized multi-element diagram of the studied Cr-spinel is presented in Figure 6.
Comparative plot of major and trace elements in Banavara (this study) and Nuggihalli Cr-spinel showing strongly differing distribution of the elements.

In spinel, anions form a nearly cubic close-packed array, parallel to (111) planes, and the cations fill part of the tetrahedral (T) and octahedral (M) interstices available in the framework. In this structure, oxygen atoms are linked to three octahedral cations and one tetrahedral cation lying on the opposite side of the oxygen layer to form a trigonal pyramid. As the oxygen atom moves along the cube diagonal [111], it causes the oxygen layers in the spinel structure to be slightly puckered. Variations in u, the oxygen positional parameter, correspond to displacements of oxygens along the cube diagonal, and reflect adjustments to the relative effective radii of cations in the tetrahedral and octahedral sites. An increase in u corresponds to an enlargement of the tetrahedral coordination polyhedra and a compensating decrease in the octahedra (Lindsley, Reference Lindsley and Rumble1976). X-ray data showed that the three crystals are very similar, with cell edges ranging from 8.2735 (3) Å to 8.2785 (2) Å and oxygen positional parameters between 0.2635 (2) and 0.2639 (2).
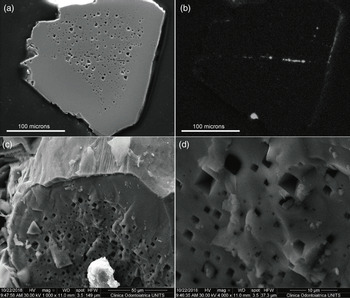
SEM images indicate the presence of negative crystals (Laemmlein, Reference Laemmlein1973; Kern, Reference Kern and Sunagawa1987; Sunagawa, Reference Sunagawa and Sunagawa1987) in the cores of chromite grains (Fig. 7). These octahedral pores are occasionally filled by quartz and are considered to be sites where fluid inclusions could have existed. After originally forming their primary, more or less irregular shape, fluid inclusions usually transform it through dissolution and recrystallization into the equilibrium crystal shape with minimum surface free energy. Some inclusions retain their original metastable shape, especially at low T, fast cooling and as a result of the slow recrystallization rate.
SEM images of Cr-spinels: (a) polished crystal with pores; (b) map of Si distribution in the crystal; (c) broken crystal surface showing the presence of pores; (d) enlargement of octahedral pores.

5. Discussion
5.a. Zircon
Multiple age peaks on a relative probability diagram indicate input either from source regions with discrete ages or the presence of rocks of diverse ages within the source region. In the present study, grains of Archaean age are dominant, and the age range of 3150 to 2510 Ma is similar to the ages of the Peninsular Gneiss (e.g. Bhaskar Rao et al. Reference Bhaskar Rao, Beck, Rama Murthy, Nirmal Charan, Naqvi, Naqvi and Rogers1983; Rogers & Callahan, Reference Rogers and Callahan1989; Maibam et al. Reference Maibam, Deomurari and Goswami2003). Hf isotope compositions of the 3.1 to 2.9 Ga zircons are chondritic to superchondritic (ϵHf ranging between +0.8 and +6.4) and juvenile in nature, which differs from younger zircons (<2.9 Ga) with subchondritic Hf isotopes. Our results and younger ages from the Sargur Group rocks (Hokada et al. Reference Hokada, Horie, Satish-Kumar, Ueno, Nasheeth, Mishima and Shiraishi2013; Maibam et al. Reference Maibam, Gerdes, Srinivasan and Goswami2017) indicate that the Sargur Group supracrustal rocks were not derived from >3 Ga crust.
In closure proximity to the study area the zircon ages that cluster around 3.0 Ga are older than the metamorphic age of the adjoining Chennarayapatna gneiss (Bhaskar Rao et al. Reference Bhaskar Rao, Beck, Rama Murthy, Nirmal Charan, Naqvi, Naqvi and Rogers1983), but overlap with the age of the Tiptur trondhjemite (Rogers & Callahan, Reference Rogers and Callahan1989). The zircon ages for the metasediment obtained here suggest an upper limit of 3.2 Ga for the onset of sediment deposition in this part of the Dharwar Craton. The ages of some metasedimentary protoliths and the gneissic precursors in this region appear to be nearly contemporaneous. There are also reports of younger ages from the WDC: Jayananda et al. (Reference Jayananda, Chardon, Peucat and Capdevila2006) proposed regional partial reworking of the WDC at 2.6 Ga involving a high-temperature thickening event. Sarma et al. (Reference Sarma, McNaughton, Belusova, Ram Mohan and Fletcher2012) reported a similar age of 2.61−2.55 Ga with a large variation in 176Hf/177Hf ratios, probably owing to mixing between the older crustal components and mantle-derived juvenile magmas. Published detrital zircon ages and our present dataset show that the detrital zircon ages of the WDC range between 3.6 and 2.5 Ga, with some of the earlier workers inferring that the youngest age gives the maximum age of deposition (e.g. Sarma et al. Reference Sarma, McNaughton, Belusova, Ram Mohan and Fletcher2012). The studied sample is present as a supracrustal enclave enclosed within the surrounding gneisses; however, the detrital zircons are contemporaneous with the gneissic ages. We suggest from our data that the supracrustal rocks of the WDC were probably derived from the gneissic rocks of the Dharwar Craton. The combined geochronological data and current detrital zircon ages reinforce our earlier interpretation that not all Sargur supracrustal rocks were derived from >3.0 Ga crust (Maibam et al. Reference Maibam, Gerdes, Srinivasan and Goswami2017), which contrasts with the commonly accepted 3.4 to 3.0 Ga age range for the Sargur Group (e.g. Naqvi & Rogers, Reference Naqvi and Rogers1987; Jayananda et al. Reference Jayananda, Kano, Peucat and Channabasappa2008, Reference Jayananda, Chardon, Peucat, Tushipokla and Fanning2015).
The U–Pb and Hf isotope data for the Sargur supracrustal rocks are characterized by a chondritic to superchondritic crustal signature (ϵHf +0.2 to +6.4), indicating possible derivation from a juvenile magmatic crustal source with an age between 3.1 and 2.9 Ga. Our data do not support the idea that <3.2 Ga components in the western Dharwar block are recycled older crust and not juvenile in nature (Guitreau et al. Reference Guitreau, Mukasa, Loudin and Krishnan2017).
The new dataset reinforces the interpretation that the Sargur Group supracrustal enclaves are a combination of older (>3.0 Ga) and younger (<3.0 Ga) components (Maibam et al. Reference Maibam, Gerdes, Srinivasan and Goswami2017). Not all enclaves in the gneiss terrain are older than those in the greenstone belt. Evidence of younger Neoarchaean geological events (magmatic and metamorphic) at 2.6–2.5 Ga is now widespread in the supracrustal sequence (Jayananda et al. Reference Jayananda, Chardon, Peucat and Capdevila2006; Maibam et al. Reference Maibam, Goswami and Srinivasan2011; Lancaster et al. Reference Lancaster, Dey, Storey, Mitra and Bhunia2015). Our combined U−Pb and Hf isotope dataset indicates that those between 3.1 and 2.9 Ga crystallized from a juvenile magmatic source, contrasting with Nutman et al.’s (Reference Nutman, Chadwick, Ramakrishnan and Viswanathan1992) conclusion of a metamorphic origin for the 3.13–2.96 Ga detrital zircons and the restriction of juvenile magmatic zircons to the >3.3 Ga components (Guitreau et al. Reference Guitreau, Mukasa, Loudin and Krishnan2017). A span of protracted crystallization ages ranging from 3.3 to 3.0 Ga is reported from the gneissic protolith (e.g. Maibam et al. Reference Maibam, Goswami and Srinivasan2011, Reference Maibam, Gerdes and Goswami2016; Guitreau et al. Reference Guitreau, Mukasa, Loudin and Krishnan2017). The younger zircon population (2.6 to 2.5 Ga) could be of metamorphic origin or the imprint of the younger potassic granite magmatism. The results obtained in this study indicate that the 3.1 to 2.9 Ga juvenile detrital zircons in the Banavara quartzite (Sargur Group) were probably subjected to reported Neoarchaean potassic granite magmatic and metamorphic events at 2.6 and ˜2.5 Ga, an event that has been recognized from a Pb–Pb isotopic study of marbles from the Sargur Group (Sarangi et al. Reference Sarangi, Gopalan and Srinivasan2007) and Dharwar Supergroup (Russell et al. Reference Russell, Chadwick, Krishna Rao and Vasudev1996). Our zircon data do not support Hokada et al.’s (Reference Hokada, Horie, Satish-Kumar, Ueno, Nasheeth, Mishima and Shiraishi2013) interpretation that Sargur Group metamorphism (3.08 Ga) is older than the Dharwar Supergroup.
Our limited new geochronological results emphasize the need for further intensive U–Pb geochronology and Lu–Hf systematic studies of zircons in the Sargur Group supracrustal rocks in order to resolve the complex stratigraphic relationships of this group relative to the low-grade supracrustal rocks in the Dharwar greenstone belts. The current data endorse the interpretation by Maibam et al. (Reference Maibam, Gerdes, Srinivasan and Goswami2017) that the Sargur Group is a complex of rocks of more than one age, some pre-dating the Dharwar Supergroup and others of the same age as the Dharwar Supergroup.
5.b. Chromian spinels
The low Mg no. values of the Cr-spinels are a consequence of extensive alteration removing MgO, so that it is impossible to determine their primary composition and consequently their provenance. Several factors can affect the composition of spinel, from reaction with interstitial liquids at the magmatic stage, to subsolidus re-equilibration with olivine, pyroxenes or amphibole, oxidation, hydrothermal alteration and metamorphic reactions (Abzalov, Reference Abzalov1998; Appel et al. Reference Appel, Appel and Rollinson2002; Mellini et al. Reference Mellini, Rumori and Viti2005; González-Jiménez et al. Reference González-Jiménez, Kerestedjian, Proenza and Gervilla2009, Reference González-Jiménez, Locmelis, Belousova, Griffin, Gervilla, Kerestedjian, O’Reilly, Pearson and Sergeeva2015; Bai et al. Reference Bai, Su, Xiao, Lenaz, Sakyi, Liang, Chen and Yang2018). These processes lead to different effects, including depletion in Mg and Cr and enrichment in Ti and Fe3+. Also, Ti-rich chromite is stable at high temperature but releases Ti to form ilmenite lamellae on cooling in oxidizing conditions (e.g. Spencer & Lindsley, Reference Spencer and Lindsley1981; Frost, Reference Frost and Lindsley1991; Appel et al. Reference Appel, Appel and Rollinson2002). Similar conditions can be inferred for ilmenite lamellae in the Banavara Cr-spinels (Fig. 3c, e), and Zn may also have been partially introduced to the Cr-spinels at this stage (Abzalov, Reference Abzalov1998).
During fractional crystallization or partial melting, trace elements show larger variations than major elements, thus trace elements are important proxies for monitoring melt–rock reactions and magmatic differentiation in Cr-spinel (Pearce et al. Reference Pearce, Barke, Edwards, Parkinson and Leat2000). Recent studies have shown that trace-element concentrations in Cr-spinel can be used to decipher the environment in which the Cr-spinel crystallized (e.g. Pagé & Barnes, Reference Pagé and Barnes2009; González-Jiménez et al. Reference González-Jiménez, Augé, Gervilla, Bailly, Proenza and Griffin2011, Reference González-Jiménez, Griffin, Proenza, Gervilla, O’Reilly, Akbulut, Pearson and Arai2014; Colás et al. Reference Colás, González-Jiménez, Griffin, Fanlo, Gervilla, O’Reilly, Pearson, Kerestedjian and Proenza2014, Reference Colás, Padrón-Navarta, González-Jiménez, Griffin, Fanlo, O’Reilly, Gervilla, Proenza, Pearson and Escayola2016).
Lenaz et al. (Reference Lenaz, Musco, Petrelli, Caldeira, De Min, Marzoli, Mata, Perugini, Princivalle, Boumehdi, Bensaid and Youbi2017) showed that elements such as V, Ni, Mn and Ga can be correlated with Cr2O3 in spinels in mantle xenoliths. In ophiolites, the situation is much more complex owing to serpentinization. However, Colás et al. (Reference Colás, González-Jiménez, Griffin, Fanlo, Gervilla, O’Reilly, Pearson, Kerestedjian and Proenza2014) demonstrated that the cores of partly altered high-Cr-spinel are enriched in Zn, Co and Mn but strongly depleted in Ga, Ni and Sc, attributed to a decrease in Mg no. and Al produced by the crystallization of chlorite in the pores of porous chromite. Non-porous chromite can be enriched in Ti, Ni, Zn, Co, Mn and Sc but depleted in Ga, suggesting that fluid-assisted processes have obliterated the primary magmatic signature. In addition, Colás et al. (Reference Colás, Padrón-Navarta, González-Jiménez, Griffin, Fanlo, O’Reilly, Gervilla, Proenza, Pearson and Escayola2016) reported that the order of increasing compatibility with MgAl2O4-rich spinels is Ti, Sc, Ni, V, Ge, Mn, Cu, Sn, Co, Ga and Zn.
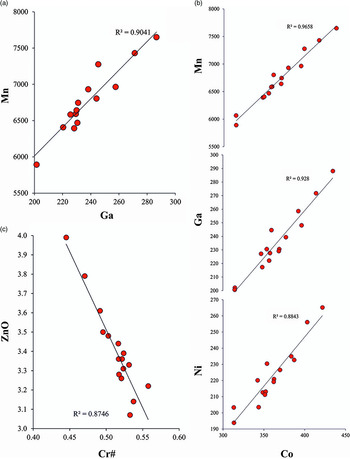
According to Colás et al. (Reference Colás, Padrón-Navarta, González-Jiménez, Griffin, Fanlo, O’Reilly, Gervilla, Proenza, Pearson and Escayola2016), a systematic increase in Zn and Co coupled with a net decrease in Ga during hydrous metamorphism of chromitite bodies cannot be explained exclusively by compositional changes of major elements in the Cr-spinel. The most likely explanation is that minor and trace elements in Cr-spinel in metamorphosed chromitites are controlled by interactions with metamorphic fluids involved in the formation of chlorite. There is no correlation between Cr no. and most trace elements apart from Zn in the Banavara Cr-spinels (Fig. 8). As suggested by Abzalov (Reference Abzalov1998), this covariation of Zn and Cr no. may be related to a single hydrothermal event. Even though they are not related to Cr no., Mn, Ni, Ga and Co show a positive correlation (R2 in the range 0.88−0.97) suggesting they have a common origin.
Bivariate plots of transition elements showing strong positive correlations between (a) Mn versus Ga, (b) Mn, Ga and Ni versus Co, and (c) negative correlation between ZnO and Cr no.

The distribution patterns of major, minor and trace elements in Cr-spinels from chromitite normalized to Cr-spinel from MORB are compared to those from the Nuggihalli schist belt in Figure 6. The trace-element patterns do not show any particular trend and the two patterns are distinctly different. The Banavara Cr-spinels are depleted in Al, Ni, Mg, Co, Sc and show enrichment in Ga, Zn and Mn.
The relationships between mineral chemistry, structural parameters (cell edge a0 and oxygen positional parameter u) and tectonic setting have been considered in detail in recent years (Fig. 9). In Figure 9, the Banavara chromites are compared to other Archaean occurrences: the layered complexes of Bushveld (Lenaz et al. Reference Lenaz, Braidotti, Princivalle, Garuti and Zaccarini2007) and Stillwater (Lenaz et al. Reference Lenaz, Garuti, Zaccarini, Cooper and Princivalle2012), the Ujragassuit, Fiskenaesset and Zimbabwe complexes (Rollinson et al. Reference Rollinson, Adetunji, Lenaz and Szilas2017), the Amsaga complex in Mauritania (Lenaz et al. Reference Lenaz, Rigonat, Skogby and Berger2018), the Sittampundi complex in south India (unpub. data) and the Archaean Nuggihalli chromite (Lenaz et al. Reference Lenaz, Andreozzi, Mitra, Bidyananda and Princivalle2004). The Banavara spinels are similar to those from anorthositic complexes such as Sittampundi, Amsaga and Fiskenaesset, showing the highest oxygen positional parameter value ever recorded for natural Cr-spinels. They differ from Cr-spinels in the Bushveld and Stillwater layered complexes and the Nuggihalli komatiites. Crystal chemical studies are not commonly applied to detrital material (Lenaz & Princivalle, Reference Lenaz and Princivalle1996, Reference Lenaz and Princivalle2005; Carbonin et al. Reference Carbonin, Menegazzo, Lenaz and Princivalle1999; Lenaz et al. Reference Lenaz, Carbonin, Gregoric and Princivalle2002, Reference Lenaz, Logvinova, Princivalle and Sobolev2009 a, Reference Lenaz, Princivalle and Schmitz2015), but they can be helpful in identifying sources and oxidation processes.
Oxygen positional parameter, u, versus cell edge, a. Red circles – Cr-spinels from Banavara (this study); black circles – Cr-spinels from Sittampundi (unpub. data); grey circles, squares and star – Cr-spinels from Amsaga (Mauritania) in amphibole, chlorite and talc-serpentine matrix, respectively (Lenaz et al. Reference Lenaz, Rigonat, Skogby and Berger2018); yellow, purple and green circles – Cr-spinels from Fiskenaesset and Ujragassuit (Greenland) and Zimbabwe, respectively (Rollinson et al. Reference Rollinson, Adetunji, Lenaz and Szilas2017); blue squares – Cr-spinels from Rum (Scotland, Lenaz et al. Reference Lenaz, O’Driscoll and Princivalle2011); green field – Cr-spinels from Bushveld and Stillwater complexes (Lenaz et al. Reference Lenaz, Braidotti, Princivalle, Garuti and Zaccarini2007, Reference Lenaz, Garuti, Zaccarini, Cooper and Princivalle2012); yellow field – Cr-spinels from Nuggihalli komatiites (Lenaz et al. Reference Lenaz, Andreozzi, Mitra, Bidyananda and Princivalle2004).

The oxygen positional parameter is a consequence of the distribution of cations in the T and M sites, which can reflect the cooling history of the crystal (Della Giusta et al. Reference Della Giusta, Princivalle and Carbonin1986; Princivalle et al. Reference Princivalle, Della Giusta and Carbonin1989). Rapid cooling creates disorder among trivalent cations such as Al and/or Fe3+ in the T sites (Parisi et al. Reference Parisi, Lenaz, Princivalle and Sciascia2014) while divalent cations Mg and Fe2+ occupy the M sites. In contrast, slow cooling creates a more ordered situation with trivalent cations in the M sites and divalent in the T sites. The geothermometer of Princivalle et al. (Reference Princivalle, Della Giusta, De Min and Piccirillo1999) allows us to calculate the intracrystalline closure temperature (T c) derived from the Mg–Al exchange between the two sites M and T, yielding a temperature of c. 1130 °C, although the very low Mg content, and consequently the Mg–Al exchange, may have affected this result. Even in this case, it is not possible to identify a possible provenance for these detrital Cr-spinels.
It is difficult to arrive at a unique interpretation of the Cr-spinels, as they have a complex magmatic/metamorphic history. Furthermore, their original composition cannot be determined. The last event that occurred at the lowest temperature is possibly related to hydrothermal alteration that occurred in the quartz arenite. This provoked recrystallization, resulting in a decrease in Cr no. and an increase in ZnO, as well as the negative crystals sometimes filled by quartz. We can only speculate about their earlier history and origin. Cr-spinels occurring in Archaean complexes are chemically different from those in younger complexes such as ophiolites, and their structural parameters are also different. The low temperature of hydrothermal alteration probably did not mask the primary cation distribution formed at higher temperature, in which case their similarity to Archaean layered complexes in the u versus cell edge diagram (Fig. 9) is real. However, the trace-element compositions of Cr-spinels from such complexes are not currently available, so it cannot be assessed whether the distribution of Ni, Ga, Co and Mn is magmatic or a due to later event. As the partition coefficients of these elements differ, a metamorphic event would have redistributed them differently. It is therefore possible that the observed abundances of these Cr-spinels are primary.
6. Conclusions
This combined detrital zircon isotopic (U–Pb, Lu–Hf), geochemical and single crystal X-ray refinement study of the Banavara quartzite (Sargur supracrustal unit) Cr-spinel provides important insights into the evolution of the Dharwar Craton. These are:
-
(i) The association of zircon and Cr-spinel in the Banavara quartzite suggests that significant basic and ultrabasic magmatism took place during a relatively short period before emplacement of the host gneissic rocks.
-
(ii) Detrital zircons belong to two age populations with concordant U–Pb ages: an older population with ages ranging from 3.15 to 2.9 Ga and a younger population at 2.6–2.5 Ga.
-
(iii) The Lu–Hf isotopic systematics of the zircons provides evidence that 3.1–2.9 Ga juvenile rock components are the source of sediments that supplied the Sargur supracrustal rocks.
-
(iv) Interpretation of the depositional and magmatic setting of the Sargur Group is fraught with difficulties because the enclaves in the orthogneisses may be derived from protoliths of widely different ages and settings, which were juxtaposed tectonically during a series of gneiss-forming events in the period 3.4–2.6 Ga.
Acknowledgements
BM initiated this research at the University of Mainz during an INSA-DFG Exchange Programme. Further analytical work was carried out during BM’s visit to CCFS (Macquarie) under a Visiting Fellowship programme. We thank Rosanna Murphy for help with zircon and chromite trace-element analysis at Macquarie, Stephan Buhre during EPMA analysis at Mainz, Beate Schmitte for assistance in the LA-ICP-MS laboratory at Münster, and Gianluca Turco with SEM analyses on chromites at the University of Trieste. Two anonymous reviewers and Dr Kathryn Goodenough, journal editor, are appreciated for their constructive and insightful comments. This is contribution 1613 from the ARC Centre of Excellence for Core to Crust Fluid Systems (http://www.ccfs.mq.edu.au) and 1435 from the GEMOC Key Centre (http://www.gemoc.mq.edu.au). The analytical data were obtained using instrumentation funded by DEST Systemic Infrastructure Grants, ARC LIEF, NCRIS/AuScope, industry partners and Macquarie University. BM was financially supported by a Department of Science and Technology, Government of India project during the course of the work. Dr R. Srinivasan is thanked for help during fieldwork and for discussions.
Supplementary material
To view supplementary material for this article, please visit https://doi.org/10.1017/S001675682100025X