INTRODUCTION
Reconstructing the processes of technological change requires a strong chronological foundation. In the study of the rise of iron in Southwestern Asia, the overwhelming majority of research has focused on the Cyprus and the Levantine corridor (e.g. Stech-Wheeler et al. Reference Stech-Wheeler, Muhly, Maxwell-Hyslop and Maddin1981; Maddin Reference Maddin1982; Davis et al. Reference Davis, Maddin, Muhly and Stech1985; Waldbaum Reference Waldbaum1999; Veldhuijzen and Rehren Reference Veldhuijzen and Rehren2007; Veldhuijzen Reference Veldhuijzen2012; Yahalom-Mack and Eliyahu-Behar Reference Yahalom-Mack and Eliyahu-Behar2015). Research on Late Bronze (LBA) and Early Iron (EIA) bronze and iron production outside of this immediate area has tended to focus on finished artifacts, not manufacturing workshops and production debris (e.g. Pigott Reference Pigott1999:90–96; Yalçin Reference Yalçin1999; McConchie Reference McConchie2004). Iron and bronze were likely produced in Anatolia, Iran, and the Caucasus during this period, but the physical remains of these industries—mines and smelting sites, as well as casting and forging workshops—remain underexplored. The existing evidence provides only a partial understanding of the organization and technologies of production. Many models of iron adoption rely on ideas about the relative organization of bronze and iron production, particularly access to raw materials and elite oversight over production and trade. The study of bronze and iron production contexts is therefore a necessary component of testing these ideas.
Beginning in the 1960s, extensive landscapes of metal production sites have been uncovered in the southeastern Black Sea area (Gzelishvili Reference Gzelishvili1964; Khakhutaishvili Reference Khakhutaishvili1976, Reference Khakhutaishvili1988). Called Colchis by the Greeks, it was thought to be the destination of Jason and the Argonauts and the home of the Golden Fleece. Although the region’s mythical status as major center of metal production has been long established, archaeological investigations of these areas remain little known outside the former Soviet Union. Early excavations of these smelting sites revealed a relatively consistent layout of these sites, usually with one or two pit furnaces and associated slag heaps. Smelting sites were generally small; often the slag heap covers a few hundred square meters at the most, to a depth of about a meter or less (Khakhutaishvili Reference Khakhutaishvili2009 [1987]). Following the first English-language publication on this complex of sites, considered at the time to be iron smelting remains (Khakhutaishvili Reference Khakhutaishvili1976), frequent references appeared in Western scholarship, often stressing the need for further research on the technology and chronology of production (Pigott Reference Pigott1981:74; Moorey Reference Moorey1991:3, Reference Moorey1999:282; Pleiner Reference Pleiner2000:36–37; Veldhuijzen and Rehren Reference Veldhuijzen and Rehren2007:189; McConchie Reference McConchie2004:52–53).
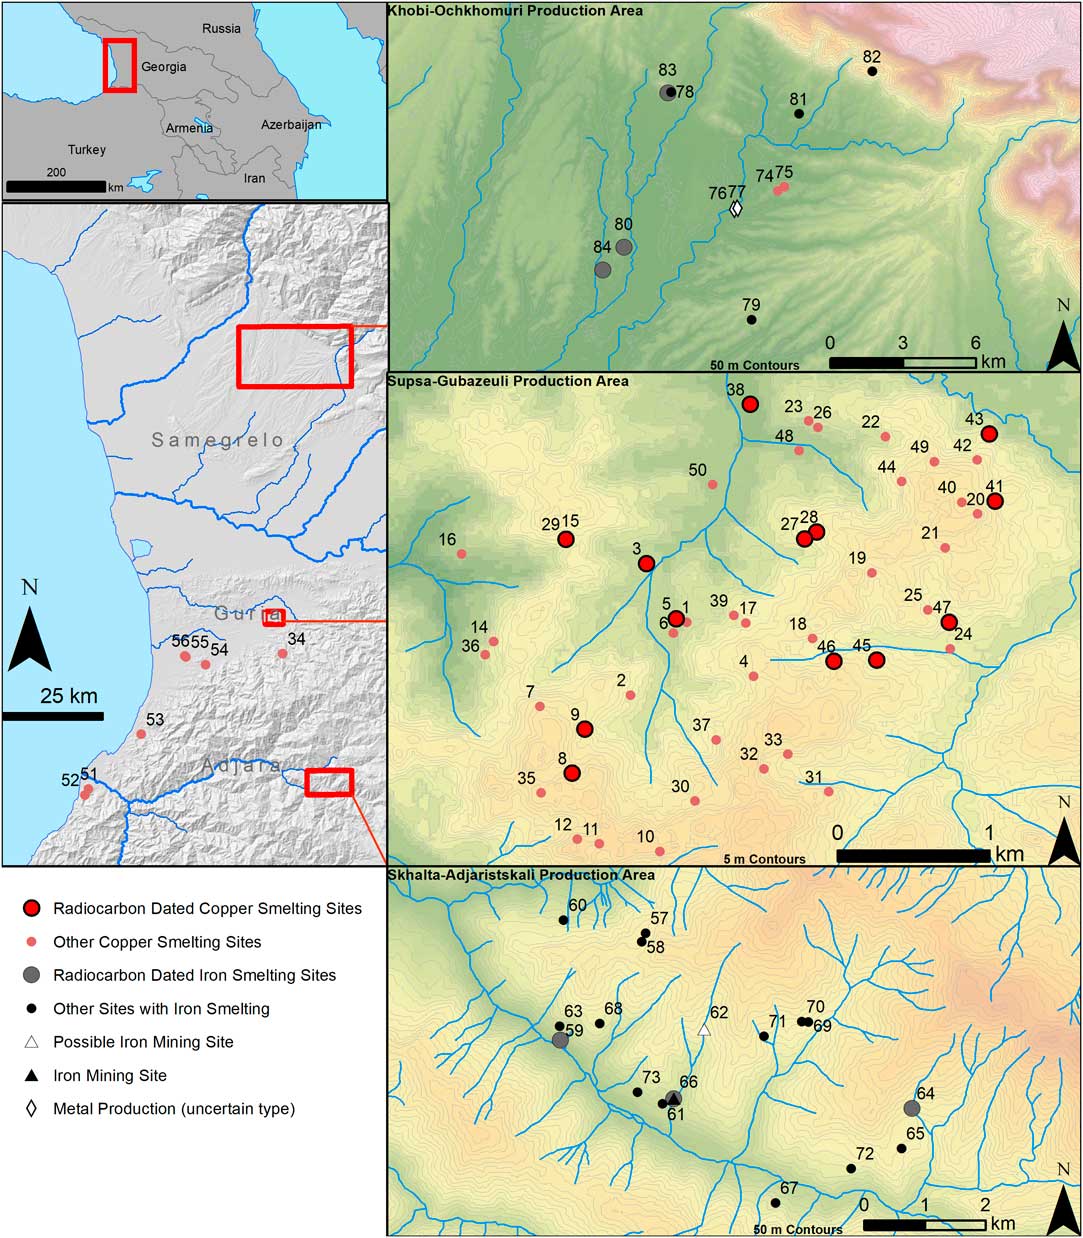
Recent surveys have provided a clearer picture of the distribution of smelting sites within the landscape (Erb-Satullo et al. Reference Erb-Satullo, Gilmour and Khakhutaishvili2014, Reference Erb-Satullo, Gilmour and Khakhutaishvili2015, Reference Erb-Satullo, Gilmour and Khakhutaishvili2017). Despite the challenges posed by heavy vegetation, several seasons of survey work in the modern region of Guria, near the Supsa and Gubazeuli rivers, produced a smelting site distribution map that likely reflects the ancient pattern reasonably well (Figure 1). Production activities were quite dispersed, and although some sites are close together, these likely represent sequential (possibly seasonal or generational) rather than simultaneous use (for further discussion of spatial aspects of production, see Erb-Satullo et al. Reference Erb-Satullo, Gilmour and Khakhutaishvili2017). More abbreviated visits to other areas explored in early Soviet period research showed that this pattern of production extended in a more or less continuous band throughout the foothills of the Colchian Basin, while tantalizing evidence from extreme northeastern Turkey (Lutz et al. Reference Lutz, Pernicka and Wagner1994) suggests an even broader extent to this copper production system.
Map of metal production sites in western Georgia, indicating which sites were 14C dated in the present study. Digital elevation data is from SRTM and ASTER (a product of METI and NASA).

Such large numbers of small copper smelting sites (57 were mapped by this project, but there are undoubtedly many more) contrast with contemporary copper production landscapes in Near East, where large, centralized production sites predominate (e.g. Levy et al. Reference Levy, Adams, Najjar, Hauptmann, Anderson, Brandl, Robinson and Higham2004; Ben-Yosef et al. Reference Ben-Yosef, Shaar, Tauxe and Ron2012). Copper production on LBA Cyprus might share more similarities with Colchis (Kassianidou Reference Kassianidou1999; Knapp et al. Reference Knapp, Kassianidou and Donnelly2001; Knapp and Kassianidou Reference Knapp and Kassianidou2008), but heavy disturbances in the Roman and later periods have precluded a clear understanding of the smelting landscape in the rural hinterland. Farther afield, the Colchian metallurgical landscape recalls Central European smelting landscapes, though few cases approach the site densities seen in some parts of Colchis (Stöllner Reference Stöllner2003:434; Stöllner et al. Reference Stöllner, Garner, Gassman, Röttger, Tegtmeier, Yalçin and Zeiler2014, Reference Stöllner, von Rüden, Hanning, Lutz and Kluwe2016; Larreina-Garcia et al. Reference Larreina-Garcia, Cech and Rehren2015).
While new fieldwork relocated and mapped sites excavated during the Soviet period, laboratory analysis showed that most if not all previously identified iron smelting sites are in fact copper smelting sites (Erb-Satullo et al. Reference Erb-Satullo, Gilmour and Khakhutaishvili2014). These findings resolved an apparent discrepancy: alleged iron production evidence predated the appearance of iron in the local archaeological record. It is not entirely clear how these remains were misidentified, as microscopic and chemical analysis was carried out on slag samples in Soviet times (e.g. Tavadze et al. Reference Tavadze, Inanishvili, Sakvarelidze and Zague1984).
Despite these reconsiderations, our new surveys also identified 23 previously unpublished iron smelting sites (Figure 1) in mountainous Adjara and the foothills of Samegrelo. In the former area, located in the deep gorges of the Lesser Caucasus Mountains, iron and copper smelting sites were not found in close proximity. In the latter area, however, iron smelting sites were found a few kilometers from LBA-EIA copper smelting sites (see Khakhutaishvili Reference Khakhutaishvili2009 [1987]:95–104).Footnote 1 Until now, none of these new iron production sites have been dated.
Investigation of metal production sites in the eastern Black Sea region offers a rare opportunity to examine long-term trajectories of metal economies. Few other regions in the Near East have such a rich record of both production sites and metal objects from hoards and mortuary contexts (see Mikeladze Reference Mikeladze1985; Apakidze Reference Apakidze2009; Papuashvili Reference Papuashvili2011, Reference Papuashvili2012). The sociopolitical developments on the Black Sea coast between 1500 and 500 BC are not entirely clear, but the material evidence suggests that social hierarchy and the concentration of wealth—manifested by large grave pits that were probably associated with specific lineages—intensified in the first half of the 1st millennium BC (Papuashvili Reference Papuashvili2011; Skakov Reference Skakov2011). This trend culminated in the spectacular Classical and Hellenistic period graves at Vani (Kacharava and Kvirkvelia Reference Kacharava and Kvirkvelia2008a, Reference Kacharava and Kvirkvelia2009). Around the 6th century BC, Greek colonies appear in the eastern Black Sea, integrating Colchis into a broader network of economic relationships that may have involved the movement of metals (Tsetskhladze Reference Tsetskhladze1992:254). Thus, the social framework in which the metal economy functioned differed significantly from the Levant and the Eastern Mediterranean, where the rise of iron is correlated with the collapse of regional hegemonic states (Mirau Reference Mirau1997; Veldhuijzen Reference Veldhuijzen2012). Thus, the study of metal production in the Black Sea coastal region—and the Caucasus as a whole—provides an important comparative case study, permitting analysis of parallel technological changes in roughly contemporary societies with distinctly different modes of social organization. Research on the Black Sea coast has the potential both to illuminate local economic and social transformations, but also to help resolve broader questions about metallurgical changes taking place across the Europe and the Near East.
This paper discusses a large set of new radiocarbon (14C) dates from both copper and iron smelting sites to track the expansion and contraction of metal production in the Eastern Black Sea area. The immediate goals of the new dating program were threefold. The first was to date the emergence, duration, and end of copper smelting in one intensively surveyed area. The second was to date subtle variations in copper smelting practices, such as the use of zinc-rich ores, identified by recent research (Erb-Satullo et al. Reference Erb-Satullo, Gilmour and Khakhutaishvili2014, Reference Erb-Satullo, Gilmour and Khakhutaishvili2017). The copper smelting technology was such that much of the zinc in the ores seems to have been incorporated into the slag rather than the metal, but low zinc concentrations (up to 1–2%) are documented in LBA-EIA copper-base artifacts and raw metal from Colchis (Abesadze and Bakhtadze Reference Abesadze and Bakhtadze2011 [1988]:346–365). The third goal was to date newly discovered iron smelting sites, building a secure chronology for iron production based on laboratory-analyzed iron smelting debris and accelerator mass spectrometry (AMS) 14C dates.
Though some gaps remain, this research provides a strong foundation for a chronology of copper and iron smelting, providing crucial points of comparison with better-studied systems of bronze and iron production in the Eastern Mediterranean. Most importantly, this research suggests a massive expansion in copper smelting predated the spread of iron, echoing patterns seen in the Eastern Mediterranean (Levy et al. Reference Levy, Adams, Najjar, Hauptmann, Anderson, Brandl, Robinson and Higham2004; Ben-Yosef et al. Reference Ben-Yosef, Shaar, Tauxe and Ron2012; Knapp Reference Knapp2012) and elsewhere in Europe (Chiarantini et al. Reference Chiarantini, Benvenuti, Costagliola, Fedi, Guideri and Romualdi2009; Martinez Cortizas et al. Reference Martinez Cortizas, Lopez-Merino, Bindler, Mighall and Kylander2016). These results further call into question old ideas about iron spreading as a result of an acute, systemic collapse of the bronze industry (e.g. Muhly Reference Muhly1980:47; McNutt Reference McNutt1990:153–154). While certain parts of the Mediterranean undoubtedly saw shifts in trading patterns with the collapse of Late Bronze Age Empire, the spread of iron technology is best viewed as part of an expanding metal economy in which bronze continued to play a major role.
Re-Examination of Previous Dating Programs
The chronology of smelting sites in western Georgia has been a primary concern since the first sites were discovered in the early 1960s. 14C dating of wood charcoal from excavated furnaces using conventional scintillation counting was the primary technique used (Burchuladze and Togonidze Reference Burchuladze and Togonidze1987). While there is some mention of 13C corrections in one of the later date-lists from the Radiocarbon Laboratory at Tbilisi State University (Burchuladze and Togonidze Reference Burchuladze and Togonidze1987:239), there is no indication of which dates took into account these corrections. These samples yielded a number of dates in the early to mid-2nd millennium BC, a highly unusual result for what was then thought to be iron smelting.
The remarkably early dates for supposed iron smelting sites were met with some surprise by both Georgian and foreign archaeologists, who explained these early dates in several ways. David Khakhutaishvili recognized the lack of iron artifacts dating to the early 2nd millennium BC (2009 [1987]:6), but suggested that substantial amounts of iron were destined for export (1988). Others (Mikeladze Reference Mikeladze1990:52; Apakidze Reference Apakidze1991:79–80;) questioned the accuracy of the early 2nd millennium dates, preferring dates in the late 2nd to early 1st millennium BC. Finally, several scholars speculated that the early sites might be copper smelting workshops (Veldhuijzen and Rehren Reference Veldhuijzen and Rehren2007:189), a suggestion supported by analyses of a few slags from similar sites (Nieling Reference Nieling2009:257–259, 363). Comprehensive analyses of production debris, including examination of slag from the earliest-dated sites, showed that they did in fact relate to copper smelting (Erb-Satullo Reference Erb-Satullo2016; Erb-Satullo et al. Reference Erb-Satullo, Gilmour and Khakhutaishvili2014, Reference Erb-Satullo, Gilmour and Khakhutaishvili2015, Reference Erb-Satullo, Gilmour and Khakhutaishvili2017).
Nineteen 14C dates are reported from excavations of copper smelting sites during the Soviet period (Khakhutaishvili Reference Khakhutaishvili2009 [1987]:105–106), while another three are reported from previous excavations in the early 2000s (Khakhutaishvili Reference Khakhutaishvili2006). In addition, several dates taken from inside previously excavated slag samples from Khopcho I (Site 52) were published by Nieling (Reference Nieling2009:80–81, 335, 362), yielding dates in the early 1st millennium BC.
The reliability of the Soviet-period dates, all of which are on wood charcoal, is complicated by several factors. First, new methods of charcoal pretreatment have been developed since the early dates, especially for very old samples (Bird et al. Reference Bird, Ayliffe, Fifield, Turney, Cresswell, Barrows and David1999). Therefore, while the Soviet period dates are relatively “young,” some caution about the accuracy of early dates is warranted, especially since pretreatment is not described in detail (see Burchuladze et al. Reference Burchuladze, Gedevanishvili, Mirianashvili and Togonidze1969, Reference Burchuladze, Gedevanishvili and Togonidze1976; Burchuladze and Togonidze Reference Burchuladze and Togonidze1987). Second, there are significant differences, in one case about 700 14C yr, between samples taken from different levels of the same furnace, as well as from adjacent furnaces at the same site. This is the case for one of the earliest-dated furnaces at Nagomari I, which is about 2 m away from another furnace dated nearly 1000 years later (Khakhutaishvili Reference Khakhutaishvili2009 [1987]:86–94, 105–106). These large date ranges imply a length of occupation inconsistent with the modest size of the slag heap. No stratigraphic evidence supports a theory of intermittent use over a long period.
A third issue in the reanalysis and reinterpretation of legacy 14C dates is the occasional discrepancy between dates as reported by David Khakhutaishvili (Reference Khakhutaishvili2009 [1987]:105–106) and the date lists published by the Tbilisi lab itself (Burchuladze et al. Reference Burchuladze, Gedevanishvili and Togonidze1976; Burchuladze and Togonidze Reference Burchuladze and Togonidze1987). In most cases, differences appear to be the result of rounding errors, and for consistency, dates published by David Khakhutaishvili were used in the recalibration.
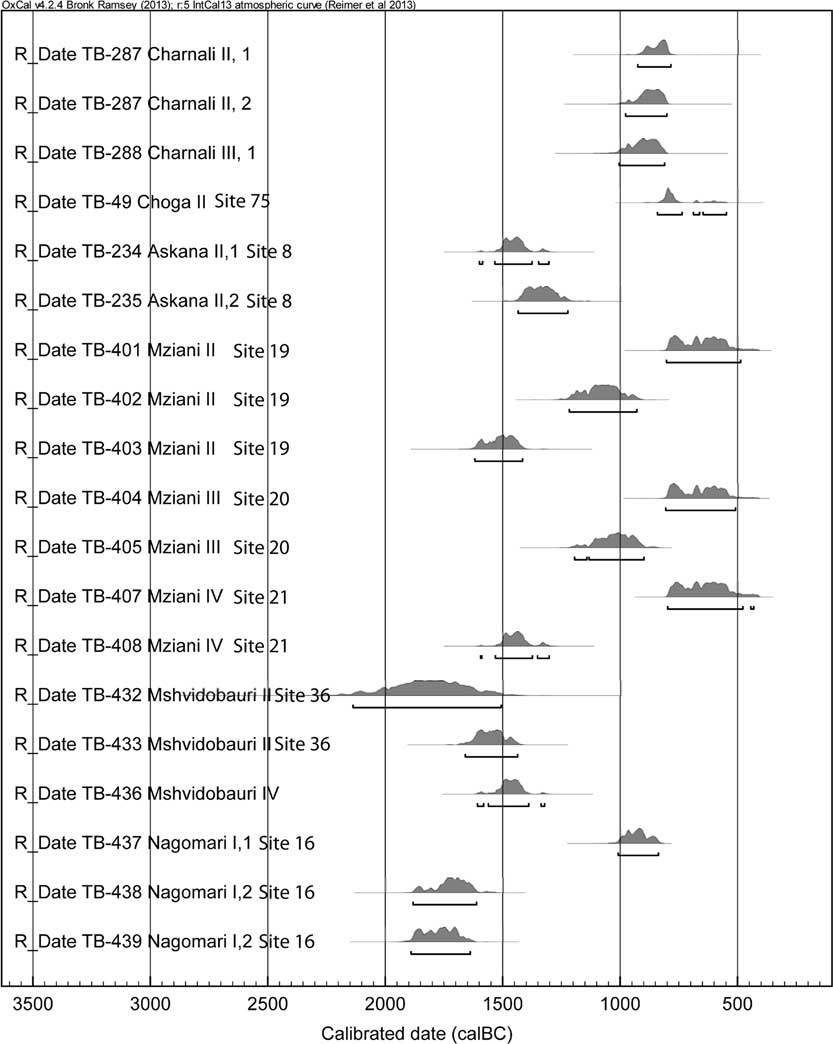
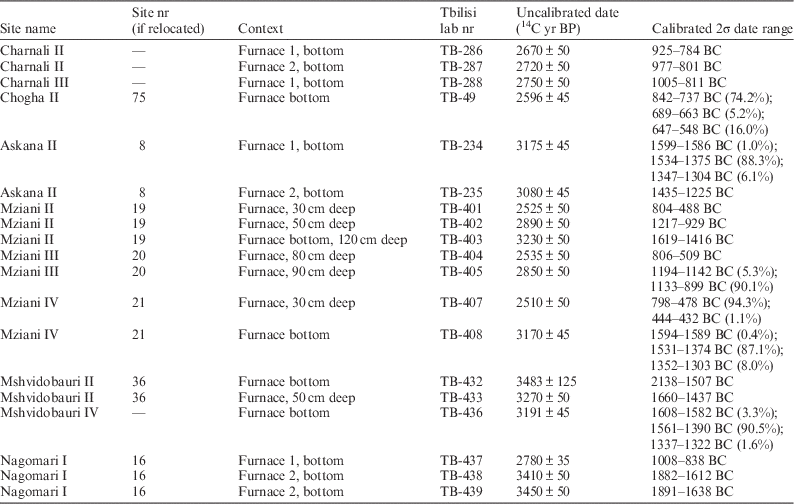
The 19 dates published by David Khakhutaishvili (Khakhutaishvili Reference Khakhutaishvili2009 [1987]:105–106) were recalibrated using the most recent IntCal13 calibration curve (Reimer et al. Reference Reimer, Bard, Bayliss, Beck, Blackwell, Bronk Ramsey, Buck, Cheng, Edwards, Friedrich, Grootes, Guilderson, Haflidason, Hajdas, Hatté, Heaton, Hoffmann, Hogg, Hughen, Kaiser, Kromer, Manning, Niu, Reimer, Richards, Scott, Southon, Staff, Turney and van der Plicht2013) (Figure 2 and Table 1). 95% confidence intervals span the period from about 2000 to 500 BC. Some dates, all from the Supsa-Gubazeuli area, have significant portions of their 95% confidence intervals before 1500 BC. If these early dates are correct, this would suggest that pit furnace smelting of copper began during the Middle Bronze Age. Nevertheless, some of these early dates are paired with much later dates from adjacent furnaces. This may reflect later reuse of the site, but, as discussed above, the balance of evidence suggests otherwise.
Calibrated probability density curves for 14C dates reported by Khakhutaishvili (Reference Khakhutaishvili2009 [1987]:105–106). The site Charnali II and Charnali III are in the Chorokhi production area (near Sites 51 and 52 in Figure 1) but they were not relocated, while Chogha II (Site 75) is in the Khobi-Ochkhomuri area. The remaining sites, most of which were relocated in our survey, are in the Supsa-Gubazeuli area (see Table 1 and Figure 1).

Recalibration of dates reported in Khakhutaishvili (Reference Khakhutaishvili2009 [1987]:105–106). Note that the Chogha and Charnali sites are not located within the Supsa-Gubazeuli production area (see Figure 1).

Dating the end of copper smelting in these areas is more challenging due to the 800–400 BC Hallstatt plateau in the calibration curve. Error ranges on the uncalibrated dates from the Tbilisi laboratory are typically about 50 years, resulting in calibrated 95% confidence intervals for dates like TB-401, TB-404, and TB-407 that span several centuries in the late 9th to early 5th centuries BC. Because new AMS 14C dates on charcoal of similar age typically have errors in the range of 20–30 yr, the new dating program provides more precise determinations, especially for dates approaching the 800–400 BC plateau.
In aggregate, previous dating programs have demonstrated that copper smelting was widespread in Colchis during the late 2nd and early 1st millennium BC. However, the variability in 14C dates, sometimes within a single furnace, requires further investigation. To refine the chronology of metal production during this period, a new program of AMS 14C dating was necessary.
METHODOLOGY
All samples selected for 14C dating were wood charcoal from stratified metallurgical contexts (furnaces and slag heaps) or from inside chunks of slag collected from the surface of the site. Several different considerations affected the selection of sites to be dated. Not all sites were well-preserved, and disruption of the slag heap, either from previous excavation and/or agricultural activities, limited the available options. Other sites were covered by very dense vegetation, making a complete exploration of the slag heap and recovery of datable material difficult.
Sites that yielded the richest assemblages of production debris were targeted for dating, allowing us to build a chronology of technical practices. Despite the overall homogeneity in the character of production debris at all copper production sites, unusual features at some sites merited dating. For instance, zinc-rich slags were common at some sites, but almost totally absent at others (Erb-Satullo et al. Reference Erb-Satullo, Gilmour and Khakhutaishvili2014, Reference Erb-Satullo, Gilmour and Khakhutaishvili2017). Dates from both types of sites were obtained to determine whether these differences were synchronic or diachronic. Another site chosen for dating, Site 29 (Askana III, 2-3) was identified during Soviet excavation as having an atypical furnace structure, built into the hillside with one side open. David Khakhutaishvili dated this furnace to the Classical period, but no 14C dates are reported (2009 [1987]:61, 65). Site 41 yielded unusual evidence for the production of tin bronze by mixing copper metal with tin ore, probably of local origin (Erb-Satullo et al. Reference Erb-Satullo, Gilmour and Khakhutaishvili2015). In one case, a previously dated site was selected for re-dating as a check on the accuracy of earlier determinations. Site 8 (Askana II) was specifically chosen because it had several Soviet-period dates, allowing some cross-comparison with the earlier program of dating. Because this site was excavated in the Soviet period, and it was not possible to delineate trench boundaries and backdirt piles, only charcoal samples encased within pieces of slag were dated.
These 33 dates (23 from copper smelting sites and 10 from iron smelting sites) clarify the expansion and contraction of copper production and provide the first dates for securely identified iron smelting in the region. Two additional samples (OxA-30015 and OxA-30145) from a non-metallurgical (and possibly non-anthropogenic) context near Site 17 yielded early 1st millennium AD dates, and are not included in this analysis. Laboratory reports noted low wt.% carbon yields for some samples encased in slag. This was likely due to iron oxides permeating the wood, as observed in microscopic analysis of polished slag samples.
Inbuilt age is invariably an issue to consider in dating wood charcoal. Colchian metalworkers probably burned the wood relatively soon after cutting, given the wet, rot-prone climate and the high fuel demands of metallurgy (see Levy et al. Reference Levy, Adams, Najjar, Hauptmann, Anderson, Brandl, Robinson and Higham2004:869 and Erb-Satullo et al. Reference Erb-Satullo, Gilmour and Khakhutaishvili2015:263 for similar arguments). The lack of any significant settlement at smelting sites means the use of old wood from dismantled wooden buildings was minimal. Repeat dates on several sites show that inbuilt ages in excess of ~100 years are unlikely. There is often significant overlap between repeat dates, and differences are typically about 100 years or less. OxA-33545 (RC-12-55) is a rare exception, being younger than the other three dates from the same site, all three of which are in close agreement despite coming from different contexts. This discrepancy is difficult to explain as a result of old wood, since in those cases, outliers are usually older than other dates (see Dee and Bronk Ramsey Reference Dee and Bronk Ramsey2014:87).
RESULTS
New 14C Dating on Copper Smelting Sites
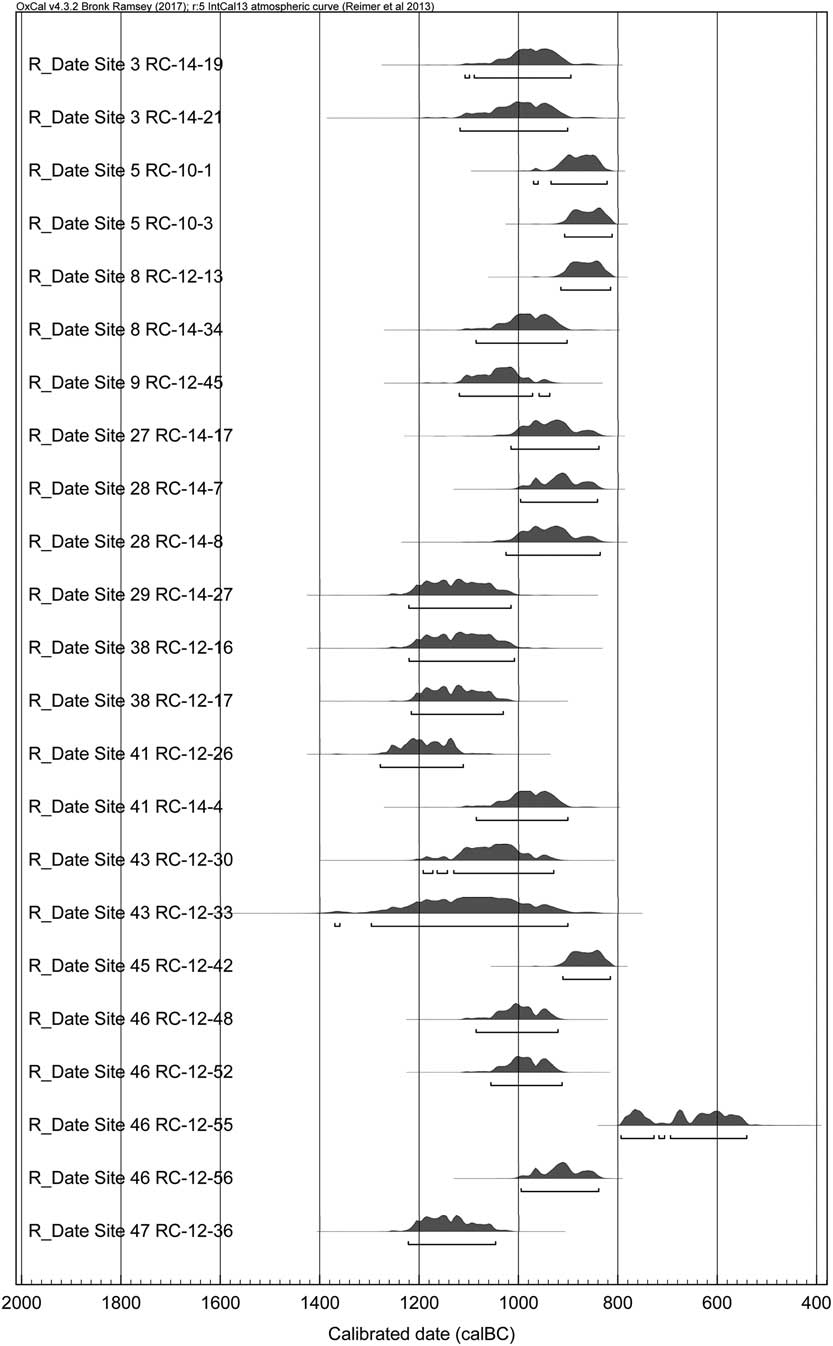
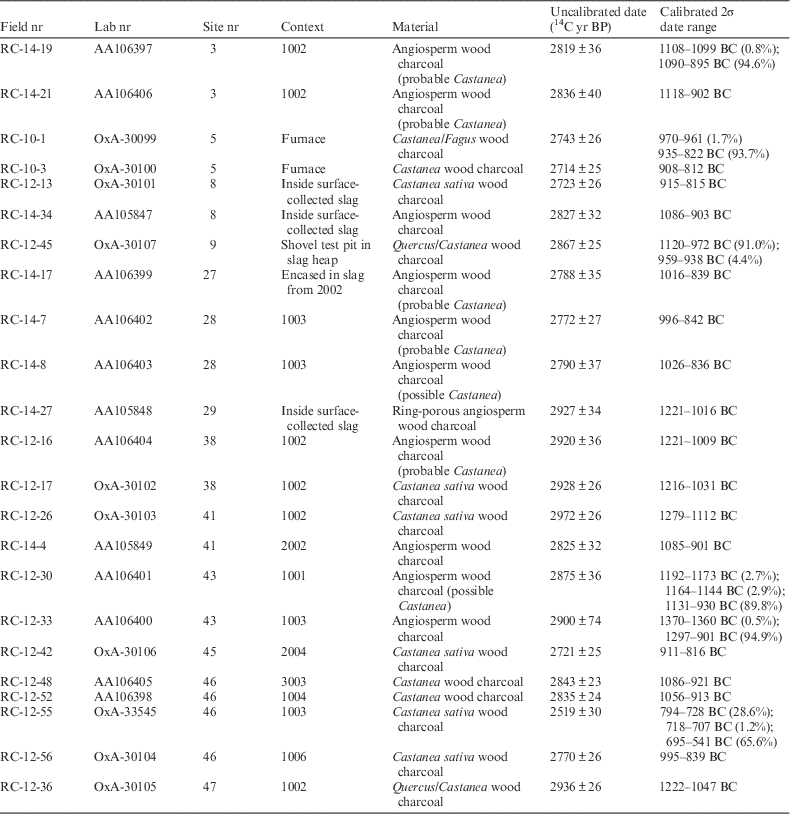
A total of 23 AMS 14C dates were obtained from copper smelting contexts in the Supsa-Gubazeuli production area, more than doubling the total number of 14C dates from this area (Figure 3 and Table 2). The new series of dates suggests that the time span of the copper smelting industry was shorter than previously thought, and that its intensity must have been correspondingly greater. While 95% confidence intervals of recalibrated Soviet-period dates span a range from 2000 to 500 BC, the new set of 14C dates, with a comparable number of dates, spans a much tighter interval between about 1300 and 800 BC. Bayesian modeling the length of the interval between the beginning and the end of copper smelting using OxCal produced a duration of 321–526 yr (95% confidence). By comparison, similar modeling of the Soviet-period dates for the Supsa-Gubazeuli region yielded an interval estimation of 977–1638 yr (95% confidence).
Calibrated probability density curves for AMS 14C dates from copper smelting sites.

AMS 14C dates from copper smelting sites. RC-12-26 was reported in Erb-Satullo el al. (Reference Erb-Satullo, Gilmour and Khakhutaishvili2015).

Admittedly, the sites with the earliest Soviet-period dates, Nagomari I (Site 16) and Mshvidobauri II (Site 36), were not redated in the new program. However, the redating of Askana II (Site 8) to the 11th to 9th centuries BC suggests that Soviet period dates, which placed the site in the 16th to 13th centuries BC, were several hundred years too old. It is conceivable that one would see similar shifts towards younger ages had new dates been obtained from the other early sites. On the other end of the chronological span, the only new date after 800 BC is OxA-33545 (RC-12-55), a date which is anomalous relative to the other three dates from Site 46 (see Methods section). These new 14C dates strongly suggest that smelting in this area declined precipitously around 800 BC.
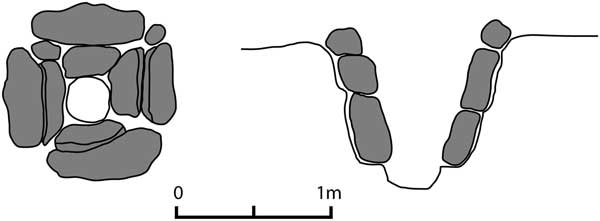
Correlating scientific analyses of production debris with 14C dates allows technological variations to be placed in a chronological framework. Late Bronze and Early Iron Age copper smelting in Colchis involved a multi-stage process of smelting in deep pit furnaces to extract copper metal from sulfide ores, probably with the production of matte as an intermediate stage (Figure 4) (Erb-Satullo et al. Reference Erb-Satullo, Gilmour and Khakhutaishvili2014, Reference Erb-Satullo, Gilmour and Khakhutaishvili2015). Two stages of this production process produced large quantities of slag, which are clearly distinguished by their macroscopic appearance. An earlier stage of production resulted in dense cakes of slag that cooled over copper-rich matte or matte/metal mixture, while the later stage involved the scraping or pouring off of slag from smaller reaction vessels. The use of a complex system of tuyères (see Erb-Satullo et al. Reference Erb-Satullo, Gilmour and Khakhutaishvili2015:150) to produce a direct air blast and the well-insulated structure of the deep pit furnaces allowed Colchian metalworkers to maintain high furnace temperatures and fluid slags over fairly large reaction volumes. These thermodynamic conditions permitted larger furnace charges and greater recovery of metal through more effective separation of slag and metal-bearing phases. It is clear that these innovations in smelting technology underpinned the massive increase in the quantity of bronze artifacts recovered in hoards and mortuary contexts in the Late Bronze and Early Iron Age (see Lordkipanidze Reference Lordkipanidze2001a; Mikeladze Reference Mikeladze1990:69). This technology is broadly consistent across all copper smelting sites, but there are some slight variations.
Copper smelting pit furnace from Askana II (Site 8). After Khakhutaishvili (Reference Khakhutaishvili2009 [1987]:58).

Metalworkers at some sites exploited copper ore deposits with significant zinc sulfide accessory minerals, producing slags that contain up to 15% Zn (oxide wt. %) (Erb-Satullo et al. Reference Erb-Satullo, Gilmour and Khakhutaishvili2014:153–154). Interestingly, zinc-rich slags from the second slag-producing stage show evidence of high fluidity, approaching the morphologies of traditional tap slags (Erb-Satullo et al. Reference Erb-Satullo, Gilmour and Khakhutaishvili2015:269–270). Other metalworkers exploited deposits that contained virtually no zinc, and the corresponding slags are also zinc-poor. These different ore sources were likely not far from one another, as the copper mineralizations 5–15 km from the survey area are known to be zoned. While these areas were not exploited in modern times, geological surveys during the Soviet period mention numerous copper ore deposits in this area, and zinc sulfides are mentioned as accessory minerals in some of them (Gabunia Reference Gabunia1933:556–557). Sites with many zinc-rich slags (e.g. Sites 8, 28, and 29) span the same range as sites with few if any zinc-rich slags (e.g. Sites 5, 27, and 46) indicating that these two ore types were almost certainly exploited simultaneously. These results show that exploitation of zinc-rich ores was not a chronological shift caused by the progressive mining of a single deposit, but the simultaneous exploitation of multiple ore deposits by different groups of miners and metalworkers active within this ore-bearing zone (Erb-Satullo et al. Reference Erb-Satullo, Gilmour and Khakhutaishvili2017).
Another feature of copper smelting technology with possible chronological significance is the open-sided furnace noted at Askana III, 3. David Khakhutaishvili (Reference Khakhutaishvili2009 [1987]:61) dated this site to the early Classical period on the basis of its atypical morphology and the red-brown color of associated ceramic material.Footnote 2 Instead of the typical pit structure, this furnace appears have been built into the slope, with one side open. This shape would have facilitated slag tapping, easing the process of separating slag and metal in the molten state. It may also have improved air circulation within the furnace, though this is difficult to confirm. The site was relocated and designated Site 29 in our new survey, though it was not possible to re-examine the structure of the unusual furnace. Somewhat unusual red-brown furnace ceramic was noted upon relocation of the site, but this coloration is almost certainly due to more oxidizing conditions in the metallurgical process, and is not a reliable chronological indicator. Because of its potential implications for the development of different technological practices, obtaining a 14C date from this site was of significant importance. Because the site was extensively excavated during the Soviet period, stratigraphic disturbances were likely, so the only secure sample available was one encased within a chunk of slag collected at the site. Interestingly, the sample yielded a date (AA105848) of 1221–1009 BC (95% confidence). The surface-collected slag was not directly associated with the open-sided furnace, but it is reasonable to conclude that the furnace and its adjacent slag heap are roughly the same age, especially given the modest size of heap and the relatively short periods of occupation estimated for these kinds of sites.
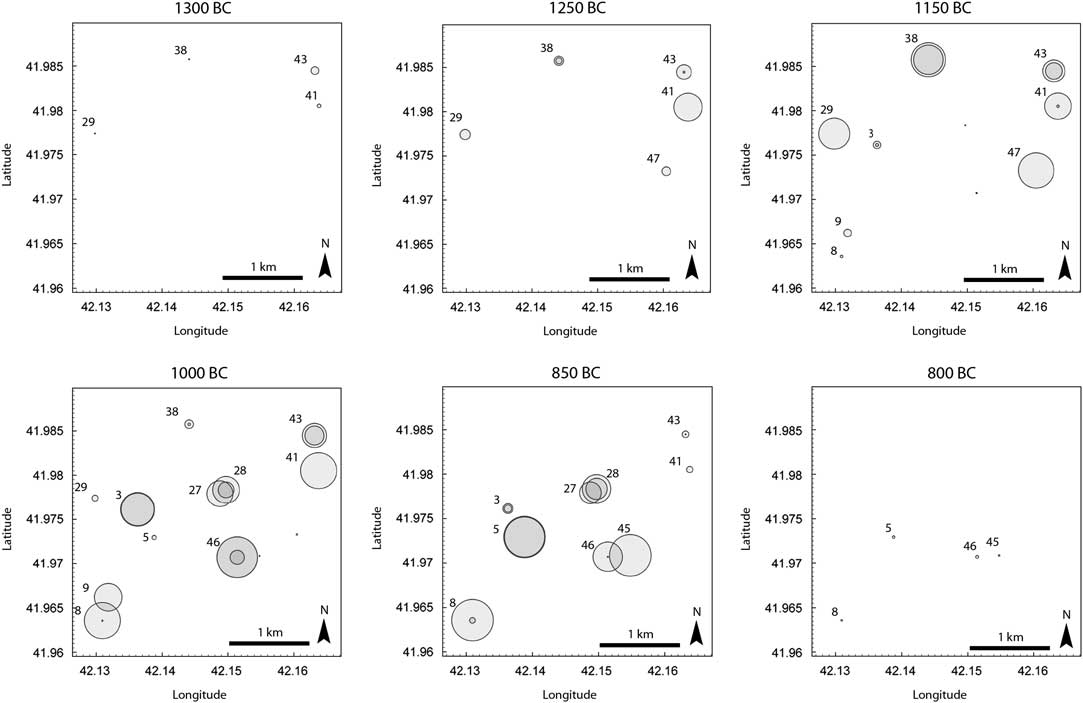
In order to examine possible spatial shifts in production over time, 14C dates were plotted on a map (Figure 5). Clear shifts are difficult to discern given that just 13 of 49 mapped sites were dated. It is possible that there is a slight southward shift over time, from the area around Sites 38, 41, and 43, which are located at the margins of the flatter Supsa River plain, to the areas of Sites 5, 8, 45, and 46, which are farther up in the foothills. Nevertheless, the pattern is slight and the distances are not far. By contrast, the rapid rise in dated sites ca. 1300–1200 BC and the rapid decline in dated sites after 800 BC are far more significant than any spatial shift between those dates.
Spatiotemporal patterning of copper smelting sites in the Supsa-Gubazeuli area. Each circle represents a 14C date, positioned according to the site from which it came. Size of circle is proportional to the probability density of a date for a particular time.

New 14C Dates from Iron Smelting Sites
The recognition that numerous sites previously thought to be iron smelting workshops were, in fact, copper smelting workshops profoundly alters the picture of iron production in Colchis. To date, no site identified as iron smelting in published Soviet period investigations of these areas has been confirmed by detailed analysis of the slags. However, new investigations in the Skhalta-Adjaristskali and Khobi-Ochkhomuri areas have revealed that substantial numbers of iron production sites do exist, though none have been dated to the 2nd millennium BC. Iron smelting slags at the dated sites were identified by optical microscopic analysis of polished sections, coupled with scanning electron microscopy and, in a few instances, powder WDS-XRF analysis. They are characterized by a total absence of copper-bearing phases, as well as the presence of metallic iron, wüstite, and fayalite. Initial analysis of a few samples was reported by Erb-Satullo et al. (Reference Erb-Satullo, Gilmour and Khakhutaishvili2014:154–155), with more substantial analyses confirming these identifications (see Erb-Satullo Reference Erb-Satullo2016:182ff).
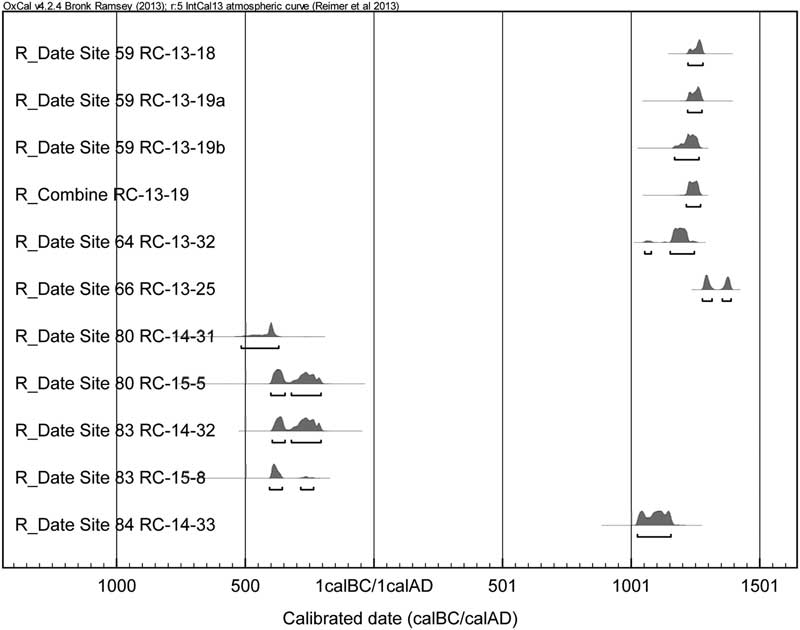
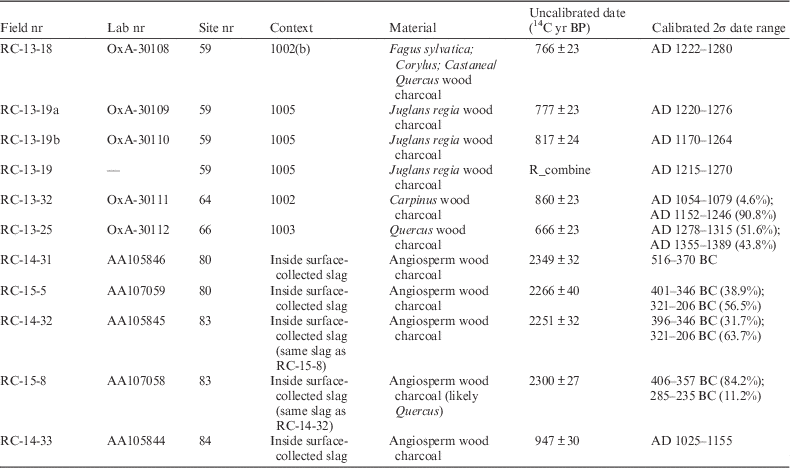
Ten 14C measurements on nine samples (one sample had two measurements) from six iron smelting sites in Colchis provide the beginnings of a revised chronology of iron smelting (Figure 6 and Table 3). Three iron smelting sites from the Skhalta-Adjaristskali area and one from the Khobi-Ochkhomuri area date to the 11th to 14th centuries AD. This period corresponds roughly to Medieval Georgia’s Golden Age, when David the Builder (AD 1089–1125) united the Georgian kingdom and Queen Tamar (AD 1178–1213) ruled a sizable territory, with Georgian armies campaigning all the way to Tabriz and the Caspian Sea (Rayfield Reference Rayfield2012:107–117). Four dates from two iron smelting sites in the Khobi-Ochkhomuri area point to a deeper history of iron production, pushing direct evidence for iron production in western Georgia back to the Classical and Hellenistic periods. Iron smelting remains at Sites 80 (Jumiti I) and 83 (Zumi II) indicate iron was produced locally during a period that, until now, had yielded only limited direct evidence for metal production, especially in comparison with the preceding periods.
Calibrated probability density curves for AMS 14C dates from iron smelting sites.

AMS 14C dates from iron smelting sites. Sample RC-13-19 was measured twice.

DISCUSSION
In discussing the broader significance of dates from copper smelting sites in the Supsa-Gubazeuli area, there are several important considerations. First, to what extent does the expansion of LBA-EIA copper production in this area reflect similar expansion in other areas across the region? Second, does the apparent cessation of production at around 800 BC reflect a region-wide contraction of copper production, or merely a localized decline? The third issue to consider is the relationship between this massive expansion of copper production and the proliferation of iron artifacts in the first half of the 1st millennium BC.
With regard to the first question, there are several direct and indirect lines of evidence suggesting that the explosion of metal production after 1300 BC is part of a broad expansion of metal production in the region. Smelting sites of the type found in the Supsa-Gubazeuli area are common throughout Western Georgia, and earlier scientific dating programs confirm their general Late Bronze-Early Iron Age date (Gzelishvili Reference Gzelishvili1964; Khakhutaishvili Reference Khakhutaishvili2009 [1987]). Metal production implements have been found in late 3rd millennium and early 2nd millennium BC contexts (Baramidze et al. Reference Baramidze, Jibladze and Dzidziguri2002; Mikeladze and Khakhutaishvili Reference Mikeladze and Khakhutaishvili1985:Pl. 4). Yet, with the exception of the outlier Soviet period dates from Sites 16 and 36 discussed above, nothing comparable to the LBA-EIA pit furnaces has been dated to before 1500 BC. The area investigated by our current project undoubtedly represents a tiny fraction of the total production landscape. Moreover, field notebooks from earlier surveys, carried out when much of the land was under tea cultivation, strongly suggest that there are even sites within our Supsa-Gubazeuli survey area that we were unable to relocate. Thus, site densities were likely higher than what we recorded. Even if the site densities in the Supsa-Gubazeuli area are higher than elsewhere in the region, vast numbers of these small smelting sites likely remain undiscovered in the densely vegetated foothills of Western Georgia. The increase in production evidence coincides with a similar increase in the number of metal artifacts from the late 2nd millennium onwards, in hoards, and mortuary assemblages (Mikeladze Reference Mikeladze1985; Lordkipanidze Reference Lordkipanidze2001a; Papuashvili Reference Papuashvili2011; Skakov Reference Skakov2011). All these lines of evidence suggest that the late 2nd millennium BC expansion in copper production recorded in our survey was part of a massive, region-wide phenomenon. While production sites are particularly well represented in the archaeological record of the Black Sea coastal region, elaborate and abundant copper-base artifacts dating to this period are well-documented in other parts of the Caucasus (Esayan Reference Esayan1966; Chernykh Reference Chernykh1992:275–295; Picchelauri Reference Picchelauri1997; Gambaschidze Reference Gambaschidze2001; Meliksetian et al. Reference Meliksetian, Kraus, Pernicka, Avetissyan, Devejian and Petrosyan2011).
On the other hand, the drop-off in 14C dates following 800 BC may not reflect an overall contraction of the copper smelting industry. As attractive as the idea of an abrupt collapse in bronze production coinciding with the rise of iron might be, other evidence suggests precipitous, region-wide collapse ca. 800 BC is unlikely. Collective graves with large assemblages of copper-alloy and iron artifacts appear during the 8th–6th centuries BC (Mikeladze and Baramidze Reference Mikeladze and Baramidze1977; Mikeladze Reference Mikeladze and Khakhutaishvili1985; Mikeladse Reference Mikeladse1995; Papuashvili Reference Papuashvili2011; Skakov Reference Skakov2011), suggesting a long period of coexistence between the two industries. It is difficult to argue that all these copper-alloy artifacts, some of which take new forms during this period, are heirloom objects or reworked metal left over from a defunct industry. A more probable course of events is a shift in the location, and perhaps the organization, of copper smelting. Elsewhere, we have argued for a social and economic model of production that resembles a kind of slow-motion gold rush, in which small groups of independent miners had an aggregate large-scale impact on the landscape (Erb-Satullo Reference Erb-Satullo2016:263-264; Erb-Satullo et al. Reference Erb-Satullo, Gilmour and Khakhutaishvili2017). In this model, as new sources were found, production might have shifted to another region where fresh deposits were located. In this regard, Site 34, an undated site located higher up in the narrow Vakijvari gorge, is perhaps relevant. Indeed, metal production debris from the site of Sairkhe (6th–4th centuries BC) suggests the continuation of metallurgical traditions (Nadiradze Reference Nadiradze1990:156, 163, Pl. 123).
The implication of these considerations is that one must be careful not to over-interpret absence of production for a certain period. After all, heavy vegetation poses challenges to metallurgical survey in the lowlands and the foothills, while most of the higher mountain gorges remain virtually unexplored (for tantalizing hints, see Chartolani Reference Chartolani2001; Maisuradze and Gobedzhischvili Reference Maisuradze and Gobedzhischvili2001; Sulava Reference Sulava2001).
The evidence for a massive expansion of copper and bronze production at the end of the Bronze Age has implications for understanding the spread of iron in the region. Some uncertainty remains with regard to the timing and pattern of iron adoption in this region, but it is clear that major increases occurred during the 8th–6th centuries BC (Papuashvili Reference Papuashvili2011). The existence of a copper smelting tradition involving complex multi-stage pyrotechnological processes (Erb-Satullo et al. Reference Erb-Satullo, Gilmour and Khakhutaishvili2014, Reference Erb-Satullo, Gilmour and Khakhutaishvili2015) undoubtedly had an impact on the spread of iron metallurgy in the region. The 14C dating shows that a number of technical practices that are not strictly necessary for basic copper smelting, but are necessary for iron smelting, were already features of Colchian metallurgy prior to the adoption of iron. First, copper metallurgists were able to maintain high temperatures over large reaction volumes, resulting in large cakes of fully molten slag 20–30 cm in diameter (Erb-Satullo et al. Reference Erb-Satullo, Gilmour and Khakhutaishvili2015:261). These high temperatures were likely achieved by smelting in well-insulated pit furnaces with elaborate systems of air delivery that remain poorly understood (Erb-Satullo Reference Erb-Satullo2016:144). Second, copper metalworkers in Colchis had mastered the process of physically separating slag and metal at high temperatures (e.g. through tapping or skimming off slag from the surface of a molten copper-rich ingot). These features of copper smelting are certainly not unique to the region, but they reflect a significant body of underlying technical knowledge that would have facilitated the learning of new ways of manipulating iron ores at high temperature.
To date, no Colchian iron smelting sites have been dated to the Early Iron Age, especially to the crucial period in the 8th–6th century BC when massive amounts of iron, almost certainly of local origin, are found in mortuary contexts (Papuashvili Reference Papuashvili2011, Reference Papuashvili2012). The Classical period dates on clear iron smelting remains from Samegrelo are thus far the earliest known from western Georgia.
Given that the first mention of Colchis as the home of the mythical Golden Fleece occurs around the period of Greek colonization, scholars have long thought that the Golden Fleece myth was at least partly derived from real metallic wealth, which drew the Greeks to the rain-drenched, marshy shores of Colchis (Lordkipanidze Reference Lordkipanidze1983:126; Reference Lordkipanidze2001b). The region’s gold resources naturally feature prominently in these discussions but other metals and materials are occasionally mentioned as well (see Lordkipanidze Reference Lordkipanidze1979:98–100; Tsetskhladze Reference Tsetskhladze1992:254; Chqonia Reference Chqonia2008; Hauptmann Reference Hauptmann2011:175; Okrostsvaridze et al. Reference Okrostsvaridze, Gagnidze and Akimidze2016).
Some scholars have argued that there is little evidence for metal production during the period of Greek colonization, and therefore the metal trade was likely not what drew the Greeks to the region (Tsetskhladze Reference Tsetskhladze1995; Tsetskhladze and Treister Reference Tsetskhladze and Treister1995). Questions about the scale of production and exportation remain, but the new dates suggest that local iron production did take place during the mid- to late-1st millennium BC. Additional evidence for Classical period metal workshops at Sairkhe (Nadiradze Reference Nadiradze1990:156), not to mention the quantity and diversity of metal objects found at Vani (Kacharava and Kvirkvelia Reference Kacharava and Kvirkvelia2008b), makes it clear that traditions of metal production developed in the LBA-EIA continue into the Classical and Hellenistic periods. Whether or not metals played a role in motivating Greek colonization in the region is a separate issue, but these new results suggest that Tsetskhladze’s (Reference Tsetskhladze1995) argument for minimal local metal production in Classical period Colchis needs revising.
It is significant that Samegrelo contains the earliest evidence for local iron production. Some of the more extensive assemblages of 8th–6th century BC iron artifacts come from sites like Ergeta, Dghvaba, and Tsaishi, all located in this region (Mikeladze et al. Reference Mikeladze, Migdisova and Papuashvili1985; Apakidze Reference Apakidze2009:412–413; Papuashvili Reference Papuashvili2012). Despite a lack of iron smelting sites dating to before 500 BC, it seems likely that the large quantities of iron artifacts found in graves of the 8th–6th centuries BC were locally made. As mentioned above, close parallels of certain artifact types executed in both copper-alloy and iron suggest a close connection between copper-alloy and ironworking traditions. Research on properly identified iron smelting sites is very much in its infancy, and it is likely that future work in the region will uncover earlier iron smelting sites dating to this crucial 8th–6th century BC period.
The final episode of metal production identified during our survey and testing of metal production sites belongs to the Medieval period. While only four such iron smelting sites have been dated, it is perhaps significant that none of them post-date AD 1400. Beginning in AD 1220 with the Mongol invasion, to the early 15th century, the Georgian kingdom suffered a series of severe depredations at the hands of the Mongols, Chorasmians, Timurids, and others, while bubonic plague devastated the region in the mid-14th century (Rayfield Reference Rayfield2012:118–163). It is possible that the rural iron smelting enterprises of mountainous Adjara owed their rise to the increased demand of an expansionary, though frequently embattled state, and their decline to the combination of disease and invasion that followed. Indeed, the correlation between iron smelting dates and these events may mean that the political and social collapse caused by disease and invasion reverberated deep into the rural hinterland. The small number of dated sites precludes certainty, but these results present intriguing hypotheses.
CONCLUSIONS
Metal Production in Colchis in the 2nd and 1st Millennium BC
14C dating of copper and iron smelting sites illuminates various episodes in the ebb and flow of production in a region exceptionally rich in metallurgical remains. The most intensively dated copper smelting landscape, near the Supsa and Gubazeuli rivers, was active for roughly 300–500 years between 1300 and 800 BC, a shorter and more intense period of exploitation than previously thought. Correlation of 14C dates with key technical practices demonstrates that copper metallurgists had developed pyrotechnical skills which significantly lowered barriers to the learning and transmission of iron technology. Importantly, 14C dating suggests that these practices predate the widespread appearance of iron, meaning that these technical behaviors are unlikely to be retroactive influences from an already established local iron smelting industry.
While the social organization of this metal production landscape differed dramatically from contemporary production landscapes in the Levant (Erb-Satullo et al. Reference Erb-Satullo, Gilmour and Khakhutaishvili2017), the timing of this expansion—around the time of iron adoption—echoes patterns seen farther south (Levy et al. Reference Levy, Adams, Najjar, Hauptmann, Anderson, Brandl, Robinson and Higham2004). In many areas, it seems that iron emerged as part of a suite of expanding metallurgical enterprises, rather than a direct response to scarcity. The paucity of production sites, both bronze and iron, dated to the 8th to 6th centuries BC remains an important gap, but one that will likely be filled upon further investigation.
Acknowledgments
The authors would like to thank Amiran Kakhidze for his support in carrying out the fieldwork. Fieldwork team members were Marc Cox, Amy Lawn, Anthony Gilmour, Emzar Kakhidze, and Mark Pollard. Dana Challinor and John Marston provided identifications for wood charcoal samples submitted to Oxford and Arizona Radiocarbon labs, respectively. Michael Dee provided some helpful comments on Bayesian modeling of 14C dates. This article is based on a dissertation chapter written by the first author and read by committee members Jason Ur, Karl Lamberg-Karlovsky, Rowan Flad, and David Killick. Research was funded by an NSF Doctoral Dissertation Improvement Grant (BCS-1338893), an NSF Graduate Research Fellowship (DGE0644491 and DGE1144152), as well as grants from the Harvard Davis Center for Russian and Eurasian Studies, the Harvard Anthropology Department, the Jens Aubrey Westengard Fund, the British Academy (SG100285), and the National Geographic Society (GEFNE30-11).