I. INTRODUCTION
Micromechanical testing, in particular nanoindentation and microcompression, has been used extensively to study local material properties or the behavior of materials only available at small scales, such as thin films. Both techniques are also being used to study effects of size on plasticity.Reference Kraft, Gruber, Mönig and Weygand1, Reference Uchic, Shade and Dimiduk2
The majority of experimental data collected to date is based on room temperature measurements. However, characterizing deformation requires the ability to test over as wide a range of temperatures as possible to enable the study of properties under operating conditions as well as the determination of activation energies and volumes. This is complicated by the difficulties encountered at elevated temperatures, such as oxidation of the sample, degradation of the tip material and geometry, thermal drift and heating of electronic components.Reference Duan and Hodge3–Reference Trenkle, Packard and Schuh5 Of those experiments carried out at high temperatures, most are carried out in air,Reference Duan and Hodge3, Reference Trenkle, Packard and Schuh5–Reference Xia, Li and Dong8 resulting in either a limitation of the temperatures or materials tested.
To avoid oxidation, testing can be carried out under protective atmosphere, such as argon.Reference Everitt, Davies and Smith4, Reference Trenkle, Packard and Schuh5, Reference Packard, Schroers and Schuh9, Reference Sawant and Tin10 However, like in air, stable experiments are difficult to achieve with an unheated indenter tip, particularly in pyramidal indentation, where the changing contact area leads to a varying drift rate as the heating rate of the tip increases under load so that any correction of the drift component becomes difficult and requires a computational analysis involving modeling of the contact.Reference Trenkle, Packard and Schuh5 Heating of both indenter tip and sample can overcome this difficulty and very low drift rates have been reported in both air and argon once thermal equilibrium at the contact is achieved.Reference Everitt, Davies and Smith4, Reference Korte and Clegg11 However, in pyramidal indentation the extracted results are very sensitive to the shape of the indenter tip and significant changes in the indenter tip shape have indeed been found to occur at elevated temperatures even under a protective argon atmosphere and partial vacuum.Reference Trenkle, Packard and Schuh5, Reference Wheeler, Oliver and Clyne12 To provide sufficient protection for the indenter tip and sample, large amounts of gas are required for continuous purging, such that oxygen leaking into the test chamber and any other substances evaporating from the hot equipment are removed continuously. Ideally, experiments are carried out in vacuum, where continuous evacuation of the test chamber can offer improved protection from oxidation or contamination.
Nanoindentation experiments in vacuum on heated samples have previously been reported by Trenkle et al.Reference Trenkle, Packard and Schuh5 who found that as the atmosphere, and thereby any convective stabilization medium, is removed, indentations become increasingly unstable, giving drift rates of tens of nanometers per second on good thermal conductors such as copper (k Cu ≈ 400 W·m−1·K−1)Reference Weast and Astle13 or aluminum (k Al ≈ 230 W·m−1·K−1).Reference Weast and Astle13 This limited the duration of any experiment to the order of a second and the maximum test temperature in vacuum to 200 °C on copper. Indentation of an insulator (fused silica, k FS ≈ 1.4 W·m−1·K−1)Reference Weast and Astle13 in vacuum on the other hand was possible at up to 400 °C, above which the increasing noise in the equipment electronics prevented further measurements.
However, even if these technical difficulties encountered in vacuum are overcome, changes in indenter tip shape would still be expected at high temperatures. For instance, Wheeler et al.Reference Wheeler, Oliver and Clyne12 found that exposure of low energy crystal planes at low oxygen levels led to ridge and edge formation on diamond indenters. This also points to the danger of thermally activated material transport mechanisms at high temperatures driven by the reduction in surface energy, which might lead to an alteration of the tip shape even in vacuum.
Both the detrimental effects of varying thermal drift during a pyramidal indentation and sensitivity of the extracted properties to changes in indenter tip shape can be minimized if testing is carried out using simpler contact geometries with an approximately constant contact area. This might be achieved by using a flat punch geometry, although this is not normally used in hardness measurements on metals or ceramics. Microcompression of cylindrical micropillars also offers a constant contact area and has been shown to allow the interrogation of individual slip systems and extraction of directional plastic properties,Reference Korte and Clegg14 which tends to require varying degrees of modeling in indentation due to the three-dimensional stress state under the indenter tip.Reference Bouvier and Needleman15, Reference Korte, McLaughlin, Farrer and Clegg16 Furthermore, the reduction in sample size in microcompression leads to a suppression of cracking in uniaxial testing of macroscopically brittle materials, allowing plastic deformation to be studied more easily than in macroscopic tests under confining pressure.Reference Korte and Clegg11, Reference Korte, Barnard, Stearn and Clegg17–Reference Gerberich, Michler, Mook, Ghisleni, Östlund, Stauffer and Ballarini20 In characterizing material deformation, it is important to be able to test over a wide range of temperatures to capture the thermal activation of flow, otherwise only accessible by variations of the strain rate.Reference Frost and Ashby21 Many materials developed for use at high temperature also contain brittle phasesReference Reed22 and high temperature microcompression is therefore well suited for the characterization of plasticity in these materials as it combines suppression of cracking with the possibility of capturing the materials’ anisotropy and thermally activated deformation mechanisms, and it allows testing near the operating temperature.
The work presented here aims to extend the temperature range of instrumented indentation in vacuum by demonstrating that stable experiments can be carried out in vacuum and at temperatures up to 700 °C. Previous experiments at high temperatures in air or argon have shown that thermal drift can be minimized if thermal stability at the contact between tip and sample surface is reached by heating both sides, both in nanoindentation with a pyramidal indenterReference Everitt, Davies and Smith4 and in microcompression.Reference Korte and Clegg11, Reference Korte, Barnard, Stearn and Clegg17 The focus here is therefore to overcome the problems previously encountered in instrumented indentation in vacuum at elevated temperatures, mainly increased thermal drift and electronic noise,Reference Trenkle, Packard and Schuh5 and demonstrate the feasibility of instrumented indentation or microcompression experiments in vacuum by means of experiments showing that thermal drift can be minimized and sufficient stability in the measurements achieved.
For this, initial experiments have been carried out on gold because of its high thermal conductivity, on which previous experiments have shown exaggerated drift.Reference Everitt, Davies and Smith4, Reference Trenkle, Packard and Schuh5 The achieved low and constant levels of thermal drift are demonstrated using cyclic nanoindentation experiments with a flat punch on gold at up to 665 °C. In this context, indentation experiments with a flat punch were used because the much more rapid increase in cross section at the beginning of the experiment, compared with the steady increase in pyramidal indentation, might be considered a “worst case scenario” in terms of varying drift rates during an experiment caused by heat flow at the contact.Reference Trenkle, Packard and Schuh5
Unfortunately, microcompression of gold was not possible at these temperatures as small surface features, such as micropillars with 2-μm diameter made by focused ion beam milling, were found to transform to shallow and rounded features upon heating, presumably due to the action of surface forces driving diffusion at sufficiently high temperatures. This suggests that there might be a limit in maximum test temperature of micropillars of a given material well below the melting point, where the high surface to volume ratio of the pillar geometry cannot be maintained.
For high temperature microcompression experiments, a single crystal nickel superalloy (CMSX-4) was therefore chosen as a higher melting, standard material for use at high temperatures for which data, from both macroscopic uniaxial testsReference Reed22 and high temperature nanoindentation,Reference Sawant and Tin10 are available in the literature.
II. INSTRUMENTATION AND EXPERIMENTS
A. Instrumentation
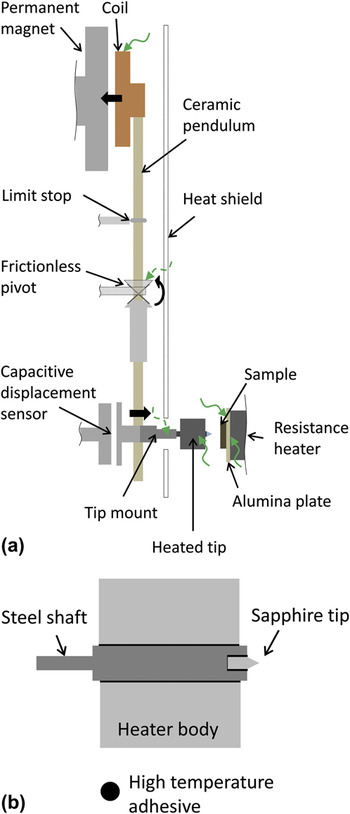
An existing nanoindenter (NanoTest; Micro Materials Ltd., Wrexham, UK), shown schematically in Fig. 1, was modified to operate in vacuum. This was achieved by placing the entire hardware into a vacuum chamber (Trinos Vakuum-Systeme GmbH, Göttingen, Germany), extending the electrical connections to the external controllers, using vacuum compatible motors to drive the sample stage and adapting the existing heaters for the sample and indenter to operate in vacuum using NiCr or FeCrAl wire. A pressure of less than 1 Pa was achieved using a roughing and turbo pump to evacuate the chamber. High working distance lenses were further installed for the ×20 and ×40 objectives to avoid damage to the lenses or excessive cooling of the sample in front of the microscope.
Schematic of NanoTest with heaters and position of thermocouples (green, curly arrows). Thermocouples only used during preliminary tests are marked by dashed lines. The custom-built sapphire indenter shown is assembled using ceramic high temperature adhesive, avoiding lower melting brazes as a potential source of additional compliance at high temperatures.

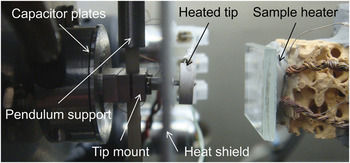
To enable experiments at high temperatures, an indenter tip was designed and custom-made for this purpose (with Synton-MDP Inc., Nidau, Switzerland) from a sapphire rod with a 10-μm-diameter flat surface at the end of a cone (opening angle of 60°) and mounted in a steel shaft. In conventional tip designs, the indenter tip is brazed to the shaft and softening of the braze alloy at 700 °C can lead to additional compliance or release of the tip from the shaft. To overcome this, a ceramic high temperature adhesive with high thermal conductivity (Ceramabond 865; Aremco Products, Inc., Valley Cottage, NY) was used. The indenter body was equipped with a resistive heater as shown schematically in Fig. 1 and also in Fig. 2.
Side view of the equipment near the indenter tip and sample showing the position of the heaters and machine components exposed to the highest temperatures.

During initial experiments additional thermocouples were installed with the objective of exploring the temperature capability of the setup. The positions of these thermocouples are shown in Fig. 1. Due to the high temperatures expected near the indenter tip heater, a titanium tip mount (see Fig. 2) was substituted for the original aluminum one.
B. Materials and methods
Initial indentation experiments were conducted on gold (99.99% Au, cold-rolled, annealed at 750 °C for 4 h) using indentation with the sapphire flat punch (described in section “Instrumentation”) to a small depth with and without thermalization hold segments and indentation to a series of loads at either constant loading rate (0.025 mN·s−1) or loading time (5 s). These gave similar results and, because gold is so soft at 665 °C, thermal hold segments before testing were therefore omitted in the final experiments to avoid unrecorded deformation during this period.
Microcompression was carried out on superalloy micropillars. For this a solution heat treated and aged CMSX-4 single crystal was mechanically polished and micropillars prepared using focused ion beam milling from above (Helios NanoLab; FEI Company, Eindhoven, Netherlands). The pillar dimensions were measured before deformation. The top diameter was chosen for calculation of the yield and flow stresses to account for plasticity spreading downwards along the pillar from the top. For the calculation of the Young modulus, the diameter in the middle of the pillar was used to account for elastic straining of the entire volume and the displacement signal was corrected for sink-in of the pillar both into the compression punch and bulk material as suggested by Zhang et al.Reference Zhang, Schuster, Wei and Ramesh23 but neglecting the fillet radius at the pillar base. Experiments were conducted at a constant loading rate of 0.5 mN·s−1. Between compressions the sample was moved to the microscope and temperature of indenter tip and sample dropped by up to 30 °C during this period due to the absence of radiative heating from the tip heater and reflection off the heat shield. To quickly re-establish thermal stability, a thermal hold segment of 300 s was introduced before each compression, but no additional time was allowed for stabilization other than during the approach of the sample surface by the indenter, giving a time of approximately 15 min between viewing and measurement.
Both samples were fixed to the sample heater using high temperature cement (Ceramabond 865; Aremco Products, Inc) and imaged by scanning electron microscopy before and after testing to assess deformation and surface morphology (Helios NanoLab). All test temperatures quoted refer to that of a thermocouple attached next to the heated sample using the same adhesive.
C. Tuning of the contact
Thermal stability of the instrument is achieved by thermalization over the course of a few hours. In addition, stability at the contact between sample and indenter tip is crucial to minimize any contribution of thermal expansion or contraction to the displacement measured. To minimize heat flow and subsequent dimensional changes upon contact, the heater temperatures are adjusted to give the same surface temperature at the tip and sample. This is necessary to account for the offset in temperature of the contact surfaces relative to that measured by the thermocouples at the heaters controlling the power output. In addition to greater stability at the contact, heating of both sample and indenter tip also enhances the accuracy with which the sample temperature can be estimated as local cooling of the material in contact with a colder tip is prevented.
To tune the two heaters, the sample heater was first adjusted such that it reached the maximum temperature of 700 °C or the desired temperature was reached at the sample. This was then maintained while the temperature of the indenter tip heater was changed until drift during an indentation was minimized. The power of each heater was then held constant to avoid oscillations in the displacement signal due to PID (proportional-integral-derivative) control. In applying a drift correction from drift hold segments an initial settling period of approximately 30 s is normally discarded to allow for stabilization of the instrument and plastic zone. The drift is then calculated based on a linear fit to the second part of the drift hold. However, to allow a direct assessment of the thermal stability of each experiment presented here, no data has been corrected for drift. More information on the tuning procedure, interpretation of drift segments, and extension of the thermal hold beyond 1 min can be found elsewhere.Reference Everitt, Davies and Smith4, Reference Korte and Clegg11, Reference Giuliani24
III. MEASUREMENTS AND RESULTS
A. Local equipment temperatures in air and vacuum
The nanoindenter used here was certified by the manufacturer to operate at temperatures up to 500 °C in air. An extension to 750 °C in air can be achieved by using a water-cooled heat shield. However, as operation in vacuum over the whole temperature range was intended, the water-cooled shield was not used in the vacuum chamber to avoid difficulties associated with leaks. The temperature range was therefore extended by allowing the body of the equipment to act as a heat sink which required the mechanical integrity of the components, particularly those close to the heaters, to be sufficient.
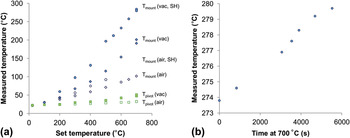
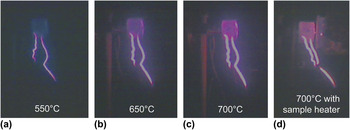
To assess heating of the equipment in vacuum and the extended measurement range above 500 °C, the machine was equipped with thermocouples in the indenter tip mount (substituting the screw fixing the tip during normal operation) and on the instrument side of the pivot. The highest temperatures were observed at the tip mount, see Fig. 3. In air, a temperature of just under 100 °C was reached for an indenter heater temperature of 700 °C. However, in vacuum the temperature rose to 200 °C, and use of the sample heater raised it further to nearly 300 °C. This temperature was reached at the end of a 1.5 h hold at 700 °C after heating over 4 h and appeared to level off after this time [Fig. 3(b)]. As expected the pivot, being further away from the heaters, was much cooler. A visual record is given in Fig. 4, showing the emission of light at the higher temperatures and giving a qualitative indication of the similarity of the indenter tip and sample temperatures achieved.
(a) Temperatures measured at the tip mount and pivot in vacuum (vac) and air and with or without sample heater (SH) installed and (b) the tip mount temperatures measured during a subsequent hold of 100 min at 700 °C.

Light emitted from the heaters in vacuum at different temperatures. Similar emission levels observed at the indenter tip and contact surface indicate proximity to thermal equilibrium where both tip and sample heaters are used (d).

B. Stabilization of the displacement measurement at 700 °C
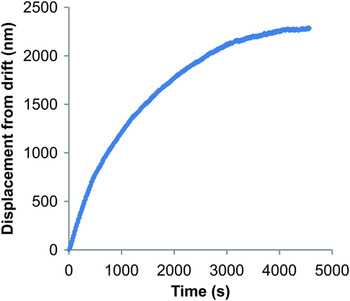
As thermal drift affects the measurement of displacements during testing, the displacement signal was tracked to assess the stability of the system. This was done after slow heating of the tip and sample to 700 °C over a period of approximately 4 h, after which the change in output signal of the capacitive displacement sensor was recorded every 5 s. Figure 5 illustrates the development of drift with time. The displacement signal was found to stabilize after 1.5 h, with the drift rate converging toward zero drift and a final average drift rate of 0.05 nm·s−1 measured over the last 5 min at a heater temperature of 700 °C, indicating a stable temperature distribution within the system. This is consistent with the temperature at the tip mount just in front of the capacitor plates also approaching a stable value at this time [Fig. 3(b)].
Thermal stability measurements at heater temperatures of 700 °C (after heating over 4 h) showing stabilization of the system within approximately 1.5 h and a final drift rate of 0.05 nm·s−1 over the last 5 min.

C. Heating of the load coil
The load applied during an experiment is generated by passing a current through the copper coil at the top of the pendulum, resulting in an attractive force between the coil and the permanent magnet and consequently movement of the indenter tip toward the sample on the other side of the pivot as shown in Fig. 1. The resulting load during an experiment is determined as a function of the voltage applied at the coil, V. Assuming Ohm’s law, the current in the coil, I, is then given by I = V / R Cu, where R Cu is the electrical resistance of copper. Heating of the copper coil may therefore give rise to a change in the load exerted by the indenter as a function of the voltage applied. For experiments in air, the machine is calibrated using a range of weights attached to the pendulum. This type of calibration is not possible during operation in vacuum due to the weight changes required. Instead, the change in the calibration of the load signal due to heating of the coil can be estimated by measuring the coil temperature and assuming that the force, F, between the coil and permanent magnet is related to the resistance of the copper coil by F ∝ 1/R, neglecting the small difference in the magnetic permeability of air (μ air = 1.00000037)Reference Cullity and Graham25 and vacuum (μ vac =1).
During experiments maximum temperatures of T coil(300°C) = 24°C and T coil(600°C) = 35°C were measured. Taking the resistance of copper to vary with temperature according to R Cu(T) = R 0,Cu(T 0)(1 + αΔT) with R 0,Cu(T 20) = 1.72 × 10⁻⁸ Ω at 20 °C and α = 0.0039 K−1 (Lide, 2006), the corresponding change in resistance of the copper coil relative to the calibration temperature of 22 °C is 1 and 5%, respectively. This has been applied to the load signal as a correction in the high temperature tests.
IV. DEMONSTRATION OF THERMAL STABILITY ON GOLD
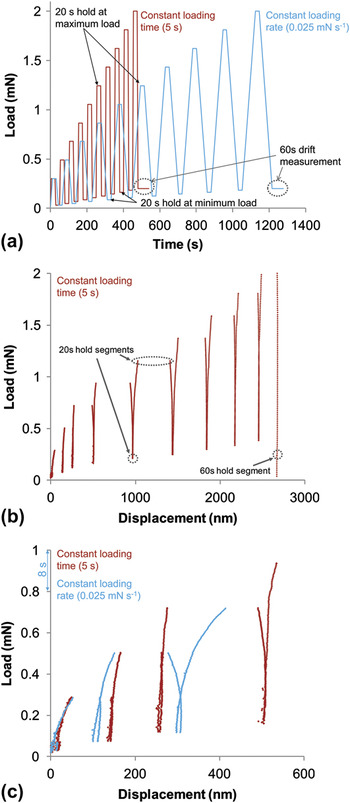
Gold (k Au ≈ 310 W·m−1·K−1)Reference Weast and Astle13 was used as an example of a good thermal conductor to investigate the thermal stability in vacuum. Experiments much longer than normally used in conventional nanoindentation hardness testing were chosen to investigate thermal stability as a function of time and load and to ensure availability of a similar range of strain rates as used in room temperature testing, which cannot be accessed in the short loading times used previously in vacuum.Reference Trenkle, Packard and Schuh5 Cyclic loading to increasing loads with 20 s hold segments at the minimum and maximum loads [see Fig. 6(a)] was chosen to distinguish the effect of time-dependent flow at the highest loads and thermal drift after each unloading step, assuming that at the minimum loads after each loading segment the contact is well established but no or only little creep occurs. To provide an experimental procedure suitable for most types of material and to reduce the experiment duration, the indenter was not held in contact with the sample prior to indentation. This both avoids unrecorded deformation during the hold segment and minimizes reaction of the sample and tip material.
Measurements on gold at 665 °C. The load versus time for these cyclic experiments with different loading times or rates is given in (a). The stability achieved at different loads on unloading and creep at the maximum loads is shown in (b). As expected, where loading was performed at a low rate (0.025 mN/s), creep during loading and unloading is more pronounced (c). All data are “as measured” without any correction for thermal drift.

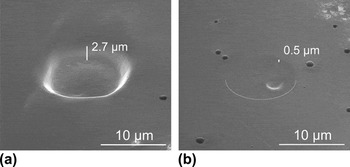
The load–displacement curves presented in Fig. 6 show measured displacements of the order of only a few nanometers during the 20 s hold segments at minimum load, with a maximum of 11 nm recorded. This is consistent with the drift rates measured before and after the experiment of −0.25 and 0.26 nm·s−1, respectively. As expected, creep was more pronounced in the long loading or unloading segments (at a rate of 0.025 mN·s−1) than in short loading and unloading segments of 5 s duration [Fig. 6(c)]. The decreasing creep displacements and increasing stiffness toward higher loads are caused by pile up of material around the indenter and the increasing cross-sectional area as the flat punch is pressed further into the material and the cone-shaped body comes into contact with the material. To further verify that the displacements at high loads occur as a result of creep rather than thermal drift, the final measured depths were compared with the residual indentation depth as seen in the scanning electron microscope. Accurate determination of the depth by scanning electron microscopy is difficult; however, the depths measured during indentation are indicated on micrographs of the indentations and can be compared optically, yielding good agreement both at low and high loads (Fig. 7).
Comparison of measured indentation depths with electron micrographs (specimen tilt 52°). (a) Indent corresponding to the load–displacement curve shown in Figure 6(b). Final recorded depth is 2670 nm. (b) Indent after a 600 s hold at 0.05 mN. Final recorded depth is 499 nm. The lower half of the residual indent is indicated for clarity. Both indents were placed at 665 °C.

This thermal stability achieved in vacuum on gold represents a significant improvement over previous experiments in vacuum. For comparison, in an indentation such as that shown in Fig. 6(b) the drift rates reported by Trenkle et al.Reference Trenkle, Packard and Schuh5 of 37 nm·s−1 on copper at 300 °C in vacuum would amount to a maximum error of up to 18 μm (or over 650%), assuming that the drift does not vary during the duration of the experiment (10 cycles of 50 s) and continues at all loads.
Due to the use of a flat punch and omission of hold segments before the beginning of each indentation in the experiments presented here, the contact area rises very quickly at the beginning of the experiment, rather than continuously as in pyramidal indentation, and this therefore represents a worst case situation. Sapphire was chosen as the indenter material due to its greater chemical stability at high temperatures compared with diamond. Although diamond is a better thermal conductor than sapphire, the high level of thermal stability demonstrated here is not expected to be compromised by the choice of an indenter tip material with higher thermal conductivity due to the equilibrium achieved at the contact, as demonstrated in argon for indentation with a pyramidal diamond tip.Reference Everitt, Davies and Smith4
The current setup is therefore expected to give load and displacement signals sufficiently stable for most commonly used types of nanoindentation experiments to be carried out in vacuum and at temperatures up to 700 °C for the range of strain rates conventionally used.Reference Oliver and Pharr26
V. MICROCOMPRESSION OF CMSX-4 MICROPILLARS
CMSX-4 micropillars were compressed at sample temperatures of up to 630 °C in vacuum with the sample heater temperature as high as 700 °C. This lower sample temperature, compared with the gold sample of similar thickness at the same sample heater temperature, is due to the lower thermal conductivity of CMSX-4 (k CMSX-4 ≈ 15 W·m−1·K−1). In the site-specific microcompression experiments stability at the contact is more difficult to achieve as the thermal equilibrium is disrupted before each compression when the sample is moved away from the tip heater to view the specimen under the microscope. Thermal hold segments with the indenter tip in contact at 0.1 mN for 300 s were therefore introduced, but no further time for thermalization outside the surface approach and standard calibration procedures was allowed to perform experiments at practical time scales of approximately 25 min per compression. During positioning in front of the microscope (an offset from the indenter tip of approximately 6 mm in indentation direction and a quarter of a meter sideways), the temperature of the heaters operated at constant power fell by up to 30 °C at set temperatures of the order of 700 °C. This is in contrast to a much smaller drop in temperature seen at set temperatures around 350 °C, indicating the much stronger radiative heating component expected with increasing temperature.
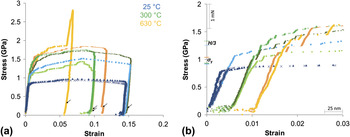
The stress–strain curves recorded show a stable loading stiffness and little drift in the hold segments of 30 s at 10% maximum load included at the end of each experiment (shown arrowed in Fig. 8). As before, no correction for the measured drift was applied to these curves to give a better indication of the stability.
(a) Stress–strain curves recorded on CMSX-4 micropillars in vacuum at 22 °C (blue), 300 °C (green), and 630 °C (orange), (b) shows low-strain segments of the curves shown in (a) with the curves recorded at 300 and 630 °C offset for clarity. The additional peak observed in the curve in (a) is due to contact with residual material in the trench surrounding the pillar. The increasing yield stress with temperature is consistent with macroscopic testsReference Reed22 and the flow stress at several percent strain with hardness measurements at up to 400 °CReference Sawant and Tin10 as indicated on the ordinate in (b) using the same color scheme. None of the curve has been corrected for thermal drift and the position of the drift hold segments at 10% maximum load are indicated by arrows in (a).

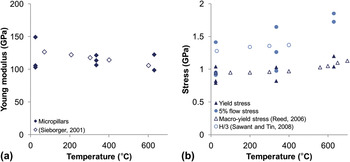
The Young modulus was measured as a fit to the linear loading part of the curves measured at each temperature (Fig. 9). Comparison with macroscopic data given in the same figure yields good agreement. In terms of plastic deformation of the micropillars, previous microcompression experimentsReference Uchic, Dimiduk, Florando and Nix28 on a superalloy with γ − γ′ structure have shown little effect of size, presumably due to the length scale of the γ − γ′ structure (visible in Fig. 10) below the pillar diameter governing deformation. Comparison of the yield and flow stresses with macroscopic experimentsReference Reed22 therefore also gives good agreement within the scatter observed at small sizes and reveals the slight increase with temperature in the investigated temperature range also seen in macroscopic deformation (Figs. 8 and 9). In Fig. 8, the macroscopic yield stresses, σY, from the literatureReference Reed22 and at similar temperatures as the microcompression data, are indicated on the ordinate for comparison with the microcompression stress–strain curves. A comparison of the flow stress can be made with the nanoindentation hardness of CMSX-4 at elevated temperatures up to 400 °C measured by Sawant and Tin,Reference Sawant and Tin10 considering the hardness, H, to be related to the flow stress at several percent strain (σF ≈ H / 3), rather than the onset of yielding.Reference Tabor29 The microcompression flow stress at 5% strain is indeed consistent with these measurements as shown in the direct comparison in Fig. 8 (H / 3 indicated on the ordinate) and Fig. 9.
Comparison of mechanical data from micropillar and macroscopic experimentsReference Sawant and Tin10, Reference Reed22, Reference Siebörger, Knake and Glatzel27 showing (a) Young moduli and (b) the yield and 5% flow stresses.

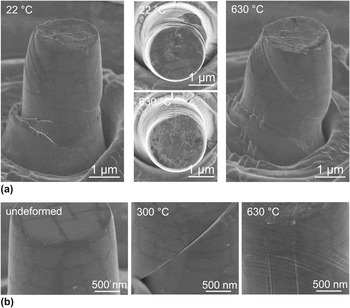
Micropillars tested between 22 and 630 °C in vacuum showing temperature-dependent changes in the deformation structures and little alteration in surface quality after exposure to elevated temperatures of up to 630 °C for 48 h. (a) At the higher temperature, deformation takes place on several intersecting slip systems, visible in particular in the top view. Some reaction between compression punch and the top surface, particularly at the higher temperature, and local deformation due to roughness of the compression punch is evident from the same micrographs. (b) Higher magnification micrographs of two deformed and one undeformed pillar showing little oxidation or contamination of the pillar surface not in contact with the compression punch and increasing activation of slip on intersecting glide planes toward higher temperatures.

Micrographs of the deformed micropillars (Fig. 10) illustrate that testing in vacuum is effective in preventing oxidation. No oxidation layer is visible by scanning electron microscopy on the surface not in contact with the compression punch for 48 h. Although some small spherical particles of unknown composition were observed on the surface [Fig. 10(b)], the γ − γ′ microstructure of the superalloy is still clearly visible, in contrast to oxidation experiments in air, for which formation of a coarse and several microns thick oxide layer was reported after 100 h at 800 °C.Reference Hook30 The pillars compressed at the highest temperature exhibit formation of a larger number of slip bands accommodating smaller strains compared with those compressed at room temperature and 300 °C, which are more widely spaced and show greater displacements on individual slip bands. Glide on intersecting planes also becomes more prominent at 630 °C as visible in particular in the micrograph from above in Fig. 10.
Microcompression in vacuum at elevated temperatures is therefore well suited for the study of deformation mechanisms in materials with microstructural dimensions below the pillar size, offering the possibility of introducing large strains even in macroscopically brittle materialsReference Korte and Clegg11, Reference Korte and Clegg14, Reference Moser, Wasmer, Barbieri and Michler18, Reference Östlund, Ghisleni, Howie, Korte, Leifer, Clegg and Michler19 and subsequent analysis of the entire sample volume by electron microscopy.
VI. CONCLUSIONS
Microcompression and nanoindentation experiments have been carried out at sample temperatures up to 665 °C in vacuum by modifying an existing nanoindenter. Control of indenter tip and sample heaters allows the omission of temperature thermalization holds with the indenter tip in contact with the sample prior to testing, reducing the risk of wear or reaction with the sample material at the indenter tip. Once the tip and sample are adjusted to the same temperature, thermal stability can also be re-established quickly in microcompression experiments after changes in sample and indenter tip temperature during the location of the test site under the microscope. This allows a reduction in experiment duration and prevents unrecorded deformation in materials which are very soft or being tested near their melting points.
Thermal drift rates on gold at 665 °C were sufficiently low to allow slow indentations over several minutes. However, microcompression of gold was not possible as the pillar shape was not retained at the high temperatures (up 0.7 T m). Using micropillars of a higher melting nickel superalloy with γ − γ′ microstructure, elastic and plastic properties consistent with macroscopic experiments could be extracted at up to 630 °C and a very low level of oxidation over a total heated period of 48 h.
ACKNOWLEDGMENTS
The authors thank H. Mathur (University of Cambridge), for supplying the CMSX-4 sample, Dr. S. Goodes (Micro Materials Ltd., United Kingdom), for the provision of custom changes to the equipment software and his continuous support, and Dipl.-Ing. S. Hostettler (Synton-MDP, AG, Switzerland), for his help with the indenter tip design. This research was funded by the Engineering and Physical Sciences Research Council and Rolls-Royce plc Strategic Partnership “Structural Metallic Systems For Advanced Gas Turbine Applications” (EP/H500375/1).