I. INTRODUCTION
Besides the effect of machining, generally, there are two main reasons why the fatigue process occurs most readily at the surface. One is that in most loading situations, the stresses or strains generated in a component or structure due to external loads are larger at the surface. The other is that the service environment can degrade the performance of structural materials by contact of the surface. Therefore, considering the preferential initiation of fatigue crack at the surface, the surface-hardening has been a commonly used way to improve fatigue performance of structural materials. Reference Chen, Huang, Liu, Li, Ni and Lu1,Reference Peng, Zhang, Dong and Du2 However, with the development of very high cycle fatigue (VHCF) associated with fatigue properties of structural materials in the life regime beyond 107 cycles, Reference Bathias3 researchers show that the surface-hardening sometimes can do little to improve fatigue strength or life of structural material in the VHCF regime and even in high cycle fatigue (HCF) regime. Reference Shiozawa, Murai, Shimatani and Yoshimoto4,Reference Li, Sun, Zhang, Deng and Sakai5 A key reason is that the crack initiation site can change from the surface to the subsurface or interior. Moreover, just because of the transition of crack initiation site or mode, some surface-hardened or high-strength materials exhibit the peculiar S–N characteristics Reference Nishijima and Kanazawa6,Reference Sakai, Sato and Oguma7 and the complex crack initiation and growth behaviors Reference Murakami, Yokoyama and Nagata8,Reference Shiozawa, Morii, Nishino and Lu9 that are not yet well understood. In view of the fact that a large number of surface-hardened components or structures have to withstand ultralong load cycles beyond 107 in actual service, it is crucial to clarify the fundamental fatigue properties of surface-hardened materials in the VHCF regime.
Compared with common surface cracks, the interior cracks for the case-hardened or high-strength steels are mainly induced from metallurgical defects or discontinuities, such as inclusions, Reference Sakai, Takeda, Shiozawa, Ochi, Nakajima and Nakamura10–Reference Murakami, Nomoto and Ueda12 secondary particles, Reference Sohar, Betzwar-Kotas, Gierl, Weiss and Danninger13 and microstructural inhomogeneities. Reference Yu, Gu, Bai, Liu and Li14,Reference Nie, Fu, Hui, Dong and Weng15 Generally, these defects are very small, ranging in size from a few μm to several tens of μm. Also, a fisheye-like propagating crack is often observed on the fracture surface. Within the fisheye, a fine granular area (FGA) Reference Sakai, Takeda, Shiozawa, Ochi, Nakajima and Nakamura10 sometimes can occur in the vicinity of the defect Reference Sakai, Takeda, Shiozawa, Ochi, Nakajima and Nakamura10–Reference Murakami, Nomoto and Ueda12,Reference Yu, Gu, Bai, Liu and Li14 but sometimes cannot be observable even if the fatigue life exceeds 107 cycles. Reference Nie, Fu, Hui, Dong and Weng15 Some models or ideas, such as “polygonization and microdebonding”, Reference Sakai, Takeda, Shiozawa, Ochi, Nakajima and Nakamura10 “depressive decohesion of spherical carbide”, Reference Shiozawa, Lu and Ishihara11 “hydrogen embrittlement-assisted cracking”, Reference Murakami, Nomoto and Ueda12 “cyclic compression between crack faces”, Reference Nakamura, Oguma and Shinohara16 and “grain refinement and local stress decreasing” Reference Grad, Reuscher and Brodvanski17 have been tried to explain the formation mechanism of FGA. Although the uniform understanding or conclusion has not yet been drawn, there is a consensus that the crack initiation and growth behaviors within the fisheye, especially within the FGA, almost govern the VHCF property of steel.
With the application of fracture mechanics to small crack or defect, the relationship between fatigue strength and small defect or crack can be established. Murakami first developed an empirical equation to predict fatigue strength in combination with Vickers hardness of material and
 $\sqrt {{\rm{area}}}$
parameter of crack or defect.
Reference Murakami and Endo18
Thereafter, based on the size of inclusion or FGA, some other models or methods associated with Paris law,
Reference Tanaka and Akiniwa19
Basquin equation,
Reference Liu, Li, Li and Yang20,Reference Mayer, Haydn, Schuller, Issler, Furtner and Bacher-Hochst21
cumulative fatigue damage,
Reference Sun, Xie, Zhao, Lei and Hong22
tensile strength,
Reference Chapetti23
and plastic zone size
Reference Zhao, Xie, Sun, Lei and Hong24
were developed to predict the fatigue strength or fatigue life in the VHCF regime. Although each model is difficult to evaluate or predict all the experimental results for any steel, they all reveal the importance of the crack initiation and growth behaviors within the fisheye in the VHCF process.
In the present study, the fatigue test of a carburized gear steel under axial loading was performed to investigate the effect of carburizing on crack initiation and growth behaviors, under the HCF and the VHCF. Based on the discussion of S–N characteristics, the observation of fracture morphologies, the evaluation of defect/crack sizes, and the calculation of stress intensity factor (SIF) at the crack tip, the crack initiation and growth behaviors in the HCF regime and in the VHCF regime were characterized. Combined with the definition of crack sizes at different transition stages and the microstructure-scale parameters, the life models associated with the crack initiation and growth were developed to predict the total fatigue life in the HCF regime and in the VHCF regime.
II. EXPERIMENTAL PROCEDURES
A. Material and specimen
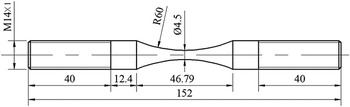
The material used in this study is a high-strength gear steel, and its chemical composition (mass percentage) is: 0.2 C, 0.2 Si, 0.9 Mn, 1.1 Cr, 0.015 P, 0.015 S, 0.011 Ni, and 0.011 Cu. From the annealed steel bar with a diameter of 18 mm, specimens were first machined into the shape of hourglass with a certain amount of finishing margin and then grinded in a direction parallel to the axis of specimen by the grades 600–2000 abrasive paper to final shape, as shown in Fig. 1. The expected value of average roughness is not more than 0.32. The minimum diameter of specimen is 4.5 mm. Furthermore, based on Person's handbook, Reference Pilkey and Pilkey25 the stress concentration factor of specimen is evaluated to be 1.02.
Shape and dimensions of specimen (units: mm).

B. Carburizing and microstructure
Specimens were placed into a container filled up with carburization powder that is composed of charcoal, calcium carbonate, and barium carbonate with 12:1:5. The container was sealed by fire clay and heated by a vacuum furnace. The furnace temperature first rises up to 800–850 °C and then is held for 2 or 4 h soaking time, finally reaches the carburizing temperature of about 930 °C. Based on the empirical speed of pack carburizing, about 0.1–0.15 mm/h, the carburizing time is about 6 h and the expected depth of carburized layer is about 0.6–0.8 mm. Upon completion of the process, the direct quenching and low tempering were performed. The furnace temperature is stepped down to 860 °C for 30 min prior to quenching in oil, followed by tempering at 200 °C for 2 h.
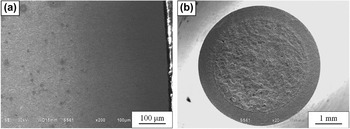
After heat treatment, the cross-sectional microstructures of specimen were observed by using the scanning electron microscopy (SEM) after grinding and polishing, then etching with 4% alcohol nitric acid solution, as shown in Fig. 2(a). In carburized layer, the acicular martensites with high carbon and partial residual austenites are observed, whereas the lath martensites with low carbon can be observed in matrix region. The grain size of material is measured to be about 10 μm. Furthermore, based on the observation of fracture surface after monotonic tension test, the depth of carburized layer is evaluated to be about 600 μm, as shown in Fig. 2(b).
Observation of microstructure and carburized layer: (a) Carburized layer and matrix region; (b) depth of carburized layer.

C. Fatigue testing method
An electromagnetic resonant fatigue testing machine at frequency of 100 Hz was used to perform the fatigue test of the carburized gear steel under axial loading. Fatigue test with the stress ratio of −1 was all performed in an open environment and at room temperature. During the experiment, the temperature of specimen was not getting hotter, similar to the room temperature. After the experiment, the fracture surfaces of all failed specimens were carefully observed by the SEM, especially paying attention to the crack initiation and growth mechanisms.
III. RESULTS AND DISCUSSION
A. Microhardness and residual stress
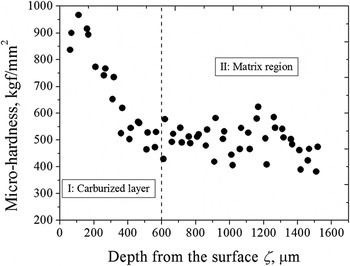
The Vickers microhardness of carburized layer and matrix region was measured by using an instrumented nanoindenter G200 (Agilent Technologies, Santa Clara, CA) with the method of continuous stiffness. The values of microhardness as a function of depth from the surface, ζ, are shown in Fig. 3. It can be seen from the figure that the largest value of microhardness almost occurs near the surface. With the increasing of ζ, the value of microhardness tends to decrease and then reaches an approximately constant value with about 500 kgf/mm2 at about ζ = 600 μm. This further verifies that the depth of carburized layer is about 600 μm, in accordance with the result shown in Fig. 2(b).
Microhardness of carburized layer and matrix region.

In addition, the residual stress on the round-notched surface of specimen was measured along the axis of specimen by using x-ray diffraction. Based on the sin2 ψ method with Cr Kα radiation, the tube voltage of 30 kV and the tube current of 9 mA, the value of residual stress can be determined by averaging the values of 4 measurement points on the surface. The measured maximum compressive residual stress occurs on the surface and is about 150 MPa.
B. S–N characteristics
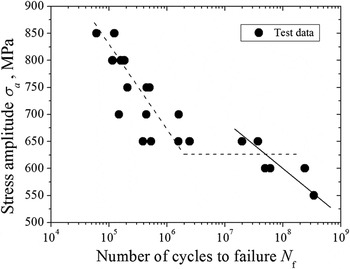
The experimentally obtained S–N diagram of the carburized gear steel under axial loading is shown in Fig. 4. Based on the preliminary SEM observation of crack initiation sites on all fracture surfaces, the interior crack-induced failure is the unique failure mode of the carburized gear steel in the life regime beyond 105 cycles. In consideration of the data scatter, these test data can be divided into two parts. One part corresponds to the relatively short fatigue life (N f < 3 × 10⁶ cycles), i.e., the common HCF regime. The other part corresponds to the relatively long fatigue life (N f > 3 × 10⁷ cycles), i.e., the VHCF regime. The separation and transition between two parts of test data are very distinct. Therefore, the duplex S–N curves are used to represent the S–N characteristics of the carburized gear steel in the life regime beyond 105 cycles under axial loading. For the test data in the HCF regime, the common S–N curve with a horizontal part is plotted and indicated by a dashed line in Fig. 4. For the test data in the VHCF regime, the continuously descending S–N curve is plotted and indicated by a solid line in Fig. 4. The horizontal part of dashed line approximately corresponds to the transition stress from the HCF regime to the VHCF regime. This transition stress is about 625 MPa. Furthermore, based on the fitted S–N curve, the fatigue strength corresponding to fatigue life of 109 cycles is evaluated to be 500 MPa.
Duplex S–N curves of carburized gear steel under axial loading.

In addition, it is worth to note that the duplex S–N characteristics herein presented by the carburized gear steel are different from the common duplex S–N characteristics Reference Nishijima and Kanazawa6,Reference Sakai, Sato and Oguma7 associated with surface crack-induced failure and interior crack-induced failure. Only corresponding to one interior crack-induced failure, the reason why the duplex S–N characteristics still can present may be attributed to the different interior failure mechanisms in the HCF regime and in the VHCF regime. The detailed analysis will be discussed later.
C. Crack initiation and growth mechanisms
Both in the HCF regime and in the VHCF regime, the interior cracks are all induced from nonmetallic inclusions by means of the SEM observation and the energy dispersive x-ray spectrometer analysis. The main chemical composition of the inclusion is the aluminum oxide (Al2O3). It should be noted that these inclusions are all confined to the interior matrix region. This means that the inclusions within the carburized layer hardly become crack nucleus. To a great extent, it is attributed to the effect of carburized layer. Compared with the carburized layer with higher hardness, the matrix is softer. Therefore, the strain inconsistency between the inclusion and the ambient matrix under cyclic loading is more intense, so the crack is more easily initiated from the interface between them.
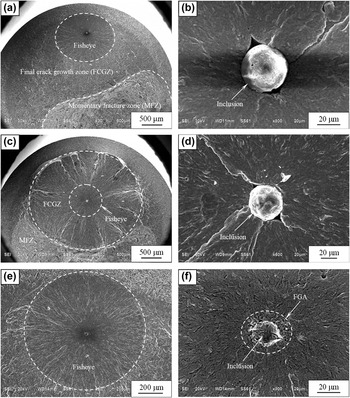
A propagating crack-shaped-like fisheye can be observed on the fracture surface, as shown in Figs. 5(a), 5(c), and 5(e). Approximately, the inclusion is located at the center of fisheye. In Fig. 5(a), the somewhat coarse area at the right bottom of the fracture surface is the remaining cross section that existed at the time of fracture and named as “momentary fracture zone (MFZ)”. The region between the fisheye and the MFZ is named as “final crack growth zone (FCGZ)”. It should be noted that the shapes of fisheye and FCGZ can change with the position change of inclusion on the fracture surface. The reason is that the crack growth toward the carburized layer is inevitably restricted due to the higher strength of carburized layer, and the degree of restriction tends to increase with the increase of crack extension. As a result, the rate of crack growth toward the center matrix region is much faster than that toward the carburized layer. Therefore, when the inclusion is closer to the carburized layer, the shape of fisheye is more or less asymmetric, and the shape of FCGZ becomes irregular, as shown in Fig. 5(a). Conversely, when the inclusion is closer to the center of fracture surface, the shapes of fisheye and FCGZ get more and more circular due to the comparatively consistent crack growth rate, as shown in Fig. 5(c).
Observation of fracture surfaces: (a) fisheye, FCGZ, and MFZ (σa = 700 MPa, N f = 1,605,400); (b) inclusion without FGA (σa = 700 MPa, N f = 1,605,400); (c) circular FCGZ outside fisheye (σa = 750 MPa, N f = 501,600); (d) inclusion without FGA (σa = 750 MPa, N f = 501,600); (e) fisheye (σa = 600 MPa, N f = 242,416,200); (f) FGA around inclusion (σa = 600 MPa, N f = 242,416,200).

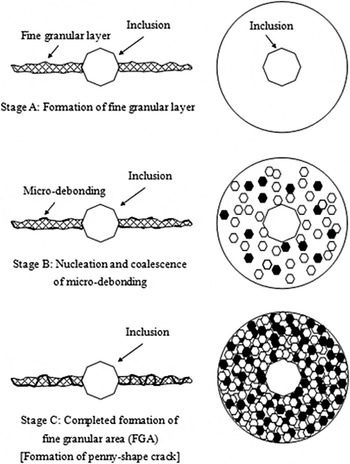
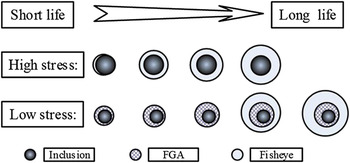
For the interior failure in the HCF regime, the FGA cannot be observed around the inclusion, as shown in Figs. 5(b) and 5(d). Conversely, for the interior failure in the VHCF regime, the FGA can be observable, as shown in Fig. 5(f). From the viewpoints of dislocation movement and irreversible slip, the FGA formation process proposed by coauthor Sakai can be divided into three stages Reference Sakai, Takeda, Shiozawa, Ochi, Nakajima and Nakamura10 : (A) a fine granular layer caused by the intensive polygonization is gradually induced around the subsurface inclusion during a long sequence of the cyclic loading(Formation of fine granular layer), (B) the number of microdebondings is increased gradually and some of them would coalesce to one another (Nucleation and coalescence of microdebondings), and (C) microdebondings are entirely spread over the fine granular layer, and the penny shape crack is finally formed around the subsurface inclusion of the material (completed formation of the FGA). The relevant schematic diagram is shown in Fig. 6, where the longitudinal sections passing through the inclusion are indicated in the left hand side, and the cross sections passing through the same inclusion are indicated in the right hand side. Obviously, the formation of FGA is the largest difference between the failure mechanisms in the VHCF regime and in the HCF regime. Just because of such difference, the duplex S–N characteristics in Fig. 4 are presented.
Schematic diagram of the FGA formation process.

Overall, the fatigue process of the carburized gear steel in the HCF regime can be described as inclusion → fisheye → FCGZ → MFZ, while that in the VHCF regime can be described as inclusion → FGA → fisheye → FCGZ → MFZ.
D. Evaluation of SIF
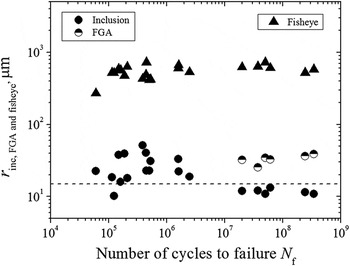
Based on the observation of fracture surfaces, the shapes of inclusion, FGA, and fisheye can be approximately considered to be circular in a two-dimensional plane. The parameters r inc, r FGA, and r fisheye were defined to denote the radii of inclusion, FGA, and fisheye, respectively. Figure 7 shows the relationships between r inc, r FGA, and r fisheye and N f. It can be seen that the values of r inc, r FGA, and r fisheye are all independent of fatigue life. The values of r inc for the existence of FGA are only in the range of the 10.84–13.22 μm, while the values of r inc for the nonexistence of FGA are in the range of 10.13–51.10 μm. The values for the latter are comparatively larger, partially similar to the values of r FGA with about 25.56–36.19 μm. Furthermore, the values of r fisheye are in the range of 269.61–727.59 μm.
Relationships between r inc, r FGA, and r fisheye and N f.

Based on the theory of fracture mechanics, the SIF range, ΔK int, for an interior crack with a radius, a, can be given by Reference Marines-Garcia, Paris, Tada, Bathias and Lados26
 $$\Delta {K_{{\rm{int}}}} = {2 \over \pi }\Delta \sigma \sqrt {\pi a} \quad ,$$
where ∆σ is the applied stress range. Accordingly, for the inclusion, FGA, and fisheye, the relevant SIF ranges, ∆K inc, ∆K FGA, and ∆K fisheye, can be expressed as
 $$\Delta {K_{{\rm{inc}},\,{\rm{or}}\,{\rm{FGA}}\,{\rm{and}}\,{\rm{or}}\,{\rm{fisheye}}}} = {2 \over \pi }\Delta \sigma \sqrt {\pi {r_{{\rm{inc}},\,{\rm{or}}\,{\rm{FGA}}\,{\rm{and}}\,{\rm{or}}\,{\rm{fisheye}}}}} \quad .$$
At the stress ratio of −1, Eq. (2) is rewritten as
 $$\Delta {K_{{\rm{inc}},\,{\rm{or}}\;{\rm{FGA}}\;{\rm{and}}\;{\rm{or}}\;{\rm{fisheye}}}} = 2{K_{\max - {\rm{inc}},\,{\rm{or}}\,{\rm{FGA}}\,{\rm{and}}\,{\rm{or}}\,{\rm{fisheye}}}} = {4 \over \pi }{\sigma _{\rm{a}}}\sqrt {\pi {r_{{\rm{inc}},\,{\rm{or}}\,{\rm{FGA}}\,{\rm{and}}\,{\rm{or}}\,{\rm{fisheye}}}}} \quad , \cr}$$
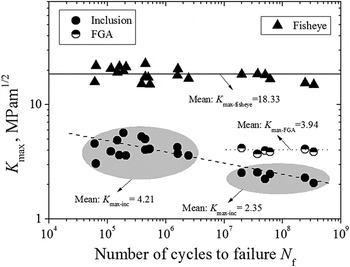
where K max denotes the maximum SIF. In view of the fact that the tension has a predominant effect on the crack growth, Fig. 8 only shows the relationships between K max–inc, K max–FGA, and K max–fisheye and N f. The values of K max–inc are in the range of 2.33–5.90 MPa m1/2 and tend to decrease with the increase of N f, as indicated by a dashed line in Fig. 8. Among them, the values of K max–inc for the existence of FGA are only in the range of 2.33–2.67 MPa m1/2, obviously less than these for the nonexistence of FGA in the range of 3.19–5.90 MPa m1/2. Compared with the threshold value controlling macroscopic crack growth for some high-strength steels, about 4–5 MPa m1/2, Reference Shiozawa, Murai, Shimatani and Yoshimoto4,Reference Li, Sun, Zhang, Deng and Sakai5,Reference Sakai, Sato and Oguma7 the values of K max–inc for the existence of FGA in the VHCF regime are obviously smaller. Under this circumstance, it can be concluded that the microcrack growth should play a certain role in the interior crack growth process under the VHCF.
Relationships between K max–inc, K max–FGA, and K max–fisheye and N f.

The values of K max–FGA approximately keep a constant regardless of N f, as indicated by a dotted line in Fig. 8. The mean value of K max–FGA is about 3.94 MPa m1/2 and is very similar to the mean value of K max–inc for the nonexistence of FGA with about 4.21 MPa m1/2. Combined with other experimental results, Reference Li, Sun, Zhang, Deng and Sakai5,Reference Sakai, Sato and Oguma7,Reference Shiozawa, Morii, Nishino and Lu9 it can be assumed that K max–FGA or K max–inc for the nonexistence of FGA is the threshold value for controlling stable growth of interior macroscopic crack. Furthermore, just like K max–FGA, the values of K max–fisheye also approximately keep a constant regardless of N f, as indicated by a solid line in Fig. 8. The mean value of K max–fisheye is about 18.33 MPa m1/2, similar to the fracture toughness of steel. Therefore, K max–fisheye can be assumed to be the threshold value controlling the unstable growth of interior macroscopic crack.
Based on above-mentioned analysis, therefore, the crack initiation and growth behaviors in the HCF regime can be characterized as (i) crack initiation around the inclusion, (ii) stable macrocrack growth within the fisheye, (iii) unstable macrocrack growth outside the fisheye and within the FCGZ, and (iv) final fracture within the MFZ. On the other hand, the crack initiation and growth behaviors in the VHCF regime can be characterized as (i) crack initiation around the inclusion, (ii) microcrack growth within the FGA, (iii) stable macrocrack growth outside the FGA and within the fisheye, (iv) unstable macrocrack growth outside the fisheye and within the FCGZ, and (v) final fracture within the MFZ. Among them, fatigue lives consumed in the stages of unstable crack growth and final fracture can be negligible. Figure 9 shows the schematic diagram of interior inclusion-induced failure progress within the fisheye.
Schematic diagram of interior inclusion-induced failure progress.

E. Evaluation of crack initiation life
In view of the interior failure mechanism associated with the inclusion-induced crack, the crack initiation life, N i, can be evaluated by using the dislocation dipole accumulation model proposed by Tanaka and Mura, Reference Tanaka and Mura27 and given by
 $${N_{\rm{i}}} = \left[ {{{\left( {\mu + {\mu _{{\rm{inc}}}}} \right)} \over {{\mu _{{\rm{inc}}}}}}} \right]{\left( {{h \over {h + l}}} \right)^2}{{4\mu {W_{\rm{c}}}} \over {{{\left( {\Delta \tau - 2{\tau _{\rm{f}}}} \right)}^2}}}{1 \over {{r_{{\rm{inc}}}}}}\quad ,$$
where μ and μinc are the shear moduli of homogeneous matrix and inclusion, respectively, W c is the specific fracture energy for a unit interfacial area, l and h are the semimajor length and semiminor length of elliptic slip band zone, respectively, Δτ is the resolved shear stress range, and τf is the critically resolved shear stress for plastic deformation. For this model, it is based on the assumption that all the dislocations in the slip band zone contribute to the crack formation. However, the study shows that generally not all dislocations contribute to the crack formation, at least not immediately at crack initiation. Reference Venkataraman, Chung and Mura28 The number of dislocations that contribute to the crack formation is closely related to the crack length, c. Under this circumstance, the value of W c can be expressed as Reference Chan29
 $${W_{\rm{c}}} = {{\mu c} \over {0.005}}{\left( {{h \over {2l}}} \right)^2}\quad .$$
By substituting Eq. (5) into Eq. (4), we have
 $${N_{\rm{i}}} = \left[ {{{{\mu ^2}\left( {\mu + {\mu _{{\rm{inc}}}}} \right)} \over {0.005{\mu _{{\rm{inc}}}}}}} \right]{\left( {{{{h^2}} \over {hl + {l^2}}}} \right)^2}{1 \over {{{\left( {\Delta \tau - 2{\tau _{\rm{f}}}} \right)}^2}}}\left( {{c \over {{r_{{\rm{inc}}}}}}} \right)\quad .$$
Furthermore, the applied stress range can be related to the shear stress range by using the Taylor factor M, leading to
 $${\left( {{N_i}} \right)^{{1 \over 2}}} = {\left[ {{{\left( {\mu + {\mu _{{\rm{inc}}}}} \right)} \over {0.005{\mu _{{\rm{inc}}}}}}} \right]^{{1 \over 2}}}\left( {{{{h^2}} \over {hl + {l^2}}}} \right){{M\mu } \over {\left( {\Delta \sigma - 2{\sigma _{\rm{w}}}} \right)}}{\left( {{c \over {{r_{{\rm{inc}}}}}}} \right)^{{1 \over 2}}}\quad ,$$
where σw is the critical stress below which the crack cannot initiate. In the HCF regime, it corresponds to the transition stress from the HCF regime to the VHCF regime. Whereas in the VHCF regime, it corresponds to the fatigue strength at life of 109 cycles. Furthermore, the exponent of N i can be generalized to a variable α (0 < α < 1), which is based on the better agreement with the experimental data. Reference Chan29 Also, studies show that the value of α is not a constant but depends on the stacking fault energy and on the degree of slip irreversibility. Reference Venkataraman, Chung and Mura28,Reference Cheng and Laird30 Under this circumstance, Eq. (7) can be rewritten as
 $${\left( {{N_{\rm{i}}}} \right)^\alpha } = {\left[ {{{\left( {\mu + {\mu _{{\rm{inc}}}}} \right)} \over {0.005{\mu _{{\rm{inc}}}}}}} \right]^{{1 \over 2}}}\left( {{{{h^2}} \over {hl + {l^2}}}} \right){{M\mu } \over {\left( {\Delta \sigma - 2{\sigma _{\rm{w}}}} \right)}}{\left( {{c \over {{r_{{\rm{inc}}}}}}} \right)^{{1 \over 2}}}\quad ,$$
when α = 1/2, Eq. (8) has the same power law relation as Eq. (7). Furthermore, the shear modulus is related to the Young's modulus and given by
 $$\mu = {E \over {\left( {2 + 2\nu } \right)}}\quad ,$$
and
 $${\mu _{{\rm{inc}}}} = {{{E_{{\rm{inc}}}}} \over {\left( {2 + 2{\nu _{{\rm{inc}}}}} \right)}}\quad ,$$
where E and ν denote the Young's modulus and Poisson's ratio of the homogeneous matrix, respectively, and E inc and νinc denote the Young's modulus and Poisson's ratio of the inclusion, respectively. For the matrix of steel, the values of E and ν are 204,000 MPa and 0.3, respectively. For the inclusion of Al2O3, the values of E inc and νinc are about 400,000 MPa and 0.25, respectively. Reference García, Mantič and Graciani31 For the interior failure without the FGA formation, the value of l in Eq. (8) is generally defined as the half of grain size. Reference Tanaka and Mura27,Reference Chan29 However, for the interior failure with the FGA formation, herein it is assumed that the elliptic slip band zone spreads over the whole FGA. That is, the value of l is approximately equal to the radius of FGA. In view of the fact that the value of h is generally not available, for these two failure modes, h is all regarded as a fitting parameter just like α. Therefore, based on the S–N data and the sizes of FGA and inclusion, the corresponding values of α and h can be determined, and the crack initiation lives at different values of c can be obtained.
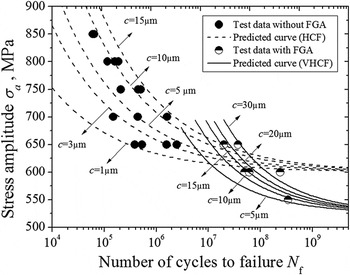
Corresponding to different values of c, the crack initiation life curves evaluated in the HCF regime and in the VHCF regime are indicated by dashed and solid lines in Fig. 10, respectively. Both in the HCF regime and in the VHCF regime, the crack initiation lives at a given stress amplitude all tend to increase with the increase of crack length. At a given crack length, the needed crack initiation lives are shorter at higher stress amplitude, whereas at lower stress amplitude those can occupy the vast majority of the total fatigue life. For example, corresponding to c = 1 μm in the HCF regime, the evaluated crack initiation life at stress amplitude of 650 MPa is almost equivalent to one experimental fatigue life, whereas that at stress amplitude beyond 750 MPa is much less than the total fatigue life. Approximately, the crack initiation life curve at c = 5 μm is in agreement with the test data in the HCF regime. On the other hand, in the VHCF regime, the crack initiation lives corresponding to c = 20 μm are approximately in good agreement with the test data. It should be noted that the crack length of 20 μm is very similar to the difference between the radii of inclusion and FGA.
Evaluated crack initiation lives at different crack sizes.

F. Evaluation of crack growth life
Based on above-mentioned analysis and assumption, the crack growth life in the VHCF regime mainly consists of two parts: (i) microcrack growth life within the FGA,
 ${N_{{\rm{p}}\left( {{\rm{inc}} \to {\rm{FGA}}} \right)}}$
, and (ii) macrocrack growth life outside the FGA and within the fisheye,
 ${N_{{\rm{p}}\left( {{\rm{FGA}} \to {\rm{fisheye}}} \right)}}$
. The crack growth life in the HCF regime only corresponds to the macrocrack growth life outside the inclusion and within the fisheye,
 ${N_{{\rm{p}}\left( {{\rm{inc}} \to {\rm{fisheye}}} \right)}}$
. Taking account of the difference of crack growth behaviors in these two life regimes, a uniform crack growth equation, i.e., Paris–Hertzberg–McClintock equation,
Reference Paris, Marines-Garcia, Hertzberg and Donald32
was adopted to evaluate the crack growth life and given by
 $${{{\rm{d}}a} \over {{\rm{d}}N}} = b{\left( {{{\Delta {K_{{\rm{eff}}}}} \over {E\sqrt b }}} \right)^3}\quad ,$$
where b is the Burger's vector, ΔK eff is the effective SIF range. For the microcrack growth within the FGA in the VHCF regime, Eq. (11) combined with Eq. (1) can be rewritten as
 $${{{\rm{d}}a} \over {{\rm{d}}N}} = b{\left( {{{2\Delta \sigma \sqrt {\pi a} } \over {\pi E\sqrt b }}} \right)^3} = b{\left( {{{\Delta {K_{{\rm{inc}}}}} \over {E\sqrt b }}} \right)^3}{\left( {{a \over {{r_{{\rm{inc}}}}}}} \right)^{{3 \over 2}}} = b{\left( {{a \over {{r_{{\rm{inc}}}}}}} \right)^{{3 \over 2}}}\quad ,$$
where
 ${{\Delta K_{{\rm{inc}}} } \mathord{\left/ {\vphantom {{\Delta K_{{\rm{inc}}} } {\left( {E\sqrt b } \right)}}} \right. \kern-\nulldelimiterspace} {\left( {E\sqrt b } \right)}} = 1$
corresponds to the threshold location without crack growth, i.e.,
 $$1 = {{{\rm{d}}a} \over {{\rm{d}}N}} = {{\Delta {K_{{\rm{inc}}}}} \over {E\sqrt b }} = {{2\Delta \sigma \sqrt {\pi {r_{{\rm{inc}}}}} } \over {\pi E\sqrt b }}\quad .$$
Integrating Eq. (12) from r
inc to r
FGA, the value of
 ${N_{{\rm{p}}\left( {{\rm{inc}} \to {\rm{FGA}}} \right)}}$
is obtained as
 $${N_{{\rm{p}}\left( {{\rm{inc}} \to {\rm{FGA}}} \right)}} = {{\pi {E^2}} \over {2{{\left( {\Delta \sigma } \right)}^2}}}\left( {1 - \sqrt {{{{r_{{\rm{inc}}}}} \over {{r_{{\rm{FGA}}}}}}} } \right)\quad .$$
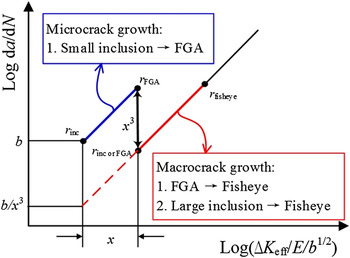
In view of the different growth behaviors between the microcrack and the macrocrack, one must integrate an adjusted growth law from the transition point (micro to macro) with a rate reduced by the factor “1/x 3”. Reference Cheng and Laird30 The schematic diagram of crack growth behavior from microcrack to macrocrack is shown in Fig. 11. At stress ratio of −1, the value of x is generally taken to be 3. Reference Cheng and Laird30 Therefore, based on Eq. (12), the macrocrack growth rate is expressed as
 $${{{\rm{d}}a} \over {{\rm{d}}N}} = {b \over {{x^3}}}{\left( {{a \over {{r_{{\rm{inc}}}}}}} \right)^{{3 \over 2}}} = {b \over {27}}{\left( {{a \over {{r_{{\rm{inc}}}}}}} \right)^{{3 \over 2}}}\quad .$$
Schematic diagram of interior crack growth from microcrack to macrocrack.

Integrating Eq. (15) from r
FGA to r
fisheye, the value of
 ${N_{{\rm{p}}\left( {{\rm{FGA}} \to {\rm{fisheye}}} \right)}}$
is obtained as
 $${N_{{\rm{FGA}} \to {\rm{fisheye}}}} = {{\pi {E^2}} \over {2{{\left( {\Delta \sigma } \right)}^2}}}\left( {27\sqrt {{{{r_{{\rm{inc}}}}} \over {{r_{{\rm{FGA}}}}}}} - 27\sqrt {{{{r_{{\rm{inc}}}}} \over {{r_{{\rm{fisheye}}}}}}} } \right)\quad .$$
Based on Eqs. (14) and (16), the total crack growth life in the VHCF regime,
 ${N_{\rm{p}}}$
, is given by
 $${N_{\rm{p}}} = {N_{{\rm{p}}\left( {{\rm{inc}} \to {\rm{FGA}}} \right)}} + {N_{{\rm{p}}\left( {{\rm{FGA}} \to {\rm{fisheye}}} \right)}} = {{\pi {E^2}} \over {2{{\left( {\Delta \sigma } \right)}^2}}}\left( {1 + 26\sqrt {{{{r_{{\rm{inc}}}}} \over {{r_{{\rm{FGA}}}}}}} - 27\sqrt {{{{r_{{\rm{inc}}}}} \over {{r_{{\rm{fisheye}}}}}}} } \right)\quad .$$
Similar to the crack growth process from r FGA to r fisheye in the VHCF regime, the crack growth life in the HCF regime can be obtained as
 $${N_{\rm{p}}} = {N_{{\rm{inc}} \to {\rm{fisheye}}}} = {{\pi {E^2}} \over {2{{\left( {\Delta \sigma } \right)}^2}}}\left( {27 - 27\sqrt {{{{r_{{\rm{inc}}}}} \over {{r_{{\rm{fisheye}}}}}}} } \right)\quad .$$
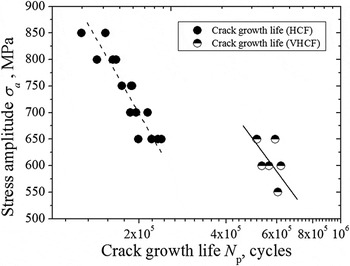
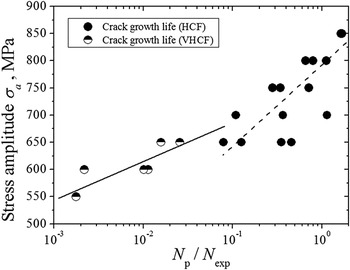
The evaluated crack growth lives are shown in Fig. 12, where those in the HCF regime are in the range of 1.2 × 10⁵–2.5 × 10⁵ cycles, and those in the VHCF regime are in the range of 4.9 × 10⁵–6.1 × 10⁵ cycles. They all tend to increase with the decrease of stress amplitude. Furthermore, if the fatigue life obtained from experiment is denoted by N exp, the relationship between the stress amplitude and the ratio of N p to N exp can be shown in Fig. 13. More directly, it can be seen from Fig. 13 that the proportion of crack growth life in the total fatigue life tends to decrease with the decrease of stress amplitude. Especially in the VHCF regime, the crack growth life only accounts for a very tiny fraction of the total fatigue life. Conversely, at higher stress amplitude in the HCF regime, the crack growth life can occupy the vast majority of the total fatigue life.
Evaluated crack growth lives in the HCF/VHCF regimes.

Relationship between σa and N p/N exp.

G. Prediction of total fatigue life
Based on Eqs. (8) and (17), the predicted fatigue life for the interior inclusion-induced failure with the FGA in the VHCF regime, N pre-VHCF, can be obtained as
 $${N_{{\rm{pre}} - {\rm{VHCF}}}} = {N_{\rm{i}}} + {N_{{\rm{p}}\left( {{\rm{inc}} \to {\rm{FGA}}} \right)}} + {N_{{\rm{p}}\left( {{\rm{FGA}} \to {\rm{fisheye}}} \right)}} = {\left[ {{{\left( {\mu + {\mu _{{\rm{inc}}}}} \right)} \over {0.005{\mu _{{\rm{inc}}}}}}} \right]^{{1 \over {2\alpha }}}}{\left( {{{{h^2}M\mu } \over {\left( {hl + {l^2}} \right)\left( {\Delta \sigma - 2{\sigma _{\rm{w}}}} \right)}}} \right)^{{1 \over \alpha }}}{\left( {{c \over {{r_{{\rm{inc}}}}}}} \right)^{{1 \over {2\alpha }}}} + {{\pi {E^2}} \over {2{{\left( {\tau \Delta \sigma } \right)}^2}}}\left( {1 + 26\sqrt {{{{r_{{\rm{inc}}}}} \over {{r_{{\rm{FGA}}}}}}} - 27\sqrt {{{{r_{{\rm{inc}}}}} \over {{r_{{\rm{fisheye}}}}}}} } \right)\quad }.$$
Moreover, based on Eqs. (8) and (18), the predicted fatigue life for the interior inclusion-induced failure without the FGA in the HCF regime, N pre-HCF, can be obtained as
 $${N_{{\rm{pre}} - {\rm{HCF}}}} = {N_{\rm{i}}} + {N_{{\rm{p}}\left( {{\rm{inc}} \to {\rm{fisheye}}} \right)}} = {\left[ {{{\left( {\mu + {\mu _{{\rm{inc}}}}} \right)} \over {0.005{\mu _{{\rm{inc}}}}}}} \right]^{{1 \over {2\alpha }}}}{\left( {{{{h^2}M\mu } \over {\left( {hl + {l^2}} \right)\left( {\Delta \sigma - 2{\sigma _{\rm{w}}}} \right)}}} \right)^{{1 \over \alpha }}}{\left( {{c \over {{r_{{\rm{inc}}}}}}} \right)^{{1 \over {2\alpha }}}} + {{\pi {E^2}} \over {2{{\left( {\tau \Delta \sigma } \right)}^2}}}\left( {27 - 27\sqrt {{{{r_{{\rm{inc}}}}} \over {{r_{{\rm{fisheye}}}}}}} } \right)\quad}.$$
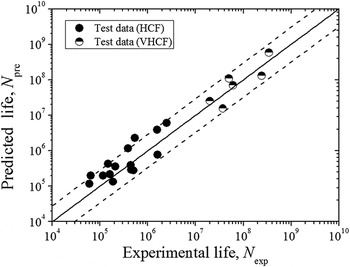
Figure 14 shows the comparison between the predicted and experimental lives in the HCF regime and in the VHCF regime. It can be seen that the agreement is fairly good within the factor-of-three boundaries. Overall, the results are satisfactory, especially in the VHCF regime. This means that from the viewpoint of crack initiation and growth, the above-established life prediction method for the interior inclusion-induced failure in the HCF regime and in the VHCF regime can be acceptable. Moreover, the characterization of interior crack initiation and growth behaviors in the HCF regime and in the VHCF regime is reasonable.
Comparison between the predicted and experimental results.

IV. CONCLUSIONS
Main conclusions obtained in this study are summarized as follows:
-
(1) The carburized gear steel exhibits the duplex S–N characteristics associated with the interior inclusion-induced failure without the FGA in the HCF regime and the interior inclusion-induced failure with the FGA in the VHCF regime.
-
(2) The fatigue process of carburized gear steel is divided into two types: (i) inclusion → fisheye → FCGZ → MFZ (in the HCF regime) and (ii) inclusion → FGA → fisheye → FCGZ → MFZ (in the VHCF regime).
-
(3) In the HCF regime, the proportion of fatigue life spent in the crack growth process tends increase with the increase of stress amplitude.
-
(4) In the VHCF regime, the crack initiation life associated with the FGA size is almost equivalent to the total fatigue life, whereas the predicted crack growth life only accounts for a tiny fraction.
-
(5) For the interior inclusion-induced failure in the HCF regime and in the VHCF regime, the life modeling method associated with crack initiation and growth is valid on the basis of the good agreement between the predicted and experimental results.
ACKNOWLEDGMENTS
This work was supported by National Natural Science Foundation of China (Grant No. 51305027).