

1. Introduction
Despite the long tradition in the international economics profession of investigating the sources and size of trade costs, empirical researchers continue to face a major challenge in measuring trade costs since ‘direct measures are remarkably sparse and inaccurate’ (Anderson and van Wincoop, Reference Anderson and van Wincoop2004: 692). Direct measures are available for a few components such as transportation and insurance costs, policy barriers such as tariff or non-tariff measures, but not for many other components such as bureaucratic red tape. In addition, data coverage is often limited to a few countries, industries, products, or years (Anderson and van Wincoop, Reference Anderson and van Wincoop2004).
To overcome those difficulties, an alternative approach to measuring trade costs is to indirectly infer the level of trade impediments from trade flows. A first way of doing this is to use the ‘phi-ness’ of trade to estimate ‘border effects,’ which is in essence a ratio of bilateral over domestic trade flows and mostly reflects border-related costs (Head and Ries, Reference Head and Ries2001; Baldwin et al., Reference Baldwin, Forslid, Martin, Robert-Nicoud, Heijdra and Brakman2003; Head and Mayer, Reference Head and Mayer2004). A second and related approach is to rely on a measure of bilateral trade impediments that is derived by modeling disaggregated trade flows at the industry level in the gravity framework pioneered by Anderson and van Wincoop (Reference Anderson and van Wincoop2003, Reference Anderson and van Wincoop2004), allowing trade costs to be heterogeneous across industries. The resulting measure accounts for heterogeneity across industries by incorporating industry-specific substitution elasticities (Chen and Novy, Reference Chen and Novy2011).
This paper reviews the literature on the measurement of trade costs with a special emphasis on non-tariff measures such as product standards and technical regulations which require specific product characteristics or production methods in order to guarantee the health and safety of consumers or the protection of the environment.Footnote 1 Differing standards and technical regulations (or Technical Barriers to Trade, TBTs) can indeed be obstacles to trade as they can create additional costs for foreign producers by forcing them to adjust their products to meet national requirements. In order to overcome their trade-distorting effects, policy-makers try to harmonize such standards and regulations between countries.Footnote 2 A contrasting view considers that standards and regulations may instead encourage trade by raising quality or by promoting scale economies (see Blind, Reference Blind2004; Swann et al., Reference Swann, Temple and Shurmer1996). Our main aim, however, is to review how standards and regulations are measured for the purpose of empirical analysis, not how they affect international trade (Swann, Reference Swann2010).
Compared to Anderson and van Wincoop (Reference Anderson and van Wincoop2004), who provide an extensive review of the measurement of any type of trade costs, the objective of this paper is to extend their review to articles mostly published after their seminal contribution with a special emphasis on standards and technical regulations. We also distinguish between the ‘direct’ and the ‘indirect’ approaches to measuring non-tariff measures and illustrate their similarities and differences using some data on private standards at the European Union (EU) level.
2. The gravity equation as a starting point
Traditionally, researchers attempt to learn about the effect of trade costs on trade by considering the gravity equation, which has been shown to have broad theoretical foundations (Anderson, Reference Anderson2011). As an illustration, we adopt the popular specification by Anderson and van Wincoop (Reference Anderson and van Wincoop2004) based on an Armington model:
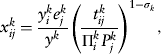
where bilateral trade flows x ijk in industry k depend on output y ik of the exporting country i in industry k and expenditure e jk of the importing country j relative to global output yk in that industry. The interest focuses on bilateral trade costs t ijk. They reduce trade as governed by the elasticity of substitution σ k>1 amongst the underlying product varieties in that industry. All else being equal, larger average outward trade barriers Πik of country i and larger average inward trade barriers P jk of country j lead to more bilateral trade.Footnote 3 For estimation purposes, gravity equation (1) is typically log-linearized, and the output and multilateral resistance terms are absorbed by exporter and importer fixed effects, or they are approximated using Baier and Bergstrand's (Reference Baier and Bergstrand2009) method.
A researcher who wants to estimate the effect of trade costs on trade needs to specify a trade cost function by relating the unobservable t ijk variable to observable trade cost proxies. Such proxies typically include geographic data such as distance between countries i and j as well as a range of cultural, historical, or political variables. This might also include some measures for standards and technical regulations as we explain in the next section.
3. The ‘direct’ approach
The ‘direct’ approach to measuring trade costs collects observable data or proxy variables on trade cost components. The literature we review is grouped under two headings according to the way standards and technical regulations are measured: explicit measures assess the existence or the amount of standards and regulations, while implicit measures typically capture the trade effects of standards and regulations without establishing how many are present.
3.1 Explicit measures
Count of the number of standards
Perinorm is a subscription-only bibliographic database on national, European, and international standards for the industries of 23 countries.Footnote 4 The papers that use this rich database to measure standards typically count the total number of standards per industry and country, and distinguish ‘national’ standards from ‘harmonized’ standards (defined as being equivalent either to international standards, e.g. Swann et al., Reference Swann, Temple and Shurmer1996, or to the ones of trading partners, e.g. Moenius, Reference Moenius2004, Reference Moenius2006, Reference Moenius2007).Footnote 5 Unfortunately, such count measures suffer from a ‘mixed bag’ problem (Swann, Reference Swann2010: 10) as they just add up standards that might differ in importanceFootnote 6 but also in type (e.g., quality versus compatibility standards). In an attempt to measure the relative stringency and technical complexity of different standards, the number of pages of each standard is sometimes used as a proxy for its complexity (Shepherd, Reference Shepherd2006; Czubala et al., Reference Czubala, Shepherd and Wilson2009).Footnote 7
Notification data from the WTO
The UNCTAD's TRAINS database records notifications on regulations to the WTO from the late 1980s and provides information on the notifying country (the importer), the affected product and the type of barrier. WTO rules require members to notify the WTO whenever a proposed or adopted regulation (1) is not in accordance with an international one, and (2) may affect the trade of other members. The use of such information to measure regulations therefore suffers from three main shortcomings. First, if one country applies an internationally recognized regulation while other countries do not, then this cross-country difference is not accounted for in the data set. Second, only changes to existing measures have to be reported, which means that measures that have existed for a long time but have never been changed are not accounted for either. Third, there is suspicion that some countries systematically notify more frequently than others, raising concerns about data consistency across countries.
Notifications are generally used to compute coverage and frequency ratios to explain trade flows (e.g., Disdier et al., Reference Disdier, Fontagné and Mimouni2008; Essaji, Reference Essaji2008).Footnote 8 Even if they are widely used in empirical analysis, it is worth remembering that both suffer from weaknesses: neither is able to capture precisely the relative importance of each non-tariff measure in affecting trade flows because the frequency ratio simply adds up the measures as if they were all the same, while the coverage ratio erroneously gives a small weight to the products covered by the most trade-restrictive policies (Nogués et al., Reference Nogués, Olechowski and Winters1986; Korinek et al., Reference Korinek, Melatos and Rau2006).
Identification of standards and regulations
Based on a literature review, case studies, and interviews with national bodies in the 15 EU member states and with EU officials, a study undertaken for the European Commission (European Commission, 1998) assesses the types of measures applying in 130 industries within the EU: technical regulations, standards, both, or no barriers. It also assesses, on a five-point scale, the overall effectiveness of EU policies in removing TBTs where the largest value indicates that all TBTs were successfully removed (Chen, Reference Chen2004; Chen and Novy, Reference Chen and Novy2011). This does not indicate how many standards or regulations are present, nor how stringent they are, but this information can be used to distinguish industries according to the type of measures that exist and whether they are still affected by TBTs or not.
3.2 Implicit measures
Regional agreements
This approach consists of counting or identifying (with a dummy variable) the policy instruments that aim to harmonize standards or regulations within a region.Footnote 9 The instruments considered in the literature are usually EU-specific (Brenton et al., Reference Brenton, Sheehy and Vancauteren2001; Henry de Frahan and Vancauteren, Reference Henry de Frahan and Vancauteren2006; Baller, Reference Baller2007; Chen and Mattoo, Reference Chen and Mattoo2008), while Mutual Recognition Agreements (on conformity assessment procedures) involve both EU and non-EU countries (Baller, Reference Baller2007; Chen and Mattoo, Reference Chen and Mattoo2008). The count or identification of instruments is carried out either at the industry level (Baller, Reference Baller2007; Chen and Mattoo, Reference Chen and Mattoo2008) or at the disaggregated level of products, in which case coverage or frequency ratios are computed at the industry level (Brenton et al., Reference Brenton, Sheehy and Vancauteren2001; Henry de Frahan and Vancauteren, Reference Henry de Frahan and Vancauteren2006).
Surveys
The World Bank Technical Barriers to Trade Survey analyzes how the exports of 689 individual firms in 17 developing countries to five developed countries in 2002 are affected by foreign technical requirements. Five specific questions allow the construction of variables capturing the trade effects of standards and technical regulations (binary variables) and of conformity assessment procedures (including the average time in days it takes for conformity assessment inspection to complete) (see Maskus et al., Reference Maskus, Otsuki and Wilson2005; Chen et al., 2006).Footnote 10
Case studies
Other papers focus on the trade effects of one specific regulation only. For instance, Otsuki et al. (Reference Otsuki, Wilson and Sewadeh2001) use the maximum aflatoxin levels, a toxic fungus, that are permitted in EU groundnut imports.Footnote 11 Wilson and Otsuki (2002) use the maximum residue limit (MRLs) of chlorpyrifos, a pesticide, in affecting banana and plantain imports, while Wilson et al. (Reference Wilson, Otsuki and Majumdsar2003) use the MRLs of tetracycline, a widely used antibiotic, to explain beef imports. All three papers also use the difference between the domestic regulation and the Codex equivalent to predict the changes in trade flows if regulations were harmonized at the Codex level.Footnote 12 This allows researchers to determine the stringency of a national regulation relative to Codex in affecting trade, but not the stringency of the regulation itself.
Other studies measure the diffusion or adoption of one specific international standard across countries and typically investigate its effect on trade. Although diffusion does not capture the stringency of a standard, it can be expected to promote trade by stimulating the competitiveness of domestic products by signaling their quality and safety. In the case of ISO 9000, a quality management standard for firms, Clougherty and Grajek (Reference Clougherty and Grajek2009) use the ratio between the number of ISO 9000 certificates in a country and its population, while Kim and Reinert (Reference Kim and Reinert2009) rely on the proportion of firms in each country with ISO 9000 certification. Herzfeld et al. (Reference Herzfeld, Drescher and Grebitus2011) count the number of issued certificates for GlobalGAP and BRC Food Technical Standard in different countries.
To conclude, the reviewed literature suggests that measuring standards and technical regulations is not an easy task. Explicit measures attempt to capture the presence or the amount of standards and regulations by using dummy or count variables, frequency, or coverage ratios, but their stringency remains hard to evaluate. Implicit measures suffer from similar problems. It should be added that the possible endogeneity of standards and regulations – however measured – in explaining trade flows is another concern. Firstly, standards and regulations, as well as the decision to harmonize across countries, could be the result rather than the cause of trade. Secondly, the trade weights that are required for the computation of coverage ratios are usually the same trade flows that appear as a dependent variable, making coverage ratios endogenous by construction (Chen and Mattoo, Reference Chen and Mattoo2008; Essaji, Reference Essaji2008; Clougherty and Grajek, Reference Clougherty and Grajek2009, use instrumental variables estimation, while Czubala et al., Reference Czubala, Shepherd and Wilson2009; Portugal-Perez et al., Reference Portugal-Perez, Reyes and Wilson2010, use the lagged values of standards).
4. The ‘indirect’ approach
We now turn to the ‘indirect’ approach of measuring trade costs. Indirect trade cost measures capture a wide range of trade cost elements and are therefore hardly suitable to quantify the costs related to standards and regulations only. However, they can be regressed on various trade cost proxies, including measures of standards and regulations as discussed in the previous section, and a variance decomposition can be carried out to determine the contribution of standards and regulations to the variance of the comprehensive trade cost measure.
Returning to gravity equation (1), a problem with specifying the trade cost function is its inherent arbitrariness. Although most researchers opt for a log-linear trade cost function, theory generally gives no guidance as to the appropriate functional form.Footnote 13 As a result, the estimated effect of a certain trade cost element depends on the chosen ad hoc form. A second problem is that many trade cost elements are unobservable. Thus, researchers run the risk of omitting potentially important trade cost elements. A third problem is that some proxies, such as distance, do not vary over time, which makes it difficult to track changes in trade costs.
The indirect approach tries to overcome these problems by indirectly inferring implied trade costs from trade data without specifying a trade cost function. A first step in that direction is taken by the ‘phi-ness’ of trade. The idea is to isolate the trade cost variable from the micro-founded gravity equation and express it in terms of observable trade data. But solving equation (1) for t ijk is problematic as the multilateral resistance variables are unknown. However, they can be eliminated by multiplying the gravity equation by its counterpart for trade flows in the opposite direction, x jik, and then dividing it by the product of gravity equations for domestic trade flows in each country, x kiixjjk. Taking the square root results in the expression for the phi-ness of trade ϕ ijk:
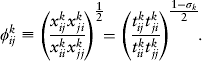
This approach was first adopted by Head and Ries (Reference Head and Ries2001) and followed by a number of other papers (e.g., Baldwin et al., Reference Baldwin, Forslid, Martin, Robert-Nicoud, Heijdra and Brakman2003; Head and Mayer, Reference Head and Mayer2004).Footnote 14 Expression (2) should be interpreted as an overall trade cost measure at the industry level that captures a comprehensive set of trade cost elements, scaled by the industry-specific elasticity of substitution σ k. It measures bilateral trade costs relative to domestic trade costs and is by construction symmetric (i.e., ϕ ijk=ϕ jik). Since it is a function of observable trade data, ϕ ijk can generally be constructed for many countries, industries and years and is thus in principle more broadly available than many direct trade cost data.Footnote 15 For example, Head and Mayer (Reference Head and Mayer2004) calculate ϕ ijk for 21 industries for the US–Canada and France–Germany country pairs in 1995.
A drawback of phi-ness is that it cannot distinguish between the trade cost variables and the elasticity of substitution σ k because it is based on a simple trade ratio. When dealing with aggregate data, this might not be a major concern.Footnote 16 But when the focus is on measuring trade costs at the industry level, it must be taken into account that substitution elasticities vary substantially across industries (Broda and Weinstein, Reference Broda and Weinstein2006). Chen and Novy (Reference Chen and Novy2011) therefore adopt a related trade cost measure that they denote θ ijk:
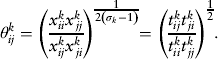
A high value of θ ijk corresponds to relatively high implied bilateral trade costs. Since a low σ k indicates a high degree of differentiation of products and thus a large degree of heterogeneity, θ ijk is able to separate differences in trade barriers from heterogeneity at the industry level.Footnote 17
Chen and Novy (Reference Chen and Novy2011) estimate the substitution elasticities using a methodology adapted from Feenstra (Reference Feenstra1994) and compute θ ijk for 163 industries across 11 EU countries between 1999 and 2003. They regress θ ijk on a number of trade cost proxies and find that, among other factors, TBTs significantly increase implied trade costs. They also find that about 2.7% of the variance of θ ijk is explained by their TBT measure (which captures the effectiveness of EU policies in removing TBTs – European Commission, 1998).
It should be noted that the two expressions in (2) and (3) are not estimated but rather calibrated from the data, not unlike the Solow residual in the growth literature or the labor wedge (Shimer, Reference Shimer2009). A disadvantage is that the expressions therefore contain any measurement error that may be part of the trade flow data. Thus, as a matter of caution they should be interpreted as trade cost measures, not literally as trade costs.
To conclude, the direct and the indirect approaches provide researchers with different sets of information and thus can be considered as complementary: the first provides measures for standards and regulations, which can be used to estimate the sensitivity of trade flows to standards and regulations; the second regresses implied trade costs on standards and regulations, which further allows for a decomposition of the variance of total trade costs into the contribution that is attributable to standards and regulations. Both are equally affected by the problems inherent to the measurement of standards and regulations (use of count variables, frequency and coverage ratios) and by endogeneity. But in contrast to the direct approach, the indirect approach requires domestic trade data which are not always readily available, while at the same time it has an in-built control for multilateral resistance. Finally, with regard to the indirect approach, θ ijk is theoretically better suited than ϕ ijk to isolate the trade barrier effect from the heterogeneity effect, but in practice its computation can be difficult as it requires estimates of the substitution elasticities σ k.
5. Illustration
We now compare the direct and the indirect approaches to measuring standards. We use the data from Chen and Novy (Reference Chen and Novy2011) to measure bilateral trade frictions as captured by θ kij,t and ϕ kij,t (the indirect approach) between 11 EU countries at the four-digit NACE industry level between 1999 and 2003, and we also use the corresponding trade flows x kij,txji,tk (as an illustration of the direct approach).Footnote 18 We regress the three variables on the number of private standards at the EU level taken from the World Bank's EU Standards database (Shepherd, Reference Shepherd2006) at the HS2002 level for the agriculture, textiles, and clothing industries, which results in a sample of 35 NACE industries.Footnote 19 To reduce endogeneity issues, standards are lagged by one period. Given that these standards are shared by EU countries, we would expect them to correlate positively with trade flows and negatively with θ kij,t and ϕ kij,t.
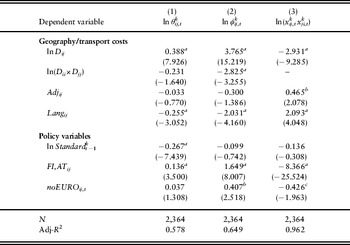
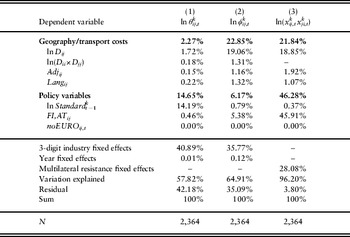
Table 1 reports the results of regressing θ kij,t, ϕ kij,t, and x kij,txkji,t on standards Standard t−1k in addition to other typical gravity variables.Footnote 20 Column (1) indicates that standards lower θ kij,t. In contrast, they are insignificant in explaining ϕ kij,t (column 2) or trade flows (column 3). Table 2 shows that standards explain 14% of the variance of θ kij,t and nothing of the variance of ϕ kij,t or bilateral trade x kij,txkji,t. This exercise illustrates that the different approaches, as well as the use of different indirect trade cost measures (i.e., θ kij,t versus ϕ kij,t), can lead to contrasting predictions regarding the economic importance of standards. Technically, such differences arise because in contrast to ϕ kij,t and x kij,txji,tk, the θ kij,t measure has an in-built control for the elasticity of substitution σ k. But from an economic point of view, further research should investigate the reasons why controlling for heterogeneity leads to such differences and what the interaction between heterogeneity and standards is.
‘Direct’ vs. ‘Indirect’ approaches to measuring standards

Notes: Year and three-digit industry fixed effects are included in (1) and (2), industry times year fixed effects, separately for the exporting and the importing country, are included in (3). Robust standard errors are adjusted for clustering at the four-digit NACE Rev.1 level in each country pair. The sample period is 1999–2003. t-statistics in parentheses. Constant terms are included but not reported. a, b, and c indicate significance at 1%, 5%, and 10% levels, respectively. Explanatory variables include bilateral distance D ij and domestic distances D ii×D jj, dummies for sharing a common border Adj ij and a common language Lang ij, lagged standards Standard t−1k, and dummies for Finland and Austria who joined the EU last in the sample FI,AT ij and for remaining outside the Eurozone noEURO ij ,t. For a description of the variables, see Chen and Novy (Reference Chen and Novy2011).
Variance decompositions

Notes: The variance decompositions are calculated according to Fields (Reference Fields2003). The contribution of each explanatory variable x m to the total variance of a dependent variable Y is given by c m=β mcov(x m,Y)/var(Y) where β m is the partial regression coefficient of Y on the explanatory variable x m (holding all other explanatory variables constant). The decompositions in columns (1) to (3) correspond to regressions (1) to (3) in Table 1. The contributions sum to 100%.
6. Concluding remarks
Standards and technical regulations are a predominant concern in today's global trade negotiations, and as claimed by Pascal Lamy, the WTO Director-General, they can even be considered as ‘the real 21st century trade issues’.Footnote 21 For the purpose of empirical analysis, it is therefore crucial to better measure standards and regulations, and we hope that additional and more precise measures will become available in the future. For instance, the availability of a data set similar to Perinorm but for mandatory technical regulations would be welcome. Also, although some unofficial concordance exists between the International Classification of Standards (as used by Perinorm) and the SITC trade classification (Blind, Reference Blind2004), future research would further benefit from a better matching between standards and trade classifications.
As far as the indirect approach of inferring trade costs is concerned, future research needs to examine the robustness of this approach to recent theoretical innovations. For example, Fieler (Reference Fieler2011) introduces non-homotheticity such that rich countries produce and demand a different bundle of goods than poor countries. Non-homotheticity would be a problem for the trade cost measures (2) and (3) if it applied differentially to bilateral and domestic trade. Also, few frameworks exist for gravity with different stages of intermediate production (Baldwin and Taglioni, Reference Baldwin and Taglioni2011). In addition, Chen and Novy (Reference Chen and Novy2011) show that the exponent of the trade cost measure (3) is not necessarily a function of the CES substitution elasticity and could depend on technology parameters including the Fréchet parameter of the Ricardian model by Eaton and Kortum (Reference Eaton and Kortum2002) or the Pareto parameter of the heterogeneous firms model by Chaney (Reference Chaney2008). Finally, we show that the different approaches, as well as the use of different indirect trade cost measures, can lead to contrasting predictions regarding the economic importance of standards. Understanding the reasons for such differences is an additional avenue for future research.