Introduction
Body image (BI) is a mental opinion or description of an individual's physical appearance (Wykes & Gunter, Reference Wykes and Gunter2005). Body image disturbance, encompassing a subjective unhappiness with some aspect of one's appearance, is prevalent and may be associated with psychological distress and functional impairment (Thompson et al., Reference Thompson, Coovert and Stormer1999). Perception of BI among people ranges widely from very negative to very positive. Depending on age and other factors, the degree of concern with BI can also vary widely among individuals. Ample evidence indicates that there can be misperceptions about BI, even among adults who are not considered vulnerable to BI problems (McCabe & Ricciardelli, Reference McCabe and Ricciardelli2003). This misperception may cause individuals to overlook potential problems, thwart motivation to engage in preventive behaviours or even contribute to actions that cause new health problems (Kuchler & Variyam, Reference Kuchler and Variyam2003).
The body weights (BW) of humans vary widely (Sobal, Reference Sobal1991), and there are individual differences in their perceptions (Scott et al., Reference Scott, Bentley, Tovee, Ahamed, Magid, Swami and Furnham2007). In the last two decades there have been increases in population weight (World Health Organization, 1998; Jefferey & Utter, Reference Jefferey and Utter2003), increasing the need to understand perception of body weight (Hoare & Cosgrove, Reference Hoare and Cosgrove1998). For example, when the accuracy of perceptions of overweight is considered closely, the problem may not be just that thin individuals feel fat (Pritchard et al., Reference Pritchard, King and Czajka-Narins1997), but also that many overweight individuals may be unaware that their body weight is too high (Chang & Kristakis, Reference Chang and Christakis2003). Body weight is related to social rank or position in many societies (Messer, Reference Messer1989). Social differences in perceived body weight and BI are important given the well-documented socioeconomic disparities in obesity-related health conditions (Hassan et al., Reference Hassan, Joshi, Madhavan and Amonkar2003). Moreover, possible socioeconomic differences in perception of BW may inform the differences in health lifestyle decisions (Cockerham, Reference Cockerham2005).
Ideal body size internalization in society is an important concept that may influence perception of BI (Thompson et al., Reference Thompson, Coovert and Stormer1999). For example, family, peers and media are thought to reinforce the thin-ideal body size for women through actions that support and perpetuate this ideal. These agents communicate expectations concerning the benefits of thinness and these expectations play a key role in the propagation of this ideal (Hohlstein et al., Reference Hohlstein, Smith and Atlas1998). Thin-ideal internalization putatively promotes body dissatisfaction because it is difficult to attain for most people (Thompson et al., Reference Thompson, Coovert and Stormer1999), and this theoretically fosters dieting and has a negative effect, increasing the risk of bulimic symptoms (Stice, Reference Stice2001).
Socioeconomic status has been reported to be associated with ideal body weight perception (Wang et al., Reference Wang, Liang and Chen2009; Lynch et al., Reference Lynch, Liu, Spring, Hankinson, Wei and Greenland2007). Furthermore, reports on association between body weight perception and socioeconomic status abound (Paeratakul et al., Reference Paeratakul, White, Donald, Williamson, Ryan and Bray2002; Chang & Christakis, Reference Chang and Christakis2003; Kuchler & Variyam, Reference Kuchler and Variyam2003; Lynch et al., Reference Lynch, Liu, Spring, Hankinson, Wei and Greenland2007; Schieman et al., Reference Schieman, Pudrovska and Eccies2007; Duda et al., Reference Duda, Jumah, Hill, Seffah and Biritwum2007; Alwan et al., Reference Alwan, Viswanathan, Williams, Paccaud and Bovet2010). However, only a few of these studies are from Africa (Duda et al., Reference Duda, Jumah, Hill, Seffah and Biritwum2007; Alwan et al., Reference Alwan, Viswanathan, Williams, Paccaud and Bovet2010), and specifically, none is on African populations originating in Nigeria. The findings from other African populations may not be easily extrapolated to a Nigerian population as there are cultural and ethnic differences in perception of body weight (Dorsey et al., Reference Dorsey, Eberhardt and Ogden2009; Mikolajczyk et al., Reference Mikolajczyk, Maxwell, Ansari, Stock, Petkeviciene and Grima2010). Furthermore, the findings of previous studies are mixed. In addition, despite the behavioural and psychological implications of BI for weight-control decisions, there is a dearth of information on perception of BI in relation to the socioeconomic status of individuals. In this study, perceived BI was conceptualized as a pictorial idea of an individual's body weight status, while perceived body weight was regarded as an abstract idea of one's body weight status. This report presents socioeconomic status in relation to perception of body image and body weight of Nigerian adults.
Methods
This cross-sectional study involved male and female residents of Nnewi, Nigeria, aged 18 and above, who had lived in the area for at least 2 years. Nnewi is a major town in Anambra State in south-eastern Nigeria. As of 2006, Nnewi had an estimated population of 391,227 according to the Nigerian census (www.en.wikipedia.org/wiki/Nnewi). Nnewi has four sections (Otolo, Umudim, Uruagu and Nnewi-ichi). Three churches were selected from each of the sections using simple random sampling. Churches were used as the unit of randomization based on the fact that an overwhelming majority (over 96%) of Nnewi residents are of Christian faith (www.en.wikipedia.org/wiki/Nnewi). One thousand, five-hundred and twenty-one residents (775 males and 746 females) were recruited consecutively from the twelve randomly selected churches of different denominations. Originally, a sample size of 1388 participants was estimated but at the end of data collection 1521 respondents participated and all were included in data analysis. The original sample size estimation was derived from a significant level (α) of 0.05, a power of 80%, design effect of 3, subgroup estimated prevalence difference of 15% and percentage population of 75% in subgroup with the higher estimated prevalence (OpenEpi, 2013). The participants gave their informed consent to participate in this study. The participants were aged 18 years or over. Exclusion criteria included being pregnant, having a deformity (such as polio paralysis or lower limb amputation that may make height measurement unreliable) and not adequately understanding the questions on BI and BW. The participants' BW, BI, occupation and educational attainment were assessed and recorded.
The data were collected from March to May 2010. The procedures for the study were approved by the Ethics Committee of Nnamdi Azikiwe University Teaching Hospital, Nnewi. At the selected churches, the managements of the churches were approached to seek their consent to carry out the study in the church premises after a Sunday service. All the selected churches approached gave their consent and agreed to announce to the congregation about the study after the service. On the chosen dates (Sundays), the residents came to meet the researchers at the chosen place in the church premises and the details of the study were explained to them, after which their consent was obtained.
The perceived BI of participants were assessed by presenting them with a series of nine male and nine female silhouette pictures depicting body sizes rated from extremely thin (assigned ‘1’) to morbidly obese (assigned ‘9’). This Figure Rating Scale had previously been validated by Stunkard et al. (Reference Stunkard, Sorensen, Hanis, Teasdale, Chakraborty, Schuli and Schursiger1986) in a study of persons from diverse ethnic backgrounds. The Figure Rating Scale also has good test–retest reliability (Thompson & Altabe, Reference Thompson and Altabe1991). The silhouettes are arranged in two rows. The top row depicts male body sizes while the one below represents the body sizes for females. Participants were asked to indicate the silhouette that they perceived as their BI. The silhouette figures were assigned a BW status based on the calculated mean BMI of the participants who chose them. Although the people who chose silhouette 1 had a mean BMI value in the normal weight range, the figure was used to designate underweight because it is the thinnest figure in the list. The assignment of BW status was as follows: underweight (silhouette 1), normal weight (silhouettes 2, 3 and 4), overweight (silhouette 5 and 6) and obese (silhouettes 7, 8 and 9). The participants were also asked to indicate whether they perceived themselves as underweight, normal weight, overweight or obese.
Body weight was measured to an accuracy of 2 decimal places using a weighing scale (Hana, model BR9011; 120×0.01 kg, China). Before measurement, the pointer of the scale was set to zero. The participants were asked to undress to light clothing and bare feet. They stood erect on the weighing scale, looked straight ahead and relaxed. The research assistants took the readings by bending over the scale with their eyes directly over it. The readings were taken when the pointer stabilized. In addition, height was measured in metres to 2 decimal places using a height meter (Seca, model 206, Germany). The participants were dressed as for weight measurement. The height meter was mounted on the wall and the participants stood erect, barefooted, and looked straight ahead. The measurement was taken on the meter against the vertex of the head. The BMIs of the participants were calculated from their height and weight as Weight/Height2. From the calculated BMI, the participant's actual BW was determined as underweight, normal weight, overweight or obese using WHO criteria (WHO, 2009).
Information on the participants' occupational status and highest educational attainment was collected using questionnaires. The occupation questionnaire was a 5-point scale: social class I (SC I; professional), social class II (SC II; managerial and technical), social class III (SC III; skilled, manual and non-manual), social class IV (SC IV; partly skilled) and social class V (SC V; unskilled) (Office of Management and Budget, 1998). Similarly, the participant's highest educational attainment was assessed on a 6-point scale questionnaire: pre-primary (0), primary (1), lower secondary (2), upper secondary (3), post-secondary non-tertiary (4), first stage of tertiary education (5) and secondary stage of tertiary education (6) (UNESCO, 1997). The questionnaire for data collection was available in English and the local language, Igbo. All the questions were in writing. Apart from the measurement of weight and height by the researcher, the majority of the participants responded to the questions on BI, BW and socio-demographic characteristics without help. Those who were not literate in any of the two languages were helped out individually.
The participants reported their ages at their last birthday (in years), and their sex was also recorded. Data were summarized using frequency and proportion as well as mean and standard deviation. For the purpose of analysis, the occupational categories were merged as SC I, II and III (Skilled) and SC IV and V (Unskilled), while the educational categories were merged as 0, 1, 2, 3 and 4 (Non-tertiary level) and 5 and 6 (Tertiary level). The Mann–Whitney U-test was used to test for the difference in perceived BI between the ‘skilled’ and ‘unskilled’, and between the ‘tertiary’ and ‘non-tertiary’ groups, and the difference in perceived BW between the ‘skilled’ and ‘unskilled’, and between the ‘tertiary’ and ‘non-tertiary’ groups. The Wilcoxon test was used to test for differences between each of the perceived BI and perceived BW and actual body weight among participants. Binary logistic regression was used to determine the associations between perceived BI for each occupational and educational attainment category, and perceived BW and each occupational and educational attainment category. Adjustments were carried out for age, sex, self-ideal BI and BMI of participants. Perceived BI and perceived BW were dichotomized as underweight/normal weight (small status) and overweight/obesity (large status) for the purpose of analysis. SPSS software (version 16) was used for the analyses. Alpha-level was set at 0.05.
Results
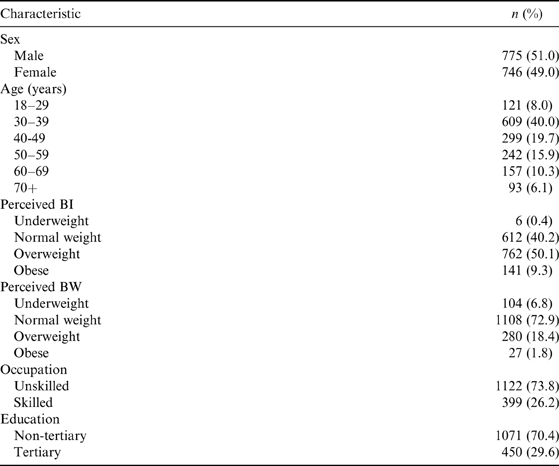
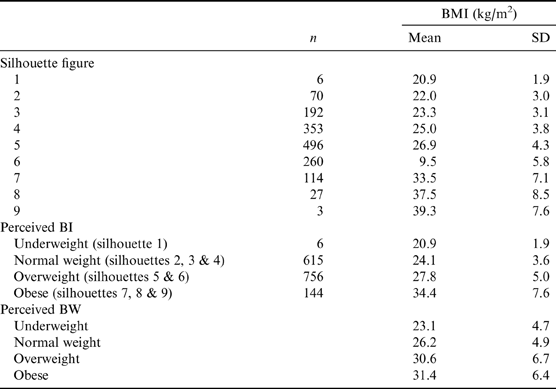
The mean age of the participants was 43.83±14.24 years with a mean BMI of 26.89±5.68 kg/m2. The distributions of the participants' categorical variables are shown in Table 1. The mean BMI values of the participants who chose each silhouette figure are shown in Table 2. Those choosing silhouette figures 1, 2, 3 and 4 had BMI values in the normal weight range, those choosing figures 5 and 6 were in the overweight range, while those choosing silhouette figures 7, 8 and 9 had BMI values in the obese range.
Distribution of participants by socio-demographic characteristics, perceived body image and perceived body weight, Nnewi, Nigeria, 2010

Body mass index values for different silhouette figures, and estimated and perceived body weights, Nnewi, Nigeria, 2010
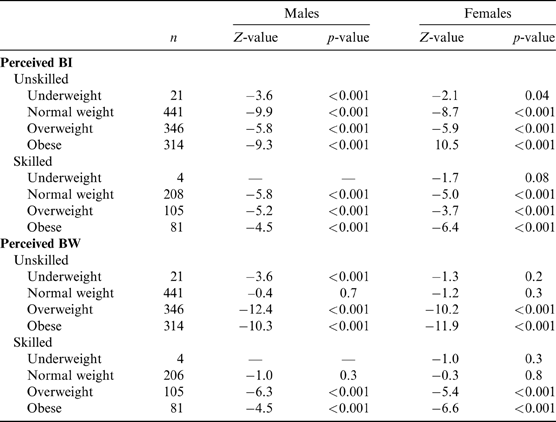
The ‘unskilled’ underweight and normal-weight males perceived a larger BI than their actual BW (p<0.001), whereas their overweight and obese counterparts perceived a smaller BI than their actual BW (p<0.001) (Table 3). The findings for the ‘skilled’ males were similar to those of their ‘unskilled’ counterparts except for the underweight category, where analysis was not possible due to insufficient participants being underweight (Table 3). The ‘unskilled’ underweight (p=0.04) and normal-weight (p<0.001) females perceived a larger BI than their BW, whereas their overweight and obese counterparts perceived a smaller BI (p<0.001) (Table 3). The findings for the ‘skilled’ females were similar to those of their ‘unskilled’ counterparts, except for the underweight category where the perceived BI was similar to their actual BW (p=0.08) (Table 3). The ‘unskilled’ underweight males perceived a larger BW (p<0.001) than their actual BW, whereas their overweight and obese counterparts perceived a smaller BW (p<0.001) (Table 3). For the ‘skilled’ males, and the ‘skilled’ and ‘unskilled’ females, only the overweight and obese perceived a smaller BW than their actual BW (p<0.001) (Table 3).
Comparison of perceived body image and perceived body weight with actual body weight among skilled and unskilled participants, Nnewi, Nigeria, 2010
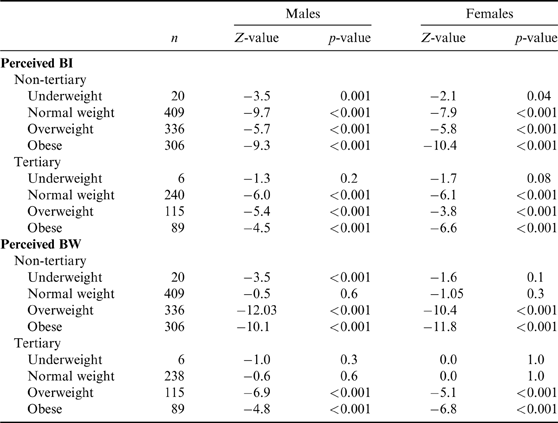
The ‘non-tertiary’ underweight (p=0.001) and normal-weight (p<0.001) males perceived a larger BI than their actual BW, whereas their overweight and obese counterparts perceived a smaller BI (p<0.001) (Table 4). The findings for the ‘tertiary’ males were similar to their ‘non-tertiary’ counterparts, except for the underweight category where the perceived BI was similar to the actual BW (p=0.2) (Table 4). For females, the findings for the ‘non-tertiary’ and ‘tertiary’ participants were similar to the findings for their ‘unskilled’ and ‘skilled’ counterparts, respectively, in the respective categories of actual BW (Table 4). The ‘non-tertiary’ males who were underweight perceived a larger BW than their actual BW (p<0.001), whereas their overweight and obese counterparts perceived the opposite (p<0.001) (Table 4). For the ‘tertiary’ males, those who were overweight (p=0.3) and obese (p=0.6) had similar perceptions to their ‘non-tertiary’ counterparts (Table 4). The ‘non-tertiary’ and ‘tertiary’ females who were overweight and obese had similar perceptions as their male counterparts (Table 4).
Comparison of perceived body image and perceived body weight with actual body weight among tertiary and non-tertiary educated participants, Nnewi, Nigeria, 2010
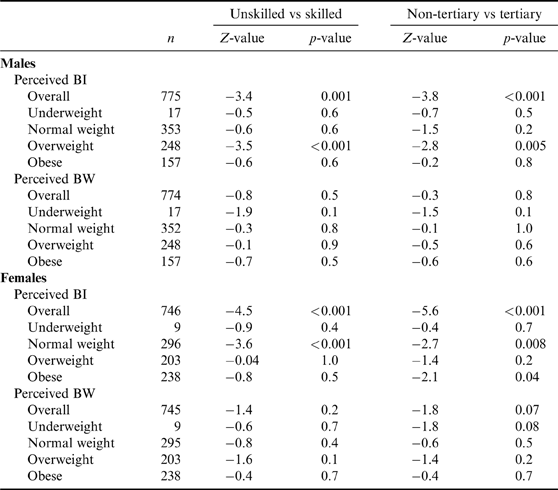
Table 5 shows that there were significant differences in perceived BI between the ‘skilled’ and ‘unskilled’ males (p=0.001) and females (p<0.001), and between ‘tertiary’ and ‘non-tertiary’ males and females (p<0.001). However, no significant difference existed in perceived BW between the categories of socioeconomic indices in males and females (Table 5). Narrowing down to specific BW categories, significant differences (p<0.001) existed in perceived BI between the ‘skilled’ and ‘unskilled’ overweight males and between the ‘skilled’ and ‘unskilled’ normal-weight females (Table 5). However, no significant difference existed in perceived BW between ‘skilled’ and ‘unskilled’ males and females in all BW categories (Table 5). Perceived BI differed significantly only between the ‘tertiary’ and ‘non-tertiary’ overweight males (p=0.005), and normal-weight (p=0.008) and obese (p=0.04) females (Table 5). The findings for perceived BW between the ‘tertiary’ and ‘non-tertiary’ males and females were similar to those between the ‘skilled’ and ‘unskilled’ males and females (Table 5).
Perceived body image and perceived body weight of participants by educational and occupational categories and their actual body weight, Nnewi, Nigeria, 2010
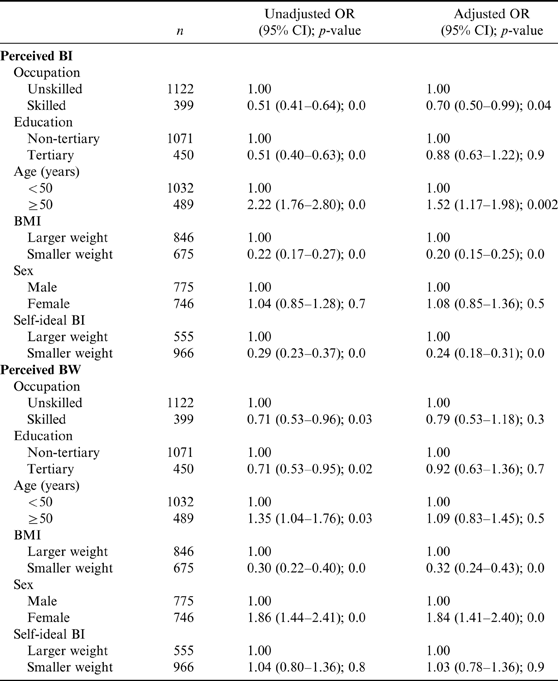
The ‘skilled’ had lower risks of perceiving a larger BI (OR 0.51, 95% CI 0.41–0.64; p<0.001) and larger BW (OR 0.71, 95% CI 0.53–0.96; p=0.03) than the ‘unskilled’ (Table 6). Similarly, the ‘tertiary’ had lower risks of perceiving a larger BI (OR, 0.51, 95% CI 0.40–0.63; p<0.001) and larger BW (OR 0.71, 95% CI 0.53–0.95; p=0.02) than the ‘non-tertiary’ (Table 6). After adjusting for the possible influence of age, sex, perceived ideal BI and BMI, all the risks became insignificant except for perception of BI by the ‘skilled’ (OR 0.70, 95% CI 0.50–0.99; p=0.04) (Table 6).
Odd ratios of participants perceiving larger body image and body weight by socioeconomic and demographic categories, Nnewi, Nigeria, 2010
Discussion
The main objective of this study was to investigate the association between socioeconomic status and perceptions of body image and body weight. Discrepancies were found in the perception of BI among ‘skilled’ and ‘unskilled’ males and females in all actual BW categories, except among the ‘skilled’ underweight, perhaps because analysis of this category was not possible due insufficient participants who were underweight. For the perception of BW, however, discrepancies occurred among the ‘unskilled’ males in underweight, overweight and obese BW categories, whereas among the ‘skilled’ males and the ‘skilled’ and ‘unskilled’ females, the discrepancies were in overweight and obese BW categories. Furthermore, discrepancies occurred in perception of BI among the ‘non-tertiary’ males and females in all actual BW categories, whereas among the ‘tertiary’ males and females they occurred in normal-weight, overweight and obese categories. The findings for the perception of BW among the ‘tertiary’ and ‘non-tertiary’ males and females were similar to those for the ‘skilled’ and ‘unskilled’ males and females, respectively. Perception of BI differed between the ‘skilled’ and ‘unskilled’ males, and between ‘tertiary’ and ‘non-tertiary’ males only in the overweight category, whereas it differed between the ‘skilled’ and ‘unskilled’ females only in the normal-weight category, and between the ‘tertiary’ and ‘non-tertiary’ females in the normal-weight and obese categories. However, perceptions of BW did not differ between the ‘skilled’ and ‘unskilled’ males and females, and between ‘tertiary’ and ‘non-tertiary’ males and females, in all BW categories. Only occupation is independently associated with the perception of BI.
The data suggest that, in general, normal-weight males and females in all educational and occupational categories perceived a larger BI, whereas their ‘skilled’ and ‘tertiary’ overweight and obese counterparts, as well as the ‘unskilled’ and ‘non-tertiary’ obese, perceived a smaller BI. In contrast to the findings for perception of BI, in all occupational categories, the male and female overweight and obese individuals tended to perceive a smaller BW than their actual BW. For educational categories, however, the discrepancies lie in underweight, overweight and obese BW categories. Generally, overweight and obese males and females in all educational and occupational categories perceived a larger BW than their actual BW.
Alwan et al. (Reference Alwan, Viswanathan, Williams, Paccaud and Bovet2010) reported that appropriate weight perception is directly associated with education and occupation. The findings for the perception of BI and BW in this study portend untoward health situations in the sense that normal-weight individuals who perceive themselves to be overweight or obese may embark on weight-reduction practices, which may lead them to become underweight. Similarly, an underweight individual who perceives themselves to be larger may not feel any need to put on weight, or may even embark on weight reduction practices, depending on the BW status he/she actually perceives. Furthermore, the overweight or obese individual who perceives a smaller BW is likely not to attempt to reduce their body weight to the normal range. These discrepancies will tend to make underweight individuals remain underweight, and may even lead to some normal-weight individuals becoming underweight and some obese individuals remaining obese, with a higher risk of throwing some overweight individuals into the obese category.
In conformity with the findings in this study, South African men and women have been reported to have inaccurate perceptions of their BW (Puoane et al., Reference Puoane, Steyn, Bradshaw, Laubscher, Fourie, Lambert and Mbanaga2002). These discrepancies in perception of BW have been linked to cultural peculiarities. Most black women believe that being overweight is desirable, but this belief is being compounded by the notion that being thin equates with HIV/AIDS infection (Puone et al., Reference Puoane, Bradley and Hughes2005). According to Mvo et al. (Reference Mvo, Dick and Steyn1999), an overweight body type symbolizes happiness, beauty, affluence, health and a negative HIV/AIDS status in South African society. This connotation of BW appears to originate in adolescence (Goedecke et al., Reference Goedcke, Jennings, Lambert, Steyn, Fourie and Jemple2006). In addition, educational attainment has been reported to be related to inaccurate perceptions of BW, with the least-educated women showing discrepancies between perceived and actual categories of BMI (Puone et al., Reference Puoane, Bradley and Hughes2005).
Although, in this study, there were differences in perception of BI between the ‘skilled’ and ‘unskilled’, and between the ‘tertiary’ and ‘non-tertiary’, males and females, these differential perceptions only existed in specific actual BW categories. Thus, the ‘skilled’ always perceived a smaller BI than the ‘unskilled’ in normal-weight females and overweight males, and the ‘tertiary’ always perceived a smaller BI than the ‘non-tertiary’ in normal-weight and obese females and overweight males. The influence of education on BI perception could be explained by the fact that education comes through learning. Learning is an individual process which leads to development. Furthermore, education fosters better perception of self and personal attributes through an already facilitated mental process from learning. Apart from abstract analysis of information, some background knowledge closely or remotely facilitates accurate judgement. It is therefore expected that, all things being equal, a better educated individual will judge or perceive an attribute more accurately. Indeed, differences in health literacy across educational groups have been reported (US Department of Health and Human Services, 2008). Individuals with higher education may have greater access to health information, and be more able to interpret and use information related to healthy weight compared with individuals with a lower education (Edwards et al., Reference Edwards, Jackson, Cheater, Holt and Robinson2009; Alwan et al., Reference Alwan, Viswanathan, Williams, Paccaud and Bovet2010). In addition, individuals with a higher education status tend to have a higher occupational status. This socioeconomic relationship, although not absolute, is far more likely than not, and this may explain the similar influence of the two socioeconomic indices on BI. In addition, despite the finding that there were overall differential perceptions of BW between the ‘tertiary’ and ‘non-tertiary’ females, this did not reflect in any actual BW category. This finding may suggest that even when there are differences in the perception of BW between the ‘tertiary’ and ‘non-tertary’ females in the general population, these differences may not exist at the individual level.
Associations were found between educational and occupational status, and perception of BI and BW. The findings changed, however, when age, sex, perceived ideal BI and BMI were included in the model, except for the association between the perception of BI and occupation. Some previous studies have reported similar findings (Paeratakul et al., Reference Paeratakul, White, Donald, Williamson, Ryan and Bray2002; Chang & Christakis, Reference Chang and Christakis2003; Kuchler & Vaiyam, Reference Kuchler and Variyam2003; Scchieman et al., Reference Schieman, Pudrovska and Eccies2007). However, Lynch et al. (Reference Lynch, Liu, Spring, Hankinson, Wei and Greenland2007) reported that judgments of perceived BI did not differ by socioeconomic status. Although a previous report has shown that the SES–obesity relationship is more apparent when using education and occupation as indicators than income (Cheung et al., Reference Cheung, Ip, Lam and Bibby2007), there remains some controversy concerning which of the three socioeconomic indicators is the most strongly associated with appropriate weight perception (Alwan et al., Reference Alwan, Viswanathan, Williams, Paccaud and Bovet2010).
The strength of this study is its population-based design and adequate sample size. The study involved a wide range of individuals from young adulthood to old age with about the same proportions of males and females. On the other hand, the cross-sectional design limits inference on the actual direction of the associations as to whether poor BI or BW perception, possibly a marker of poor cognitive skills, leads to poor socioeconomic outcomes or vice versa (Alwan et al., Reference Alwan, Viswanathan, Williams, Paccaud and Bovet2010). Although an overwhelming majority of the study's participants were of Christian faith, exclusion of the non-Christian minority may limit interpretation of the findings. Furthermore, the participants were Christians who attended church services; this characteristic of the participants may limit extrapolation to all Christians in the population. In addition, in this study sample, which is mainly of Igbo ethnic group, the idea of desirable BW may vary with age of the individuals involved. According to Maruf et al. (Reference Maruf, Akinpelu and Nwankwo2012), young females in this population consider a slim BW as more desirable than a larger BW, whereas young males prefer a larger BW, perhaps of muscular build. However, adults, especially the married ones who are no longer searching or wooing a suitor or bride, are usually less concerned or conscious about their BW, and may not even be aware of their actual BW. In fact, larger BW in women is generally seen as evidence that her husband takes care of her (Puone et al., Reference Puoane, Bradley and Hughes2005). Larger BW could also be perceived to reflect affluence and happiness (Mvo et al., Reference Mvo, Dick and Steyn1999). Furthermore, educational attainment is another factor that could limit the findings in this study. Educational attainment has been reported to be related to inaccurate perceptions of BW, with the least educated women showing discrepancies between perceived and actual categories of BMI (Puone et al., Reference Puoane, Bradley and Hughes2005). Men and women with most education in developing societies have been reported to be heavier than their peers (Sobal & Stunkard, Reference Sobal and Stunkard1989).
In conclusion, the underweight and normal-weight males and females in all educational and occupational categories perceive a larger BI, whereas their overweight and obese counterparts perceive a smaller BI. There are discrepancies in perception of BI in normal-weight, overweight and obese categories, whereas discrepancies in perception of BW only occur in overweight and obese categories, in all educational and occupational categories. There are differential perceptions of BI between the ‘skilled’ and ‘unskilled’ in normal-weight females and overweight males, and between the ‘tertiary’ and ‘non-tertiary’ normal-weight and obese females and overweight males. Occupational status is independently associated with perception of BI.
Acknowledgments
The authors would like to thank the participants in the study for their contribution to this research. They also thank the undergraduate students who volunteered as research assistants and the authorities of the churches where the data were collected for their assistance and support.