Introduction
Ultra-fine iron powder (UFIP) with a range size of 0.1–1 μm [Reference Morimoto and Shakouchi1] has been widely investigated in recent decades [Reference Gao, Arunagiri, Chen and Chyan2]. More than 20% of UFIP has been applied to automobile manufacturing [Reference Fujiki3], which requires more than 3000 t/a. Food added to prevent iron deficiency is another huge market for UFIP powder [Reference Brittenham, Klein, Kushner and Ajioka4]. FDA already approved one of these kinds of products from International Special Products® (New Jersey). It is forecasted that the application requirement is over 1000 t/a. The excellent magnetic properties of UFIP also bring wide application potential in magnetic materials areas such as recording, separation, magnetic fluid, and health care [Reference Gutfleisch, Willard and Bruck5, Reference Carpenter6, Reference Bumb, Brechbiel, Choyk, Fugger, Eggeman, Prabhakaran, Hutchinson and Dobson7]. Microwave absorption is one of the other functions of UFIP, which proves feasible on high-speed aircraft [Reference Kong, Liu, Liu, Huang, Abshinova, Yang, Tang, Tan, Deng and Matitsine8].
UFIP synthesis by a low-cost route with high production efficiency is needed to satisfy the market demands. The current synthesis routes include the ball milling method [Reference Fultz, Robertson, Stephens, Nagel and Spooner9], vacuum evaporation [Reference Abhilash, Saini and Kabiraj10], and sprays [Reference Mates, Ridder, Biancaniello and Zahrah11]. Most commercializable techniques use the carbonyl method with a production of more than 90% UFIP each year. Fe(CO)5 is synthesized and decomposed within a precisely controlled temperature range to obtain UFIP within the required size range. However, the high toxicity of Fe(CO)5 and complex decomposing furnaces incur high cost and thus limit further application of the carbonyl method.
The reduction of iron oxides is a comparably simple, nontoxic, and low-cost alternative. However, the lack of amounts of low-cost iron oxide powder with appropriate particle size impedes the synthesis of UFIP by the reduction route. Flame aerosol synthesis (FAS) is a one-step synthesis of a high-purity material with precise control over the particle size and composition [Reference Strobel and Pratsinis12]. This process especially stands out because of its scale-up capability providing tens or even hundreds of grams per minute of SiO2 [Reference Kammler, Beaucage, Kohls, Agashe and Ilavsky13, Reference Tani, Madler and Pratsinis14], TiO2 [Reference Pratsinis, Zhu and Vemury15, Reference Johannessen, Pratsinis and Livbjerg16], ZrO2 [Reference Gröhn, Pratsinis, Sánchez-Ferrer, Mezzenga and Wegner17], and SnO2 [Reference Bakrania, Perez and Wooldridge18, Reference Bakrania, Miller, Perez and Wooldridge19]. Iron oxide powders with different sizes, structures, and compositions are also synthesized by the FAS method [Reference Li, Teoh, Selomulya, Woodward, Amal and Rosche20, Reference Zhao and Gao21, Reference Grimm, Schultz, Barth and Muller22, Reference Strobel and Pratsinis23, Reference Rao and Zheng24, Reference Starsich, Sotiriou, Wurnig, Eberhardt, Hirt, Boss and Pratsinis25].
In this study, we synthesized nano-size iron oxide powder and heat treated in a reduction atmosphere to obtain pure iron powder. By adjusting the reduction heat treatment parameters, we have established a size-controllable UFIP synthesis route with low cost and high production efficiency. Research on the reduction reaction mechanism delineates a guideline to customize synthesis parameters to meet different marketing demands.
Results
FAS
All of the as-synthesized powders with different precursor concentrations have an α-Fe2O3 main phase with a small amount of γ-Fe2O3, as shown in Fig. S1. The α-Fe2O3 is the most stable phase in the Fe–O system at high pO2 and high temperature, which is consistent with the FAS method. The crystallite size of the α-Fe2O3 calculated from X-ray diffraction (XRD) shows almost the same values among the three powders (41.2, 39.8, and 40.2 nm).
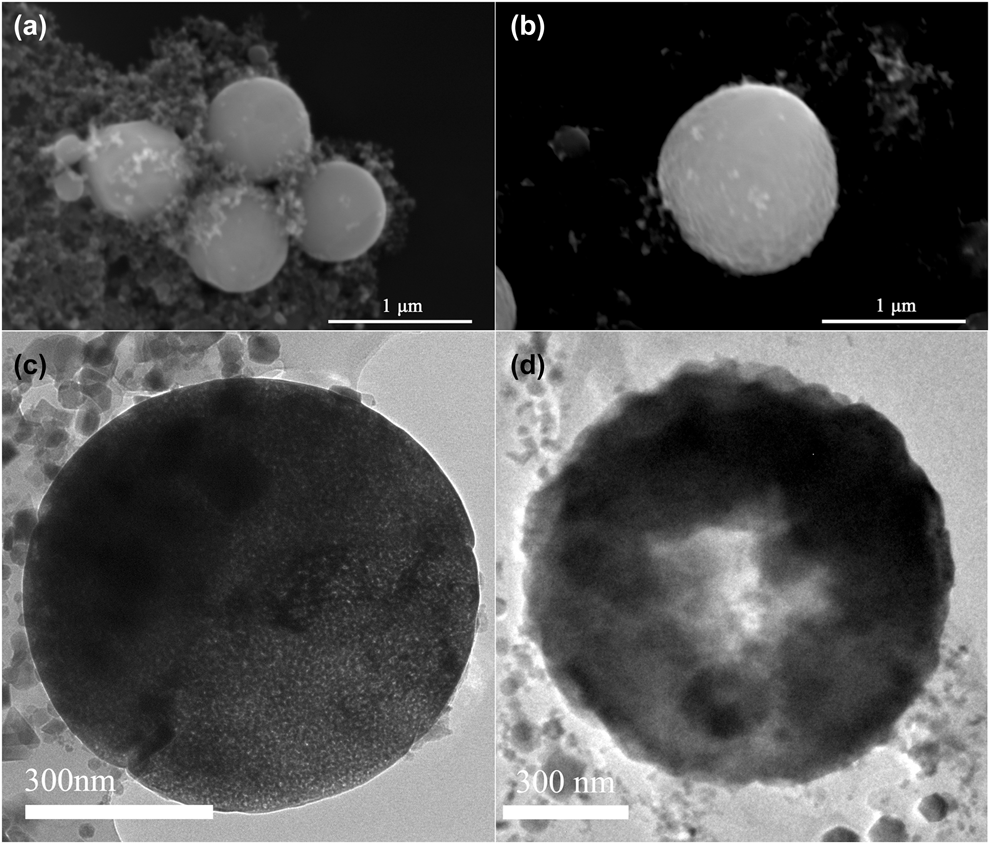
Figures 1(a) and 1(b) show that the as-synthesized powder has a sphere microstructure with a smooth surface. When the sphere diameter is less than 650 nm, it is usually a solid ball, as shown in Fig. 1(c). However, if the diameter is more than 650 nm, the sphere is hollow, as shown in Fig. 1(d). It reveals that beyond the liquid fed, gas fed also exists during the FAS process [Reference Li, Ren, Biswas and Tse26]. Furthermore, the thickness of the hollow sphere among different precursor concentrations does not appear proportional to the concentration, which varied from 250–400 nm.
The microstructure images of as-synthesized powder with 0.3 M concentration at 600 °C for 1 h. (a) and (b) SEM images; (c) and (d) TEM images.

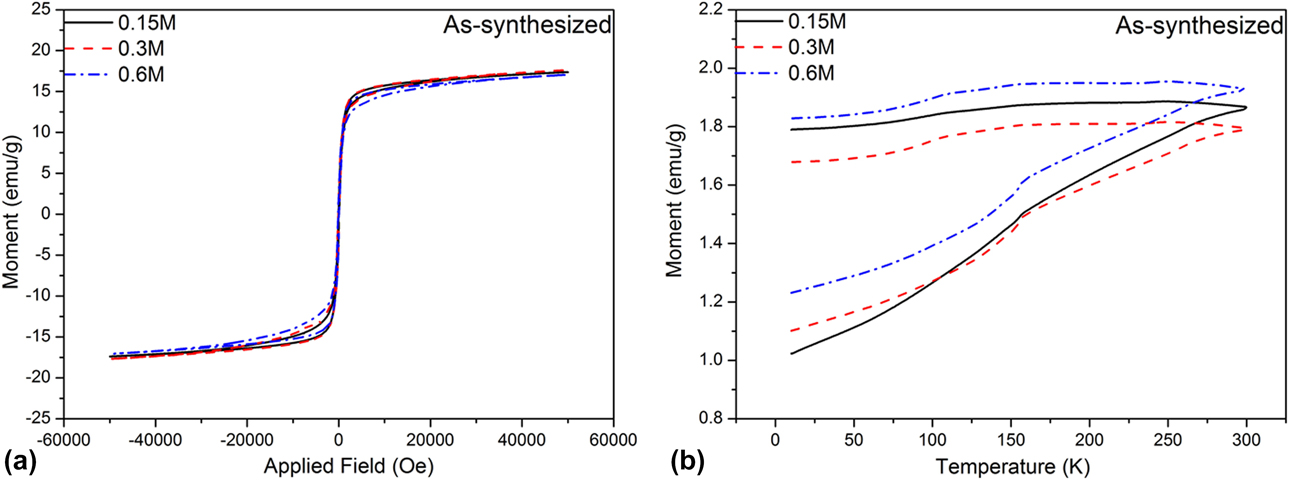
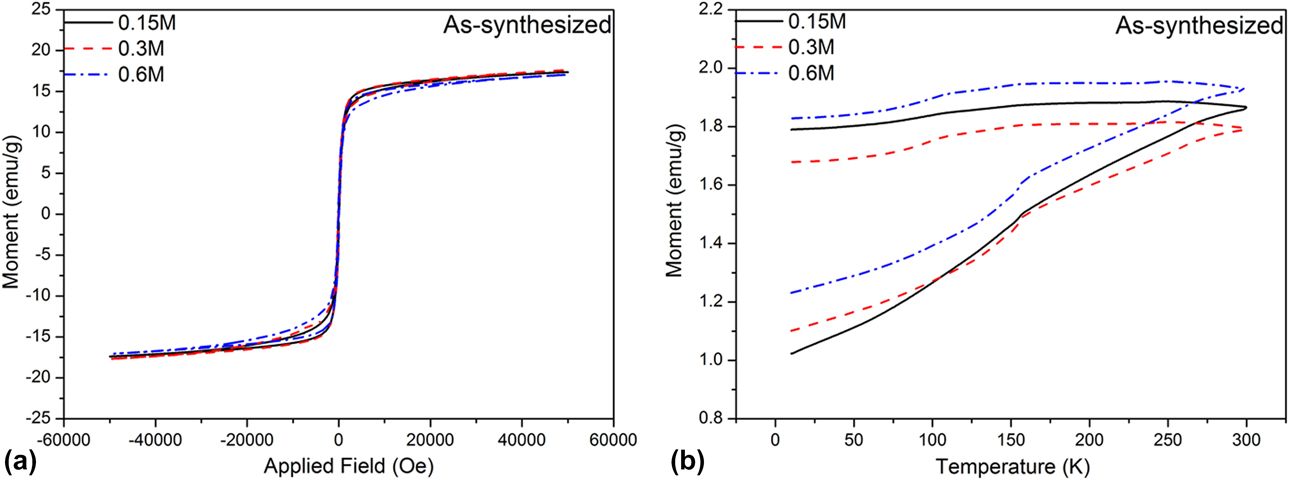
Figure 2 shows the magnetic properties of the as-synthesized powders with different precursor concentrations. All the powders show low saturation magnetization (around 17 emu/g) with pretty low coercive force and remanence. This corresponds to a mixture between the low magnetic phase α-Fe2O3 (antiferromagnetic) and a small amount of high magnetic phase γ-Fe2O3 (ferromagnetic). The zero-field-cooled (ZFC) curve shows a continuous decrease in magnetization with no difference among all three powders, which agrees with the antiferromagnetism of α-Fe2O3.
The magnetic properties of as-synthesized powder with different precursor concentrations. (a) Magnetic hysteresis loop; (b) ZFC and FC curve.
Investigation of reduction temperature
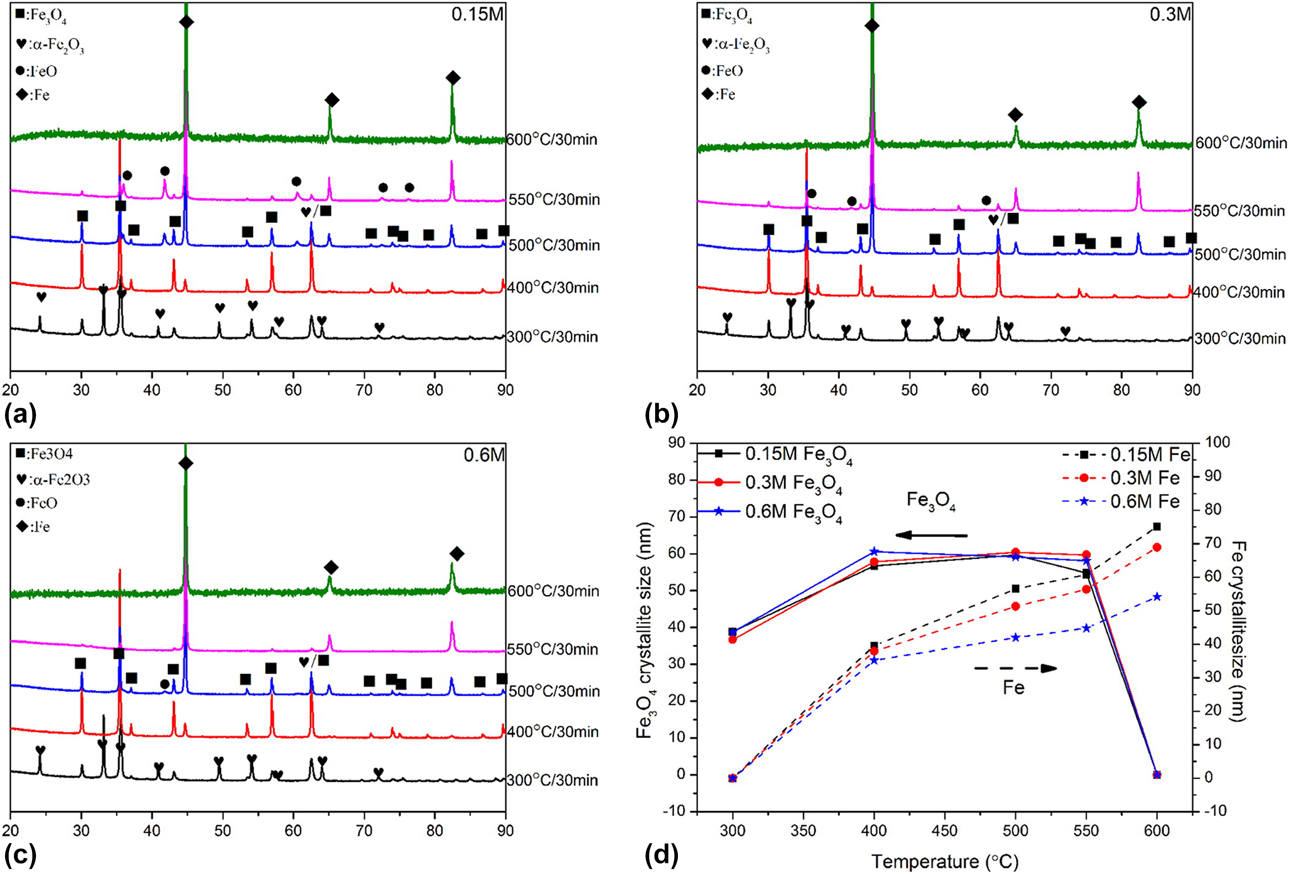
Figures 3(a)–3(c) show the XRD results of the powder after the reduction of heat treatment at different temperatures. All the powders with different precursor concentrations undergo the reduction synthesis of Fe2O3–Fe3O4–FeO–Fe. At 300 °C, the primary phase is still α-Fe2O3, and Fe3O4 has replaced γ-Fe2O3 as the second phase. When the temperature reaches 400 °C, all the Fe2O3 phases convert to Fe3O4. At the same time, a small amount of Fe phase appears. The Fe and Fe3O4 match each other in strength at the temperature of 500 °C, while the intermediate phase FeO exists. As the temperature increases to 550 °C, the Fe dominates the phase formation with very little Fe3O4 and FeO. The 0.15 M powder has more FeO phase which indicates a slower reduction process. Finally, all the powders are pure Fe after holding 30 min at 600 °C.
The XRD patterns of the powder after reduction at different temperatures, (a) 0.15 M; (b) 0.3 M; (c) 0.6 M; (d) The crystallite size calculated from XRD results of the phase Fe3O4 and Fe in different powders.
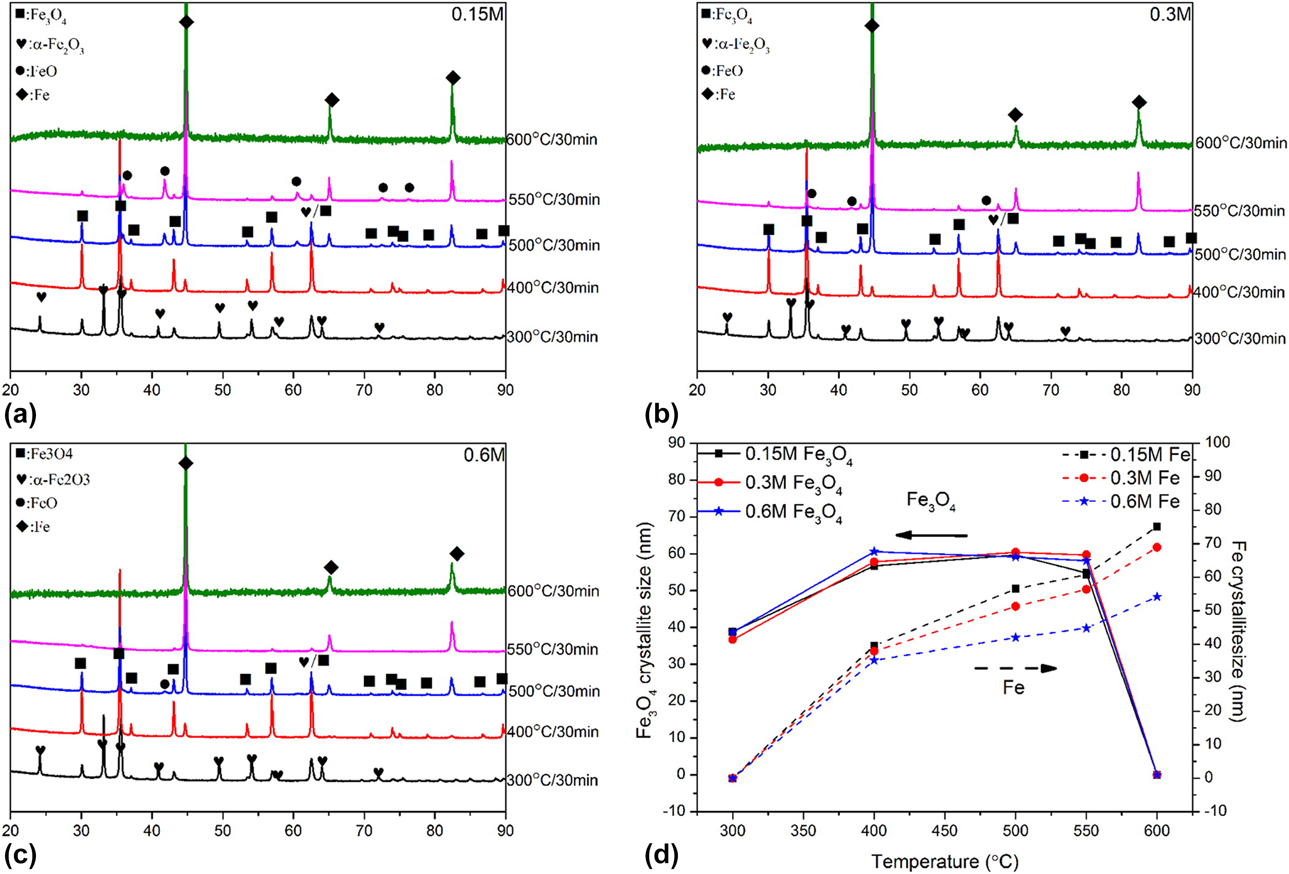
Figure 3(d) shows the calculated crystallite size of Fe3O4 and Fe phase in the powders with different precursor concentrations after reduction at different temperatures. At 300 °C, the Fe3O4 crystallite sizes appear approximately equal to that of as-synthesized powder α-Fe2O3 (around 40 nm). As temperature increases to 400 °C, the Fe3O4 crystallite sizes grow to 60 nm. This value stays until Fe3O4 is fully reduced to Fe at 550 °C. There is barely any difference in the Fe3O4 crystallite size among the powders with different precursor concentrations at all temperatures. The Fe crystallite size keeps growing when the temperature is increasing for all the powders. At the born stage of Fe at 400 °C, the crystallite sizes of the powders with three concentrations are nearly the same. However, the size of 0.15 M powder has a much higher growth rate than 0.6 M.
The crystallite size evolution elaborates on the reduction process from Fe2O3 to Fe. At 300 °C, as the conversion from Fe2O3 to Fe3O4 starts, only a few Fe3O4 grains nucleate among the Fe2O3 grains. So the crystallite size of Fe3O4 is the same as that of Fe2O3. The crystallite size will increase 1.5 times when the Fe3O4 is sufficiently reduced from Fe2O3 at 400 °C. This is because the lattice parameter of Fe3O4 (8.89 nm) is nearly 1.5 times larger than α-Fe2O3 (5.42 nm). Because the crystallite size does not increase anymore, it can be concluded that during the entire reduction process, all new Fe3O4 grains only form based on individually existing Fe2O3 grains but without any further growth or merges. By contrast, the Fe grain size keeps growing, which indicates the continuous growth and merges of Fe grains take place with the increasing temperature.
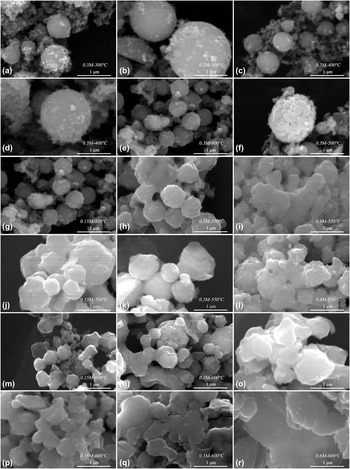
Figure 4 shows the microstructure of powders with different precursor concentrations after reduction at different temperatures. At 300 and 400 °C, the sphere in all three powders is the same as the synthesized ones with a smooth surface no matter whether solid or hollow, as shown in Figs. 4(a)–4(d). The invariant microstructures also agree with our analysis that Fe3O4 only formed based on the existence of Fe2O3 grains. Because the grain structure does not change much, there is no apparent microstructure variation. As the temperature reaches 500 °C, Fe starts to widely nucleate. The solid sphere still does not have an apparent microstructure change, as shown in Fig. 4(e). However, hollow spheres bloom like a rose. Each “petal” is an Fe nucleus reduced from a Fe3O4 “flower,” as shown in Fig. 5(f). Until now, the reduction process is still synchronous among powders with three concentrations, without any difference in the microstructures, as shown in Fig. S2.
(a)–(f) SEM images of the powder of 0.3 M precursor concentration after reduction with different temperatures: (a) and (b) 300 °C; (c) and (d) 400 °C; (e) and (f) 500 °C; (g)–(r) SEM images of the powder with different precursor concentrations after reduction at different temperatures: (g) and (J) 0.15 M at 550 °C; (h) and (k) 0.3 M at 550 °C; (i) and (l) 0.6 M at 550 °C; (m) and (p) 0.15 M at 600 °C; (n) and (q) 0.3 M at 600 °C; (o) and (r) 0.6 M at 600 °C.

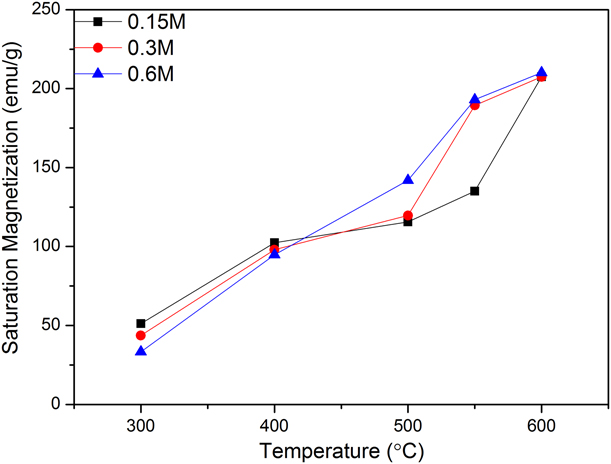
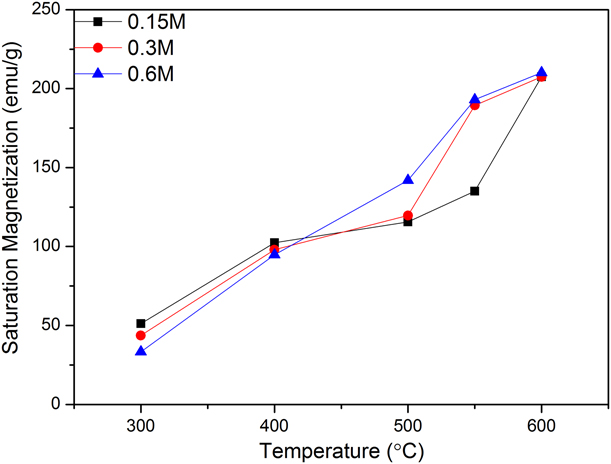
The plot of the saturation magnetization with the heat treatment temperature of powders with different precursor concentrations.
When the temperature reaches 550 °C, the powders with three different concentrations have their own road. In the 0.15 and 0.3 M powder, the solid sphere keeps smooth and independent [Figs. 4(g) and 4(h)], but they start to sinter in the 0.6 M sample [Fig. 4(i)]. For the bloomed hollow sphere, part of them starts to lose the sphere shape and decompose to Fe platelike particles, as shown in Figs. 4(j)–4(l). In the 0.6 M powder, these platelike particles also partially merge. After heat treatment at 600 °C for 30 min, even in the low concentration powder, the solid spheres start to sinter, i.e., the sintering neck is apparent in the 0.3 M sample, as shown in Figs. 4(m)–4(o). The platelike Fe grains in all three powders merged but to a different degree. The sintering neck is still evident in the 0.15 M powder [Fig. 4(p)], and only the edge of the platelike grain can be found in 0.3 M [Fig. 4(q)]. All the grains ultimately sinter into large particles with the size of few micrometers [Fig. 4(r)].
In the reduction step from Fe2O3 to Fe3O4, the precursor concentration does not have any conspicuous effect on the microstructure. The concentrations only work in the formation of Fe. The higher the concentration, the more Fe grains are prone to merge into big particles.
After reduction at all temperatures—even at 300 °C—all the powders have higher saturation magnetization than poor magnetic properties of the as-synthesized powder. The coercive force and remanence also decrease to near zero even from reduction at 300 °C, which shows the superparamagnetism of powders after reduction. The saturation magnetization values are a plot with temperature, as shown in Fig. 5. It can be found that the low concentration powder has a higher value at 300 °C but a lower one at 500–550 °C. This is ascribed to the differences in phase formation. The low-concentration powder has more Fe3O4 at 300 °C and more FeO around 500–550 °C. The former can increase the magnetic properties, but the later has a negative effect. Nevertheless, after heat treatment at 600 °C for 30 min, all three powders reach the saturation magnetization of 208 emu/g, which is very close to the bulk value of pure iron (220 emu/g). This indicates that our product UFIP has enough high magnetic properties for applications requiring high magnetic properties such as separation, recording, etc. Although the powders with different concentrations heat treated at 600 °C for 30 min have different microstructures, the saturation magnetizations are nearly the same. This indicates that Fe grain growth or merging barely has any effect on the magnetic properties.
The ZFC and field-cooled (FC) curves of powders with different precursor concentrations after reduction at different temperatures have the same trend and split at room temperature. These figures are not shown here because of the page limitation. This indicates that although the powder is superparamagnetic, the particle size is so big that the blocking temperature (T b) is higher than room temperature. The ZFC at curve 300 °C has a similar shape with the as-synthesized one but with a transition around 120 K, which is the Verwey transition of Fe3O4 [Reference Seo, Ogata and Fukuyama27]. The transition is sharper in the low concentration powder than in the 0.6 M powder, which coincides with the discovery of more Fe3O4 phase shown in XRD results and higher saturation magnetization. The Verwey transition is as sharp as a cliff at 400 °C and becomes eventually gentle as the temperature continues to rise, showing the phase transformation from Fe3O4 to Fe. Although the 0.15 M powder has more FeO than others at 500 and 550 °C, there is not any significant difference in either ZFC or FC curves. At 600 °C, the ZFC and FC are nearly flat lines with small degradation on the magnetization which indicates the ferromagnetic symbol.
Effect of holding time
600 °C for 30 min is good enough to get pure Fe particles with high magnetic properties. However, Fe particle size growth needs to be eliminated. How to get high magnetic properties but circumvent growth and merge of Fe particles is the key to acquire UFIP with controllable particle size. Commonly, longer holding time at lower temperature can substitute for shorter time of higher temperature, so different holding times at 550 °C have been investigated.
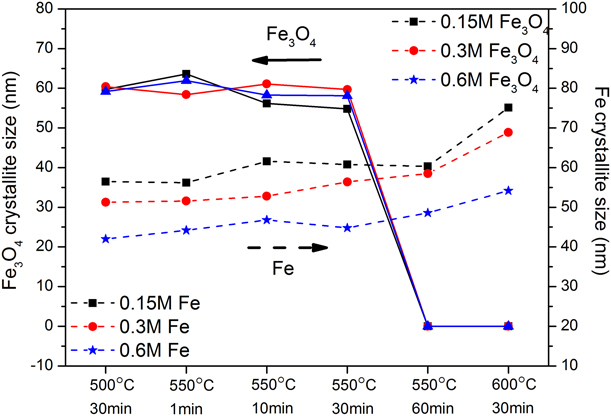
Figure S3 shows the XRD patterns of the powder after reduction with different holding times at 550 °C. The lower concentration powder has more FeO as the second phase from a holding time of 1 min but does not have an effect on the final reduction results. All the powders get pure Fe phase after holding 60 min at 550 °C, which validates that the extension holding time of lower temperature can substitute for the shorter time at higher temperature. Figure 6 shows the calculated crystallite size of Fe3O4 and Fe of the powder with different precursor concentrations after reduction with different periods of holding time at 550 °C, including the size after 500 °C for 30 min and 600 °C for 30 min. The crystallite sizes of both Fe3O4 and Fe are not affected by extending the holding time. The Fe crystallite size after 550 °C for 60 min is around 15% smaller than the value of 600 °C for 30 min.
The crystallite size calculated from XRD results of phase Fe3O4 and Fe in different powders.
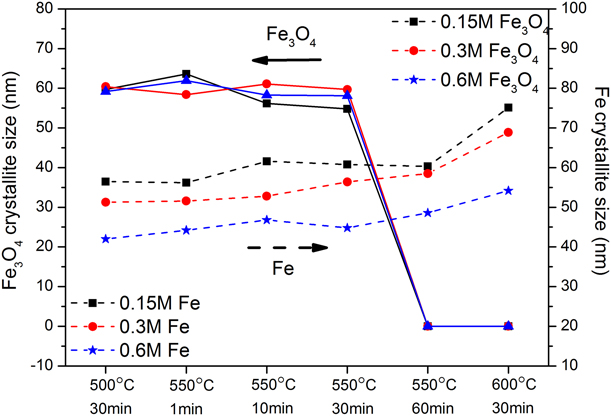
Figure S4 shows scanning electron microscopy (SEM) images of the powder of different precursor concentrations after reduction at 550 °C for 60 min. Compared with the SEM image of 600 °C for 30 min [Figs. 4(m)–4(r)], all three powders show much slighter merge phenomena. Even in the 0.6 M powder, the edges of the platelike grains are still visible, as shown in Fig. S4(f). The microstructure results reiterate that the extended holding time at low temperature inhibits the merging.
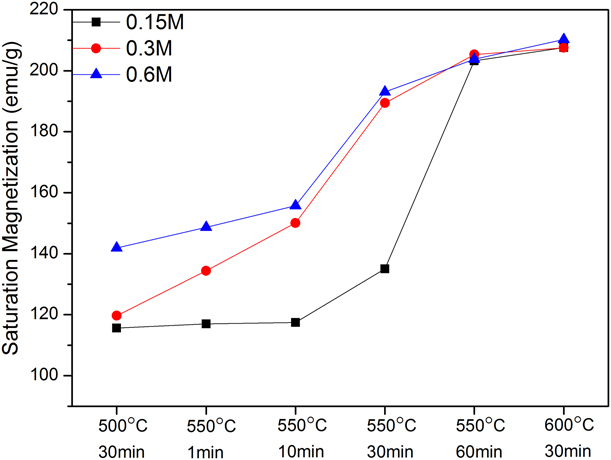
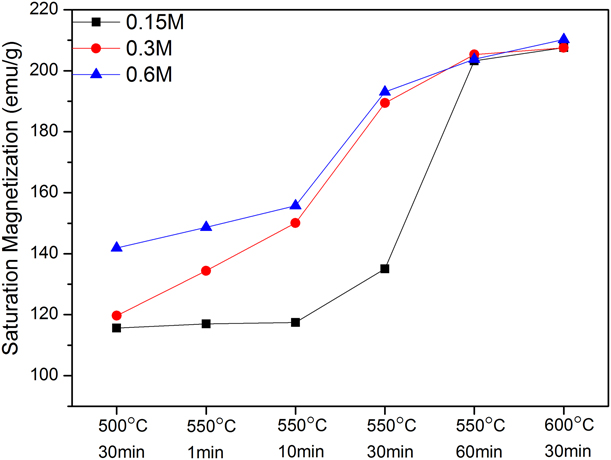
Figure 7 shows the moment evolution of the powder with different concentrations after reduction with different periods of holding time at 550 °C, including the value of 500 °C for 30 min and 600 °C for 30 min for comparison. The low-concentration powder has lower saturation magnetization within a shorter holding time with the saturation magnetization of 0.15 M holding for 10 min is 50% lower than 0.6 M. This is also ascribed to the existence of an antiferromagnetic phase FeO. The effect of FeO on the magnetic properties is also proved by ZFC and FC magnetic hysteresis loop at 10 K, as shown in Fig. S5. The horizontal shift of the hysteresis loop shows the exchange bias caused by the interaction between the phases of ferromagnetic (Fe) and antiferromagnetic (FeO) [Reference Ohldag, Scholl, Nolting, Arenholz, Maat, Young, Carey and Stöhr28]. Eventually, after holding at 550 °C for 60 min, the saturation magnetization of all three powders reaches the value of 204 emu/g, which is about the same as the powder reduced at 600 °C for 30 min. The ZFC and FC curves are also measured. The gradual disappearance of the Verwey transition with the extended holding time is due to the reduction from Fe3O4 to Fe.
The plot of the saturation magnetization with the heat treatment temperature of powders with different precursor concentrations.
Discussion
To determine the mechanism of the reduction reaction of the sphere synthesized by the FAS method, the average particle size and size distribution under different heat treatment conditions have been measured for the entire evolution process of these spheres from Fe2O3 to Fe.
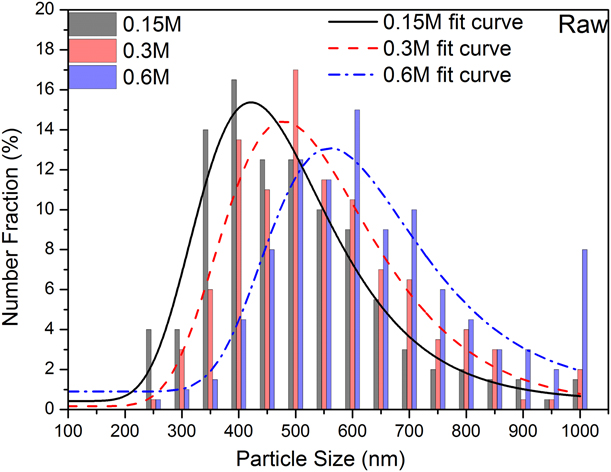
The particle sizes of the as-synthesized powder with different precursor concentrations have been determined, and the size distributions are shown in Fig. 8. All three powders have a normal distribution in size, except the 0.6 M powder. The 0.6 M powder has an abnormal increase in the amount of particle over 1000 nm. Of note, although the precursor concentration exponentially grows (0.15, 0.3, and 0.6 M), the average crystallite sizes, which are 538.67 ± 170.98 nm, 577.74 ± 161.43 nm, and 688.12 ± 211.42 nm, respectively, only increase by less than 30%. Combined with nearly the same thickness, it is concluded that the volumes of the spheres from the three powders are disproportionate to their precursor concentrations. However, the product mass of these powders is proportional (0.96, 1.76, and 3.9 g, respectively). So the only trick is the density of these spheres.
The particle size distribution of the as-synthesized powders with different precursor concentrations.
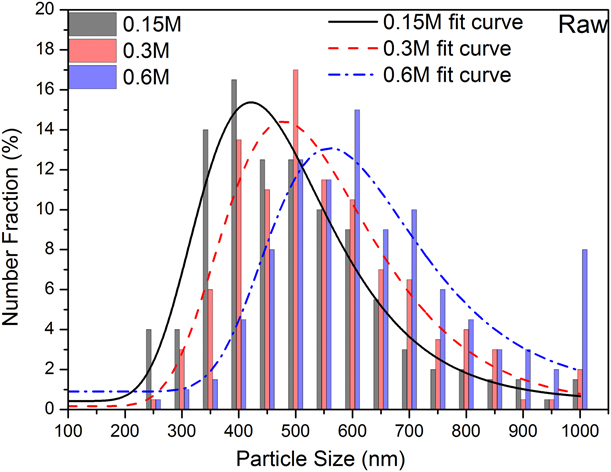
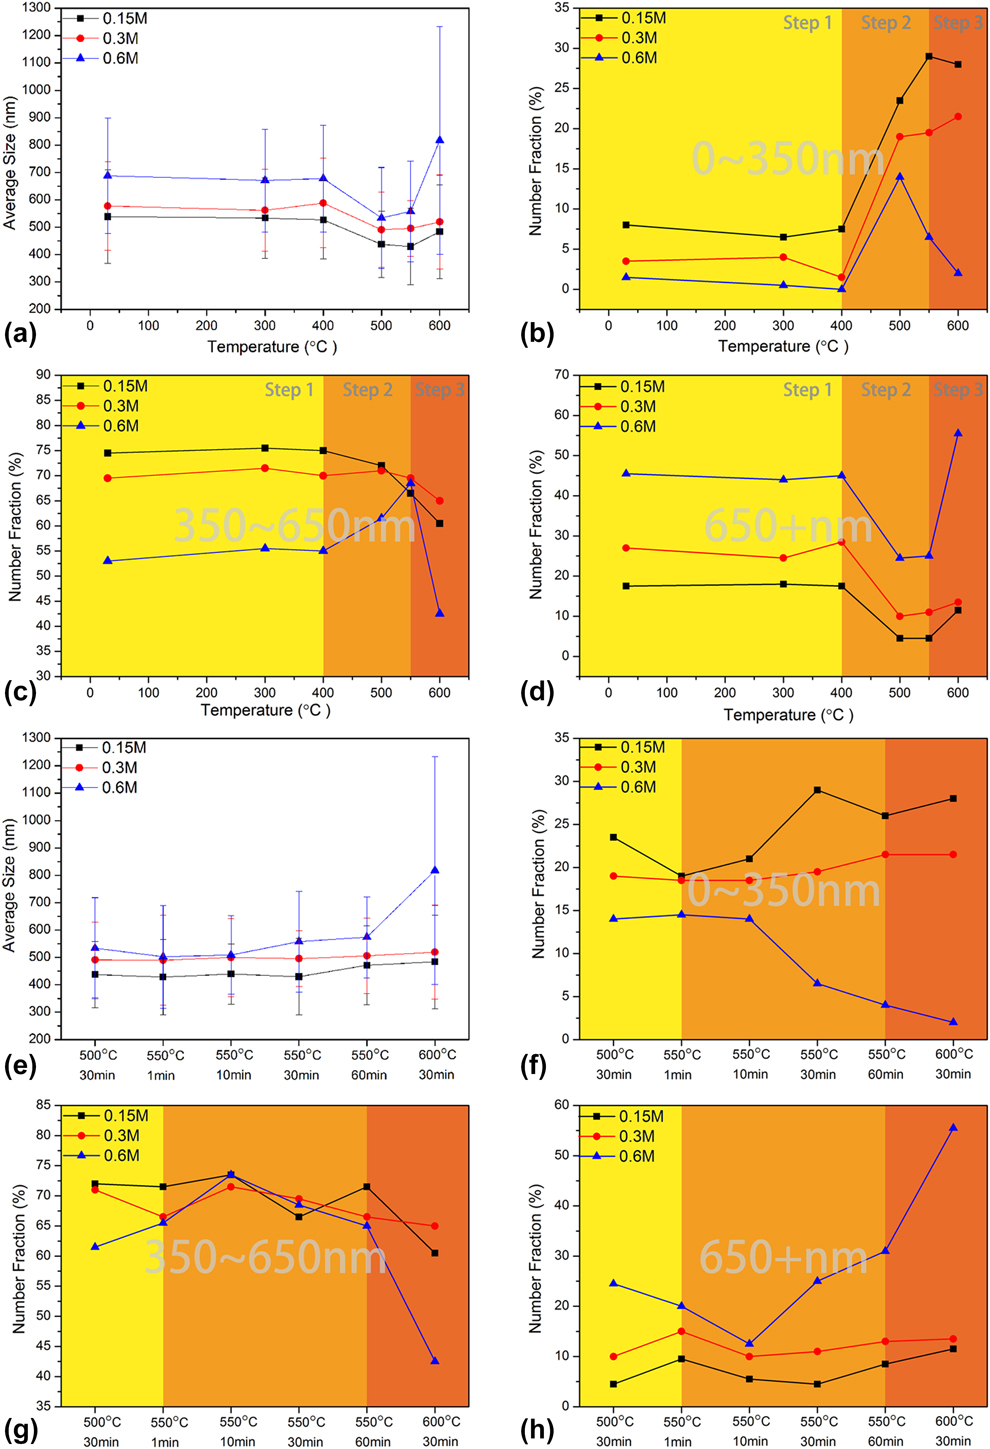
Figure 9(a) shows the average particle size of the powders with different precursor concentrations after reduction at different temperatures. All three powders have the same trend on the size variation. The average size stays constant up to 400 °C which is in line with the invariant microstructure shown in Figs. 4 and S3. At the step of 500–550 °C, the average size decreases by more than 15%, followed by a dramatical rebound at 600 °C. The rebound amplitude in the 0.6 M powder is so conspicuous that the final average particle size exceeds the pristine value. Along the temperature axis, the whole process can be divided into three steps, including step 1 (≤400 °C), step 2 (400–550 °C), and step 3 (≥550 °C).
(a) The average particle size of the powder after reduction at different temperature for 1 h; (b)–(d) The statistical results of the particle size in different regions of the powder after reduction at different temperature (b) less than 350 nm; (c) 350–650 nm; (d) over 650 nm; (e) The average particle size of the powder after reduction with different holding times at 550 °C; (f)–(h) The statistical results of the particle size in different regions of the powder after reduction with different holding times at 550 °C (f) less than 350 nm; (g) 350–650 nm; (h) over 650 nm.
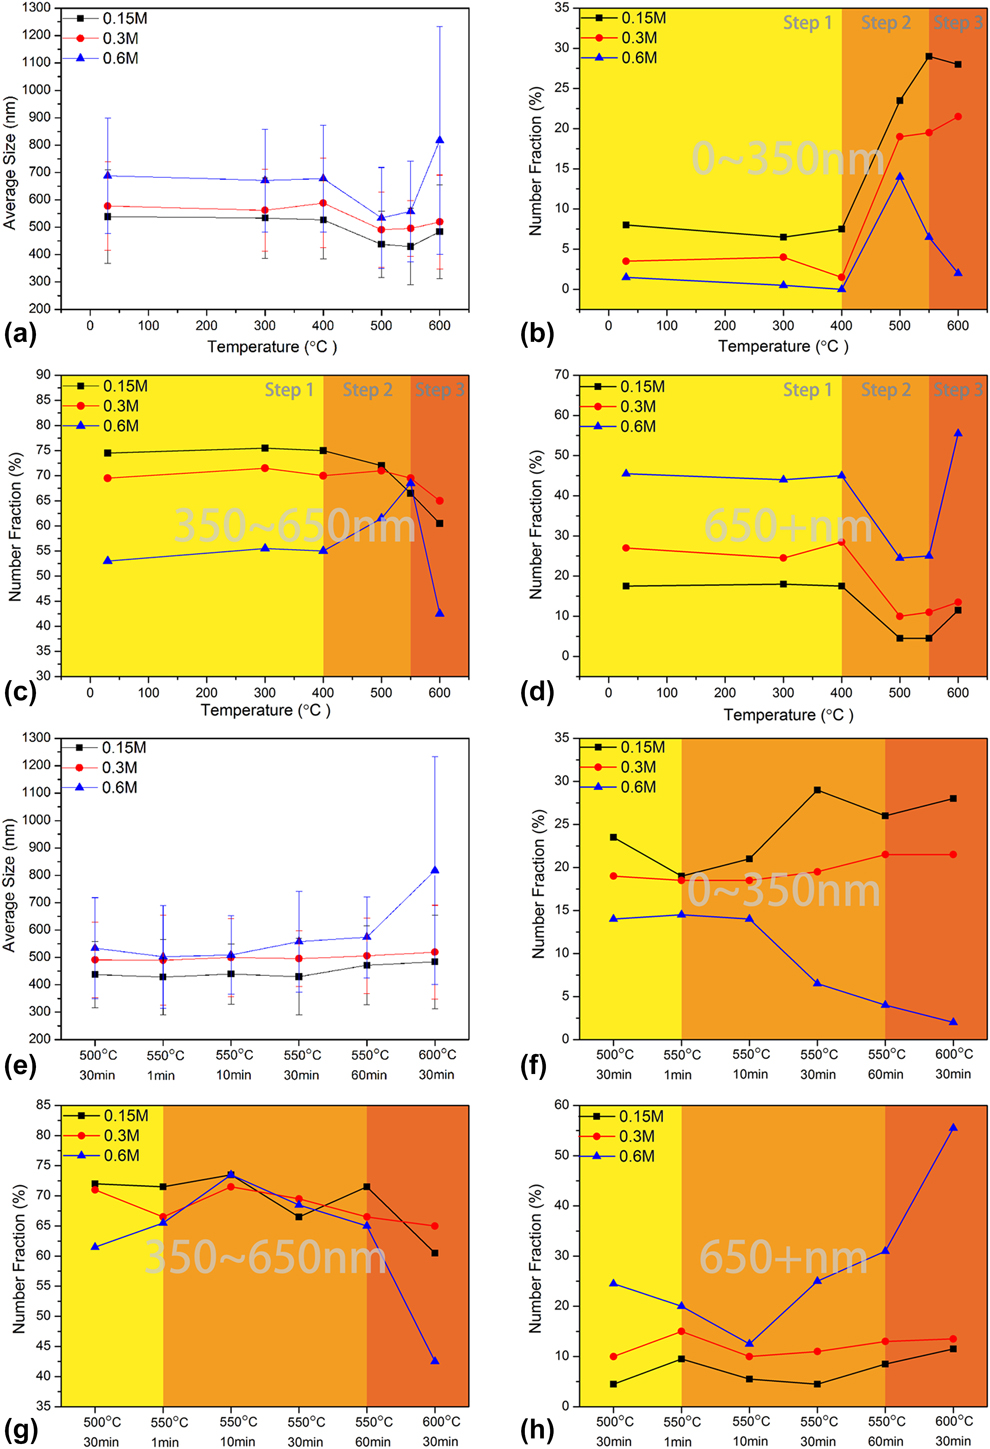
The particle size distributions of three powders at each individual temperature are plotted in Fig. S6. Nearly all the particle distributions fit normal distributions except the 0.6 M powder reduced at 600 °C. To understand the microstructure evolution of the powders with different precursor concentrations, the particle distributions are divided to three ranges based on the size, which are small (less than 350 nm), medium (350–650 nm), and large (over 650 nm), as shown in Figs. 10(b)–10(d). After plotting the number fractions in three size ranges as a function of temperatures, the tendency is much clearer. The particles in three size ranges of all the powders have no changes at step 1, and all the variations occur in steps 2 and steps 3. This restates our conclusion that Fe3O4 is only formed based on the existing Fe2O3 without any further merging.
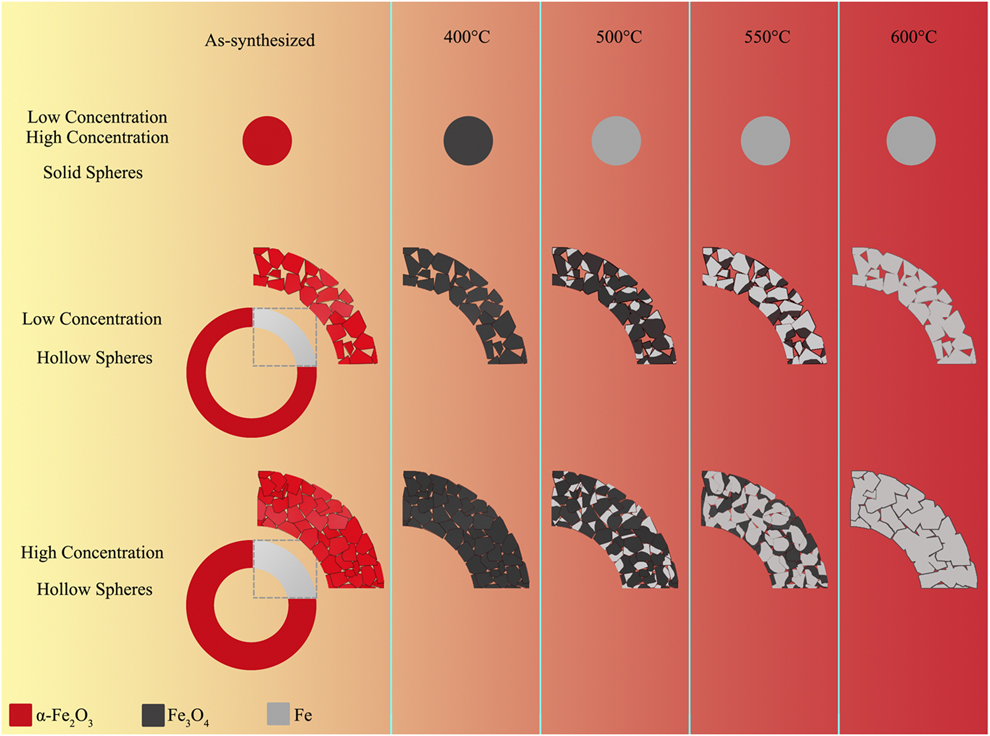
The reduction reaction model of the sphere with different precursor concentrations synthesized by FAS.

There are barely any small particles at step 1, especially in the high-concentration powder (0.6 M). However, the fractions of the small size climb up at step 2. At step 3, the three curves with different concentrations split. The 0.15 and 0.3 M powders keep the same values as at the end of step 2, but the fractions drop back to near zero in the 0.6 M powder. As shown in the distribution of as-synthesized powders, there are barely any small particles after the synthesis of FAS, so the number fraction is very low. During step 2, the Fe nucleation causes the bloom of the hollow sphere and thus brings a lot of small particles.
For the medium size particles, there is no significant fluctuation of the 0.15 and 0.3 M powders only with a slight decrease at step 3. The medium size fraction of 0.6 M powder has a trend rise and drop like a roller coaster in step 2 and step 3. The medium size particles mostly correspond to those solid spheres. However, the decomposition particles for the hollow spheres over one micrometer are also in this size range (350–650 nm). Because only 0.6 M has more significant particles with over one micrometer, naturally, there will be fluctuation in the number fraction of medium size particles.
The large size fraction plot has the same trend as the average particle size plot. All the powders show a decrease at step 2 but rebound at step 3, which the 0.6 M powder rising the most. Combined with the plots for the three size ranges, it can be concluded that all the changes in the particle size are related to the hollow spheres. When small Fe particles nucleate on large hollow spheres in step 2, the large particle decomposes to a small or medium size. As the temperature reaches as at step 3, small Fe platelike particles merge to large ones again, leading to the decrease in small particles and increase in large ones. The variation degree in powders with different concentrations reflects the different merge degrees, which can be seen in the microstructure evolution shown in Fig. 4.
Figure 9(e) shows the average particle size of the powders with different precursor solutions after reduction heat treatment with different periods of holding time at 550 °C. The value of 500 °C for 30 min and 600 °C for 30 min added for comparison. The average crystallite size remains flat in all three powders along with the increase in the holding time, and only the 0.6 M powder has a little rise when the holding time reaches 60 min. Although 550 °C for 60 min has similar phase formation and magnetic properties as 600 °C for 30 min, the average size is radically different, especially for the 0.6 M powder. The particle size distributions of the three powders at each particular time are also plotted in Fig. S7. The same analysis on the different size ranges is also shown in Figs. 9(f)–9(h). It can be seen that the number fraction in three size ranges remains constant in 0.15 and 0.3 M, which shows there is barely any further Fe merging up to the 60 min holding time. In the 0.6 M, partial merging still occurs; however, it is much less than the 600 °C for 30 min.
The reduction reaction model is established, and the sketch map is as shown in Fig. 10. From the results and analysis aforementioned, the solid spheres within a size range of (350–650 nm) are the same for all the concentrations. It has a rather simple reduction with only the phase change occurring without microstructure evolution, as shown in figure the top lines 10. By contrast, the large hollow spheres have their way during the reduction process with different concentrations. From the former analysis, there is a difference in density of the powders with different concentrations. We thought that the trick was in a low concentration and that the wall of the hollow sphere had much weaker connections between particles than high concentration ones. During the later reduction process, such connection difference is the key point of final microstructure difference. At the temperature of 400 °C, Fe3O4 forms based on the existing Fe2O3. So the connection difference does not affect the microstructures. When the temperature reaches 500 °C, Fe nucleates on Fe3O4. As the temperature increases, Fe3O4 is gradually reduced to Fe. During this step, in each small area, new Fe will form based on the existing Fe grains. When the growing Fe grains contact other grains, it stops growing and merges with each other. Because of the poor connection in the low-concentration sample (0.15 M), the maximum size of final Fe particles is mainly restrained by the original Fe3O4 particles without conspicuous merge phenomena (Fig. 10 middle line). By stark contrast, the high connection in the 0.6 M offers excellent conditions for the Fe particles merging, creating large particles with size up to few micrometers (Fig. 10 bottom lines). It is subtle that good connection of as-synthesized powders offers more possibility contiguous Fe particles to merge, but Fe in the isolated island particles of poorly connected powders has more possibility to grow big. So the low-concentration sample has a smaller particle size but a bigger crystallite size calculated from XRD.
According to the reaction mechanism, the size controllable of the final powder is achieved by merely adjusting the precursor concentration and heat treatment parameters. The lower precursor concentration (0.15 M) is used, so the particles with a smaller size can be obtained. However, the lower concentration also brings relatively low production rate. For high concentrations (0.3 and 0.6 M), extending the holding time at lower temperatures can partially mitigate the merging. So the optimized reduction process with as high production rate as possible can be customized according to the requirement on the final size. It is worth noting that under 4%H2 atmosphere, Fe particles only merges above 550 °C, so decreasing the reduction below temperature does not help get a smaller Fe particle size of the final product.
Conclusions
The synthesis of UFIP has been systematically investigated by combining the FAS and a reduction heat treatment process. We have obtained nano α-Fe2O3 with solid and hollow sphere microstructures after the FAS synthesis with different precursor concentrations. We found that α-Fe2O3 can be gradually reduced to Fe using the postreduction process with 4% H2 and that the Fe particles started to merge when the reduction heat treatment temperature reached 600 °C. The higher precursor concentration (0.6 M) had more merging and caused a bigger Fe particle size on the final product UFIP. Increasing the holding time to 1 h at 550 °C forms the UFIP with the same magnetic properties but smaller particle size with the powders at higher temperature (600 °C), especially for the high concentration. The reduction reaction mechanism depends on the different density levels of Fe2O3 particles on the walls of the hollow spheres. This is the key to different Fe merging levels after the reduction process between high- (0.6 M) and low-concentration (0.15 M) powders. These results show a novel low-cost, high production efficiency method to fabricate UFIP and have the potential to extend to other ultra-fine metal powders.
Experimental
FAS synthesis
Hematite nanoparticles were prepared by FAS, as described in detail [Reference Wang and Huang29]. Briefly, a liquid precursor solution was fed with 2 mL/min, and the carrier gas was O2. Meanwhile, the carrier gas (O2) and methane were supplied to the base flame (CH4, 1.6 L/min, O2, 4.8 L/min, all gases have gas purity > 99%). The flame was enclosed with a 40 cm long quartz glass tube (ID = 100 mm).
Precursor solution
The precursor solution was prepared by dissolving iron(III) nitrate nonahydrate (Aladdin, China, purity 98%) in water. The total metal concentration in the precursor varied from 0.15 to 0.6 M. Before particle synthesis, all precursor solutions were magnetically stirred for 1 h at room temperature.
Reduction heat treatment
The as-synthesized powders were placed in Al2O3 boats for heat treatment. All heat treatments were performed in a tube furnace, particularly for this study alone. Before heating, Ar–4% H2 was flowed through the muffle tube at a high flow rate for an extended period to replace the air in the tube. After the tube was flushed, the Ar–4% H2 flow rate was reduced to 1000 mL/min, and the heat treatment was started. During the heat treatment process, the powders were heated to 300–600 °C at 600 °C/h and held for 1 min to 1 h, followed by furnace cooling to room temperature in about 4 h.
Sample characterization
The phase analysis of the samples was characterized by Cu Kα XRD, and the crystallite sizes were calculated by using the Debye–Scherrer formula. The microstructure was observed by SEM and transmission electron microscopy (TEM). For the statistical analysis of the average particle size and size distribution, 200 particles were randomly chosen in the SEM images from each sample, and the size was measured using Photoshop™ (Adobe Systems Inc., California). The FC and ZFC dc susceptibility were measured in PPMS (physical properties measurement system; Quantum Design®, California) under an applied field of 10 mT. The magnetic hysteresis loop was also measured in PPMS under room temperature from −5 to 5 T.
Supplementary material
To view supplementary material for this article, please visit https://doi.org/10.1557/jmr.2019.336.
Acknowledgments
ZZ was supported by the National Natural Science Foundation of China (51702316). QW was supported by the National Natural Science Foundation of China (51307163, 11745005, and 51477167). QL was supported by the National Natural Science Foundation of China (51676109). HT was supported by the National Natural Science Foundation of China (51806115).