1 Introduction and background
The fuel used to overcome hydrodynamic resistance of marine vessels is significant. For example, in 2012, the United States alone used over seven billion gallons of fossil fuels to power marine vessels according to the US Department of Transportation (2012). Marine fuel consumption is predicted to double between 2010 and 2030 (Streeter Reference Streeter2014). Nearly 60 % of this fuel will be expended to overcome frictional skin drag on the wetted surface of vessels (Mäkiharju, Perlin & Ceccio Reference Mäkiharju, Perlin and Ceccio2012). Hence, methods that can effectively reduce the friction drag on marine vessels could have enormous worldwide economic and environmental impact. Current technologies, such as riblet, polymer or air-layer drag reduction have all been considered for hydrodynamic drag reduction, as recently reviewed by Ceccio (Reference Ceccio2010) and Perlin, Dowling & Ceccio (Reference Perlin, Dowling and Ceccio2016). Active methods of friction drag reduction, such as air or polymer injection, require significant mass and energy input (Bushnell & Moore Reference Bushnell and Moore1991; García-Mayoral & Jiménez Reference García-Mayoral and Jiménez2011; Bidkar et al. Reference Bidkar, Leblanc, Kulkarni, Bahadur, Ceccio and Perlin2014). Therefore, there remains a need to develop passive methods to significantly reduce skin-friction drag in hydrodynamic flows at high Reynolds numbers.
Researchers have consistently shown that superhydrophobic surfaces (SHSs) can effectively lower frictional drag in laminar flow (Watanabe & Udagawa Reference Watanabe and Udagawa2001; Zhao, Du & Shi Reference Zhao, Du and Shi2007; Jung & Bhushan Reference Jung and Bhushan2010; Rothstein Reference Rothstein2010; Bhushan & Jung Reference Bhushan and Jung2011; Busse et al. Reference Busse, Sandham, Mchale and Newton2013; Bixler & Bhushan Reference Bixler and Bhushan2013a ,Reference Bixler and Bhushan b ,Reference Bixler and Bhushan c ; Gruncell, Sandham & McHale Reference Gruncell, Sandham and McHale2013; Jing & Bhushan Reference Jing and Bhushan2013; Srinivasan et al. Reference Srinivasan, Kleingartner, Gilbert, Cohen, Milne and McKinley2015). However, the extension of frictional drag reduction to wall-bounded turbulent flows has not been straightforward (Watanabe & Udagawa Reference Watanabe and Udagawa2001; Henoch et al. Reference Henoch, Krupenkin, Kolodner, Taylor, Hodes, Lyons, Peguero and Breuer2006; Zhao et al. Reference Zhao, Du and Shi2007; Daniello, Waterhouse & Rothstein Reference Daniello, Waterhouse and Rothstein2009; Woolford et al. Reference Woolford, Prince, Maynes and Webb2009; Jung & Bhushan Reference Jung and Bhushan2010; Aljallis et al. Reference Aljallis, Sikka, Jones, Sarshar, Datla and Choi2013; Bidkar et al. Reference Bidkar, Leblanc, Kulkarni, Bahadur, Ceccio and Perlin2014; Park, Sun & Kim Reference Park, Sun and Kim2014). Both the efficacy and mechanism of these potentially drag-reducing surfaces have been previously debated (Schultz & Flack Reference Schultz and Flack2007; Zhao et al. Reference Zhao, Du and Shi2007; Ünal, Ünal & Atlar Reference Ünal, Ünal and Atlar2012; Aljallis et al. Reference Aljallis, Sikka, Jones, Sarshar, Datla and Choi2013; Golovin et al. Reference Golovin, Gose, Perlin, Ceccio and Tuteja2016). In the present work, we examine the physical properties that enable an SHS to reduce drag in turbulent flow. We then design and fabricate scalable, mechanically robust SHSs that produce significant friction drag reduction in fully developed, turbulent channel flow, at the highest Reynolds numbers evaluated to date.
When liquid flows over a solid surface, the usual boundary condition assumed is that the velocity of the liquid must match the velocity of the solid (Rothstein Reference Rothstein2010). This is typically referred to as the ‘no-slip’ boundary condition. However, SHSs possess a fraction of air at the solid–liquid interface, which can have a non-zero interfacial velocity. In 1823, Navier first proposed a slip velocity,
 $u_{s}$
, and suggested that the local shear rate at the wall was proportional to
 $u_{s}$
(Navier Reference Navier1823). This can be described by
 $$\begin{eqnarray}u_{s}=\unicode[STIX]{x1D706}_{x}\left|\frac{\text{d}u}{\text{d}y}\right|,\quad v_{s}=0,\quad w_{s}=\unicode[STIX]{x1D706}_{z}\left|\frac{\text{d}w}{\text{d}y}\right|,\end{eqnarray}$$
where
 $u$
,
 $v$
and
 $w$
are the velocity components in the streamwise (
 $x$
), wall-normal (
 $y$
) and spanwise (
 $z$
) directions, and
 $\unicode[STIX]{x1D706}_{i}$
is the slip length along direction
 $i$
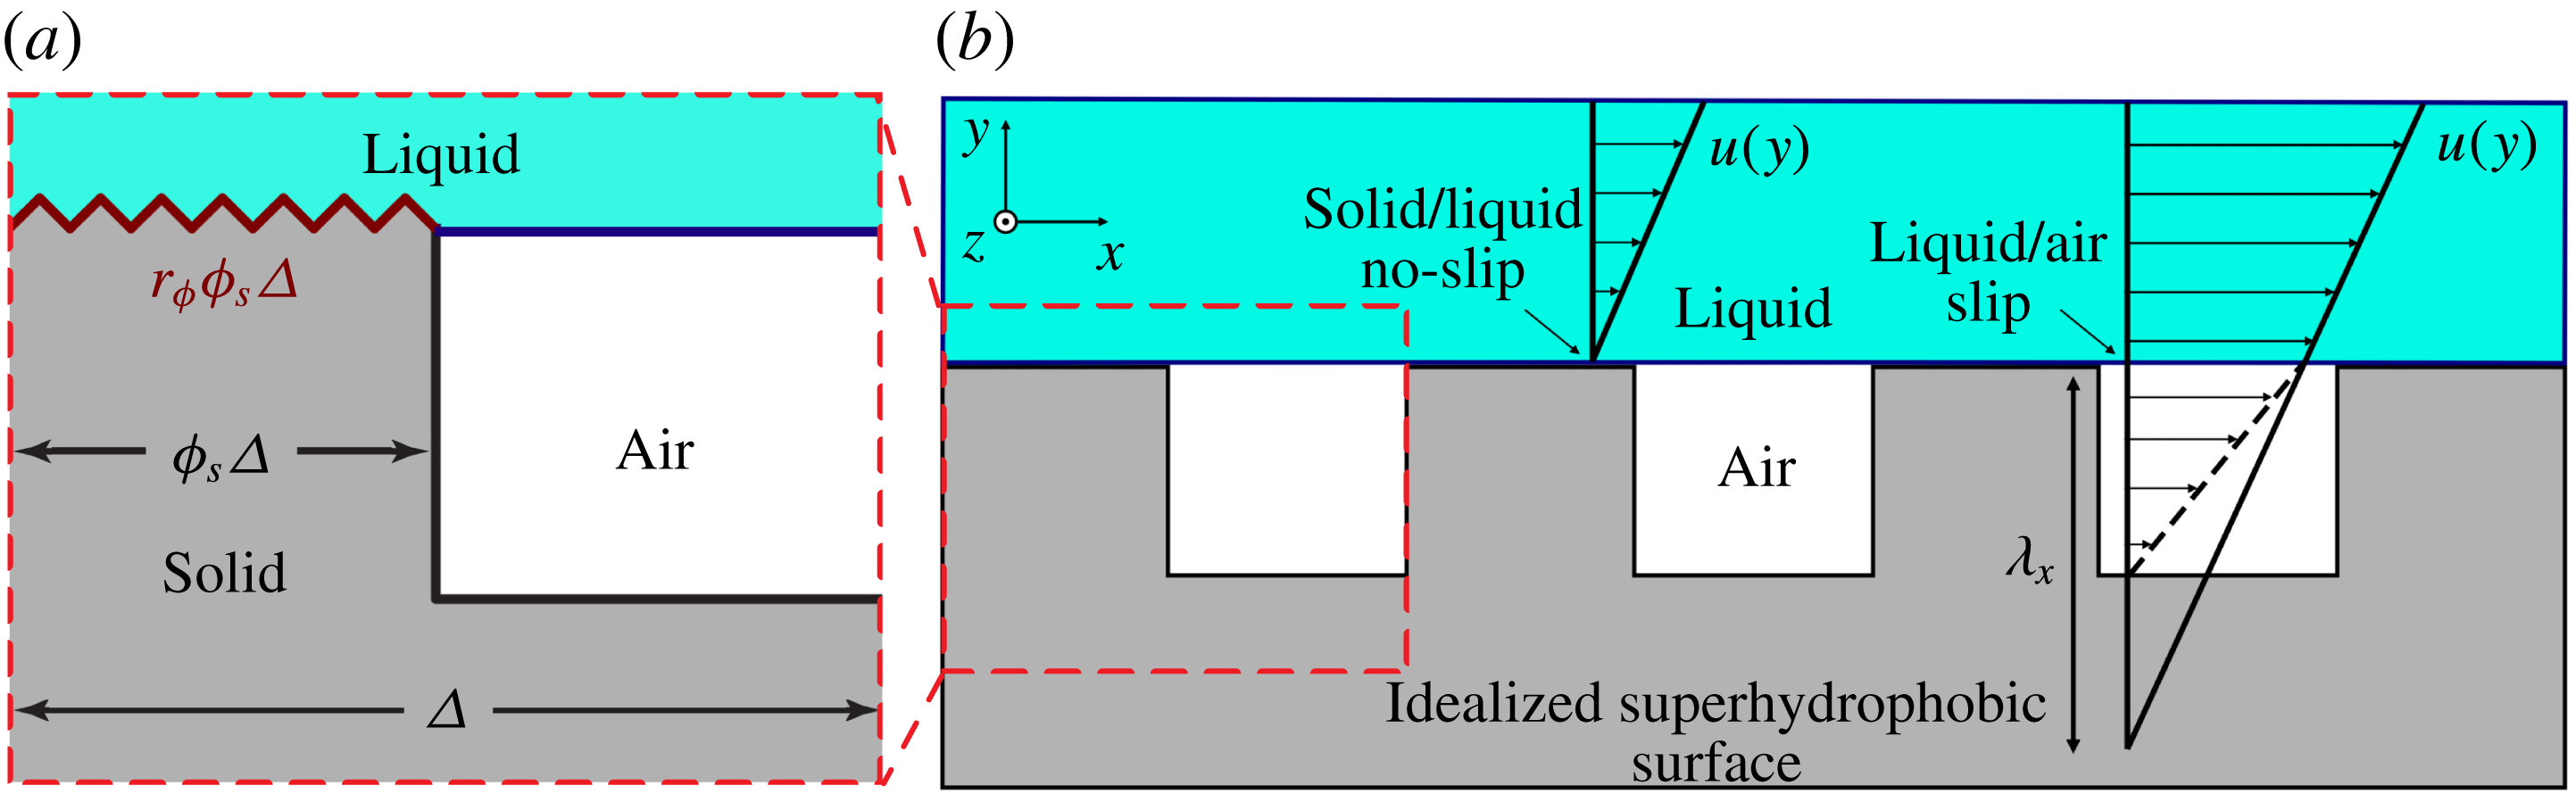
. SHSs can produce slip at the interface through the incorporation of entrapped air. This is schematically depicted in figure 1, for a two-dimensional flow over an idealized SHS, where
 $\unicode[STIX]{x1D706}_{x}$
represents the local slip length in the streamwise direction. Because less energy is lost to frictional dissipation, a non-zero streamwise slip velocity indicates a local reduction in drag at the solid–liquid interface, while a non-zero spanwise slip velocity,
 $w_{s}$
, generally results in a local net drag increase as shown by Min & Kim (Reference Min and Kim2004), Woolford et al. (Reference Woolford, Prince, Maynes and Webb2009), Jelly, Jung & Zaki (Reference Jelly, Jung and Zaki2014). Nevertheless, for flow over heterogeneous, randomly rough surfaces, such as those investigated in this work, local regions of slip in an otherwise no-slip flow cannot be used to characterize or predict SHS drag reduction. Instead we must consider an effective slip length
 $\unicode[STIX]{x1D706}_{eff}$
, which has been discussed by in detail by Lauga & Stone (Reference Lauga and Stone2003) for flow inside a round pipe with a patterned slip/no-slip boundary conditions, and experimentally evaluated by others (Gogte et al.
Reference Gogte, Vorobieff, Truesdell, Mammoli, van Swol, Shah and Brinker2005; Joseph & Tabeling Reference Joseph and Tabeling2005; Ou & Rothstein Reference Ou and Rothstein2005; Lee, Choi & Kim Reference Lee, Choi and Kim2008). For laminar flows, the drag-reducing ability of SHSs has been confirmed and related to the effective slip, both experimentally and computationally; see the recent review by Rothstein (Reference Rothstein2010). Moreover, effective slip length has a strong dependence on the area fraction of air, and diminishingly small solid fractions for structured SHSs have previously shown that laminar drag reduction as high as 99 % can be achieved (Kim & Kim Reference Kim and Kim2002).
The correlation between the details of the surface texture and heterogeneous three-phase interface that can form on an idealized superhydrophobic surface comprising macro-sized and nano-sized features. Above the solid surface, the velocity of the flow at the wall must go to zero to match the speed of the solid. However, over the air pocket (between micro-sized features separated by a distance
 $\unicode[STIX]{x1D6E5}/2$
), the velocity can be non-zero, creating a local slip velocity
 $u_{s}$
and a corresponding local slip length
 $\unicode[STIX]{x1D706}_{x}$
(b). On the upper, horizontal surface of the micro-sized features there are smaller features that are wetted by the liquid water (marked in dark red) (a). This wetted region can be described by
 $r_{\unicode[STIX]{x1D719}}\unicode[STIX]{x1D719}_{s}\unicode[STIX]{x1D6E5}$
, where
 $r_{\unicode[STIX]{x1D719}}$
and
 $\unicode[STIX]{x1D719}_{s}$
are the ratio of the wetted surface area to its projected surface area and the areal fraction of the surface that is wetted by the liquid, respectively.

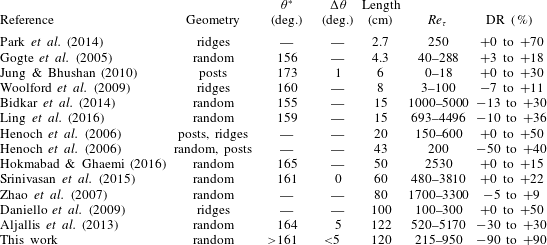
However, the ability of SHSs to afford drag reduction in turbulent flow is not well characterized (Watanabe & Udagawa Reference Watanabe and Udagawa2001; Henoch et al. Reference Henoch, Krupenkin, Kolodner, Taylor, Hodes, Lyons, Peguero and Breuer2006; Zhao et al. Reference Zhao, Du and Shi2007; Daniello et al. Reference Daniello, Waterhouse and Rothstein2009; Woolford et al. Reference Woolford, Prince, Maynes and Webb2009; Jung & Bhushan Reference Jung and Bhushan2010; Aljallis et al. Reference Aljallis, Sikka, Jones, Sarshar, Datla and Choi2013; Bidkar et al. Reference Bidkar, Leblanc, Kulkarni, Bahadur, Ceccio and Perlin2014; Park et al. Reference Park, Sun and Kim2014). Whereas small, micro-fabricated surfaces have shown drag reduction anywhere from 10 % (Woolford et al. Reference Woolford, Prince, Maynes and Webb2009; Srinivasan et al. Reference Srinivasan, Kleingartner, Gilbert, Cohen, Milne and McKinley2015) to 50 % (Henoch et al. Reference Henoch, Krupenkin, Kolodner, Taylor, Hodes, Lyons, Peguero and Breuer2006; Daniello et al. Reference Daniello, Waterhouse and Rothstein2009), large, scalable SHSs have resulted in drag increase (Zhao et al. Reference Zhao, Du and Shi2007; Aljallis et al. Reference Aljallis, Sikka, Jones, Sarshar, Datla and Choi2013; Bidkar et al. Reference Bidkar, Leblanc, Kulkarni, Bahadur, Ceccio and Perlin2014; Hokmabad & Ghaemi Reference Hokmabad and Ghaemi2016; Ling et al. Reference Ling, Srinivasan, Golovin, McKinley, Tuteja and Katz2016) or an approximately 10 to 30 % drag reduction under certain conditions (Aljallis et al. Reference Aljallis, Sikka, Jones, Sarshar, Datla and Choi2013; Bidkar et al. Reference Bidkar, Leblanc, Kulkarni, Bahadur, Ceccio and Perlin2014; Hokmabad & Ghaemi Reference Hokmabad and Ghaemi2016; Ling et al. Reference Ling, Srinivasan, Golovin, McKinley, Tuteja and Katz2016). In turbulent flow, there is an interaction between the near-wall region and the buffer region. The former, known as the viscous sublayer, is dominated by viscous shear stresses, while the latter is dominated by turbulent momentum transfer. This interaction may be modified when micro-features are added to a surface. Additionally, significant momentum transfer is expected in the viscous sublayer due to the presence of the disparate liquid–air and liquid–solid interfaces causing mixed slip/no-slip boundary conditions that can exist on textured surfaces. These near-wall flows are complex due to the many turbulent structures, eddies and vortices that dominate the momentum transfer in the buffer region (White Reference White2006). Moreover, while slip in the direction of flow can result in drag reduction, slip in the spanwise direction can increase the intensity of these turbulent structures, causing a drag increase (Min & Kim Reference Min and Kim2004; Woolford et al. Reference Woolford, Prince, Maynes and Webb2009; Jelly et al. Reference Jelly, Jung and Zaki2014). As a result, surfaces that reduce drag in laminar flow, where these additional flow features are absent, are not guaranteed to continue reducing drag when exposed to turbulent flow. Table 1 summarizes the previous attempts to characterize drag reduction of SHSs in turbulent flow.
Previous studies on drag reduction (DR) in turbulent flow with corresponding geometry of surfaces, apparent contact angle
 $\unicode[STIX]{x1D703}^{\ast }$
and contact angle hysteresis
 $\unicode[STIX]{x0394}\unicode[STIX]{x1D703}$
when reported, where
 $\unicode[STIX]{x0394}\unicode[STIX]{x1D703}$
is equal to the difference between the advancing contact angle
 $\unicode[STIX]{x1D703}_{adv}^{\ast }$
and receding contact angle
 $\unicode[STIX]{x1D703}_{rec}^{\ast }$
. Lengths of the tested surfaces, range of friction Reynolds numbers evaluated (
 $Re_{\unicode[STIX]{x1D70F}}=H/2\unicode[STIX]{x1D6FF}_{\unicode[STIX]{x1D708}}=\unicode[STIX]{x1D6FF}/\unicode[STIX]{x1D6FF}_{\unicode[STIX]{x1D708}}$
where
 $H$
is the channel height,
 $\unicode[STIX]{x1D6FF}_{\unicode[STIX]{x1D708}}$
is the viscous length scale and
 $\unicode[STIX]{x1D6FF}$
is the effective boundary layer thickness) and the observed drag reduction (positive) or drag increase (negative) are also tabulated.

2 Surface characterization and fabrication for drag reduction
In the present study, we will relate how the measurement of apparent contact angles and contact angle hysteresis at elevated pressures can be used to characterize how the near-wall turbulent flow interacts with the gas pockets and wetted surface features of immersed SHSs, which in turn determines the skin-friction and form drag components of the total drag coefficient.
2.1 Conventional surface wettability characterization
Characterizing the wettability of an SHS is critical to predicting its drag reduction capability. A liquid droplet placed on a smooth homogeneous surface exhibits an intrinsic contact angle
 $\unicode[STIX]{x1D703}$
along the three-phase contact line.
 $\unicode[STIX]{x1D703}$
is determined by the balance between the surface tension of the liquid droplet, surface energy of the solid and interfacial tension between the liquid and solid (Young Reference Young1805). A water droplet on an SHS appears nearly spherical, exhibiting a very high macroscopic apparent contact angle
 $\unicode[STIX]{x1D703}^{\ast }$
, typically greater than
 $150^{\circ }$
(despite
 $120^{\circ }$
being the highest reported intrinsic contact angle with water). A high
 $\unicode[STIX]{x1D703}^{\ast }$
is achieved by maximizing the fraction of air,
 $(1-\unicode[STIX]{x1D719}_{s})$
, entrapped within the non-wetted porous texture underneath the water droplet. Cassie and Baxter proposed that
 $\unicode[STIX]{x1D703}^{\ast }$
is a weighted average between the contact angle on the wetted surface texture asperities, and the contact angle of air, which is
 $180^{\circ }$
, or
 $\unicode[STIX]{x03C0}$
(Cassie & Baxter Reference Cassie and Baxter1944), as shown in (2.1):
 $$\begin{eqnarray}\cos \unicode[STIX]{x1D703}^{\ast }=r_{\unicode[STIX]{x1D719}}\unicode[STIX]{x1D719}_{s}\cos \unicode[STIX]{x1D703}+(1-\unicode[STIX]{x1D719}_{s})\cos \unicode[STIX]{x03C0}.\end{eqnarray}$$
Here
 $\unicode[STIX]{x1D719}_{s}$
is the ratio of the projected area of the wetted regions over the total projected area of the surface. Minimizing
 $\unicode[STIX]{x1D719}_{s}$
, i.e. maximizing the fraction of air entrapped beneath the liquid, maximizes
 $\unicode[STIX]{x1D703}^{\ast }$
. The roughness parameter
 $r_{\unicode[STIX]{x1D719}}$
is the ratio of the surface area of the wetted region to its projected area. Increasing the roughness of the fully wetted area increases the apparent contact angle if the intrinsic contact angle exceeds
 $90^{\circ }$
. Thus, a very high
 $r_{\unicode[STIX]{x1D719}}$
will also raise the overall
 $\unicode[STIX]{x1D703}^{\ast }$
of the surface. SHSs with lower wetted areas also exhibit lower contact angle hysteresis
 $\unicode[STIX]{x0394}\unicode[STIX]{x1D703}$
, the difference between the advancing and receding contact angles,
 $\unicode[STIX]{x1D703}_{adv}^{\ast }$
and
 $\unicode[STIX]{x1D703}_{rec}^{\ast }$
, respectively. Minimizing
 $\unicode[STIX]{x0394}\unicode[STIX]{x1D703}$
increases the mobility of water droplets on a surface, allowing them to more easily roll or bounce off it. These wetting parameters are also presented in table 1.
2.2 Surface fabrication and conventional wettability in the present study
We have developed four different SHSs that all display
 $\unicode[STIX]{x1D703}^{\ast }>161^{\circ }$
and
 $\unicode[STIX]{x0394}\unicode[STIX]{x1D703}<5^{\circ }$
, when measured using the conventional goniometric technique. Scanning electron microscopy (SEM) was performed using a Philips XL30 FEG. Samples were first sputtered with a gold–palladium alloy to avoid charging. SEM micrographs of the four SHS surface formulations are shown in figure 2. Surface parameters such as the root-mean-squared (r.m.s.) roughness
 $k$
were extracted from the optical height maps collected as described in the following section.
Surface number 1 was fabricated from a 80/20 wt. % blend of a fluorinated polyurethane (FPU) and fluorodecyl polyhedral oligomeric silsesquioxane (F-POSS) (Mabry et al.
Reference Mabry, Vij, Iacono and Viers2008). The polyurethane was cross-linked using 3.4 wt. % 4,4
 $^{\prime }$
-Methylenebis(cyclohexyl isocyanate) (HMDI). The blend was dissolved in Vertrel XF at an overall concentration of
 $100~\text{mg}~\text{ml}^{-1}$
and probe sonicated until optically transparent. A total of 40 ml of the solution was sprayed onto the 1.20
 $\times$
0.10 m stainless steel substrates using an ATD Tools 6903 high volume low-pressure spray gun with compressed air at a pressure of 20 psi. The sample was then cured at
 $80\,^{\circ }\text{C}$
for 72 h.
SEM micrographs of the four SHSs produced in this work. Scale bars are
 $20~\unicode[STIX]{x03BC}\text{m}$
.

Surface number 2 consisted of a 50/50 wt. % blend of cyanoacrylate (SF100) and F-POSS. The two components were dissolved at a concentration of
 $50~\text{mg}~\text{ml}^{-1}$
in Asahiklin-225 and then sprayed using the same procedure as for surface number 1. Surface number 2 was cured at
 $50\,^{\circ }\text{C}$
for 60 min. The morphology of this system was altered in the following manner. To increase asperity roughness, the total spray solution volume was tripled to 120 ml. To decrease asperity roughness, the spray gun was replaced with a Paasche airbrush producing a spray with smaller droplets, as described in a previous work (Golovin et al.
Reference Golovin, Lee, Mabry and Tuteja2013).
Surface number 3 was fabricated from a blend of the fluorinated polyurethane from surface number 1 and 35 wt. % fluoro-functionalized silica particles (irregular aggregates approximately 50–100 nm in diameter), the synthesis of which is reported elsewhere (Campos et al.
Reference Campos, Guenthner, Haddad and Mabry2011). The two components were dispersed at a concentration of
 $25~\text{mg}~\text{ml}^{-1}$
in Vertrel XF and then 20 ml was sprayed following the same procedures as surface numbers 1 and 2. This surface was cured at
 $80\,^{\circ }\text{C}$
for 72 h.
Surface number 4 comprised 6061 aluminium (Al) metal sheets that were etched, boiled and subsequently functionalized with a fluoro-silane, following modified procedures from previously reported techniques (Yang et al.
Reference Yang, Zhang, Xu, Men, Zhu and Zhou2011). Al sheets 0.2 m
 $\times$
0.1 m
 $\times$
0.003 m were first etched in 2.5 M hydrochloric acid for 20 min. Following etching, the samples were sonicated to remove residual Al flakes adhered to the surface. The etched Al was then boiled in deionized water for 20 min. Finally, the surface was exposed to 1H,1H,2H,2H-Heptadecafluorodecyl triethoxysilane vapour overnight at
 $80\,^{\circ }\text{C}$
under vacuum. To span the full channel length, approximately five sheets were tiled together.
These four SHSs are mechanically durable (Golovin et al.
Reference Golovin, Boban, Mabry and Tuteja2017), easy to fabricate and were applied over areas of 1.20
 $\times$
0.10 m, an order of magnitude larger than most other SHSs previously tested (Henoch et al.
Reference Henoch, Krupenkin, Kolodner, Taylor, Hodes, Lyons, Peguero and Breuer2006; Daniello et al.
Reference Daniello, Waterhouse and Rothstein2009; Jung & Bhushan Reference Jung and Bhushan2010; Bidkar et al.
Reference Bidkar, Leblanc, Kulkarni, Bahadur, Ceccio and Perlin2014; Park et al.
Reference Park, Sun and Kim2014) in turbulent flows.
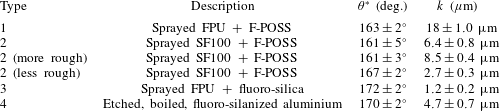
Summary of the SHSs fabricated for this work, with their low-pressure apparent contact angle
 $\unicode[STIX]{x1D703}^{\ast }$
and r.m.s. roughness
 $k$
.

2.3 A novel surface wettability characterization technique
As shown in table 1, authors of the previous studies may not have reported the contact angles of the SHSs examined, or they only reported a static apparent contact angle, with no measure of contact angle hysteresis. From a materials design standpoint, there are few guidelines regarding how surfaces should be fabricated so as to maximize the drag-reducing potential of an SHS in turbulence. Generally in the literature, reporting
 $\unicode[STIX]{x1D703}_{adv}^{\ast }$
and
 $\unicode[STIX]{x1D703}_{rec}^{\ast }$
at ambient pressure has been considered sufficient to describe an SHS. However, here we show that characterization of these angles at ambient pressure, while necessary, may not be sufficient to identify surfaces capable of reducing drag in turbulent flow. Fully turbulent, high Reynolds number flows create large pressure fluctuations and high shear stresses. Such large surface pressures can displace the entrapped air pockets of an SHS if its capillary resistance is low, i.e. only a small pressure is required to transition from the non-wetted Cassie–Baxter state to the fully wetted Wenzel state. Similarly, the high shear stresses can mechanically damage and detach any fragile texture elements of the SHS, again removing the entrapped air. Insufficient mechanical durability is one reason SHSs have previously not shown sustainable friction reduction in turbulent flow (Zhao et al.
Reference Zhao, Du and Shi2007; Aljallis et al.
Reference Aljallis, Sikka, Jones, Sarshar, Datla and Choi2013; Srinivasan et al.
Reference Srinivasan, Choi, Park, Chhatre, Cohen and McKinley2013; Bidkar et al.
Reference Bidkar, Leblanc, Kulkarni, Bahadur, Ceccio and Perlin2014; Ling et al.
Reference Ling, Srinivasan, Golovin, McKinley, Tuteja and Katz2016). Regardless, even if the air remains within the interstices of an SHS, the surface may not reduce drag if the texture is not of the correct morphology and scale (Zhao et al.
Reference Zhao, Du and Shi2007; Bidkar et al.
Reference Bidkar, Leblanc, Kulkarni, Bahadur, Ceccio and Perlin2014), as we explain below.
The measured static apparent contact angle of a droplet may be used to calculate the wetted area fraction
 $r_{\unicode[STIX]{x1D719}}\unicode[STIX]{x1D719}_{s}$
using (2.1). This experimental
 $r_{\unicode[STIX]{x1D719}}\unicode[STIX]{x1D719}_{s}$
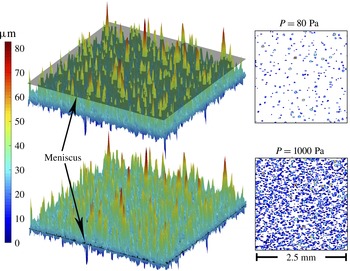
is then used to determine the meniscus height, and subsequently, the geometry of wetted asperities, by using a height map of the surface texture. These are computed for varying hydrostatic pressures by using measured
 $\unicode[STIX]{x1D703}^{\ast }$
of droplets with varying volume and Laplace pressure as shown in figure 4. This also allows extrapolation to pressures greater that can be measured with goniometry, as the droplet volume becomes impractically small. Here we show a height map of surface number 2, collected with an Olympus LEXT OLS4000 laser measuring microscope with a Z step size of
 $1.25~\unicode[STIX]{x03BC}\text{m}$
, an overall scan area of 2.5
 $\times$
2.5 mm and an XY resolution of
 $1.25\times 1.25~\unicode[STIX]{x03BC}\text{m}$
. Superimposed on the upper height map is the meniscus at low pressure, which is conventionally used to measure contact angle. The meniscus at high pressure shown on the bottom height map may be expected in turbulent flow conditions.

As the liquid pressure increases on an SHS, the liquid–vapour interface moves downwards into the air pockets, partially filling the surface texture, thereby increasing
 $\unicode[STIX]{x1D719}_{s}$
and possibly also
 $r_{\unicode[STIX]{x1D719}}$
, depending on the surface geometry. Using height maps of the surface and
 $\unicode[STIX]{x1D703}^{\ast }$
data at varying pressure, it is possible to iteratively solve for
 $r_{\unicode[STIX]{x1D719}}\unicode[STIX]{x1D719}_{s}$
using (2.1), calculate the meniscus height corresponding to that wetted area and then solve for
 $\unicode[STIX]{x1D719}_{s}$
and
 $r_{\unicode[STIX]{x1D719}}$
independently using the known surface morphology. An example of the results are shown in figure 3. The height maps were collected with an Olympus LEXT OLS4000 laser measuring microscope with a Z step size of
 $1.25~\unicode[STIX]{x03BC}\text{m}$
, an overall scan area of 2.5
 $\times$
2.5 mm, and an XY resolution of
 $1.25\times 1.25~\unicode[STIX]{x03BC}\text{m}$
. A minimum of three locations were imaged per sample. Contact angles were measured using a Ramé–Hart 200 F1 contact angle goniometer with water droplets of varying volumes. Dynamic contact angles and contact angle hysteresis were measured via the conventional low-pressure sessile drop method, by increasing or decreasing the volume of a water droplet contacting the surface while attached to a microsyringe tip. Droplet volumes ranged from 10–
 $20~\unicode[STIX]{x03BC}\text{l}$
for this technique. By decreasing the size of the droplet used to measure contact angles, the
 $\unicode[STIX]{x1D703}^{\ast }$
at elevated pressures may be measured. The Laplace pressure,
 $P_{L}$
, within an azimuthally symmetric water droplet is given by
 $P_{L}=2\unicode[STIX]{x1D6FE}/R$
where
 $\unicode[STIX]{x1D6FE}$
is the surface tension of water and
 $R$
is the radius of the droplet. For a 250 nl droplet,
 $P_{L}\approx 370$
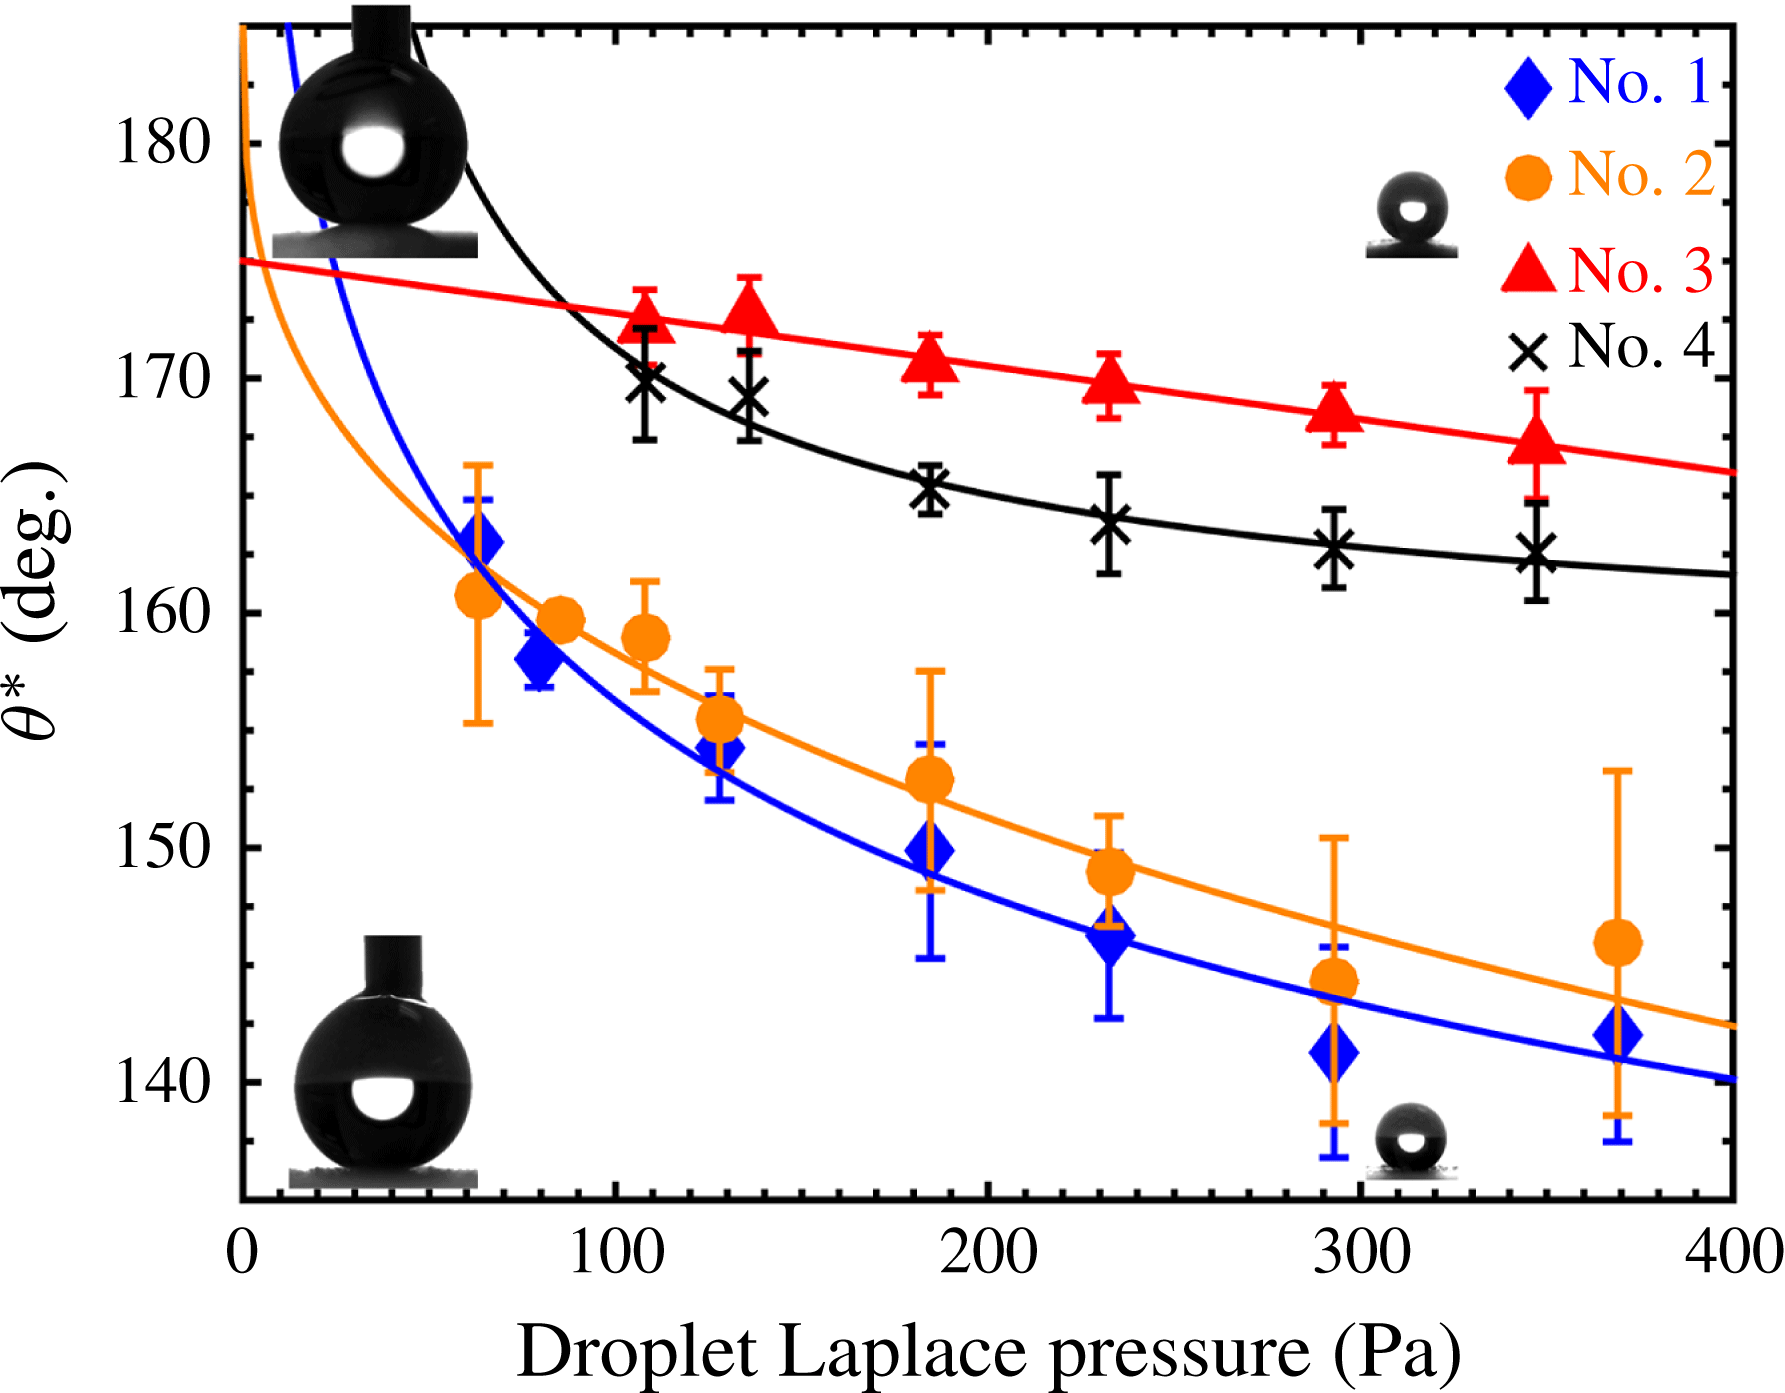
Pa. The higher-pressure static contact angles on the four SHSs spanned a range of
 $20^{\circ }$
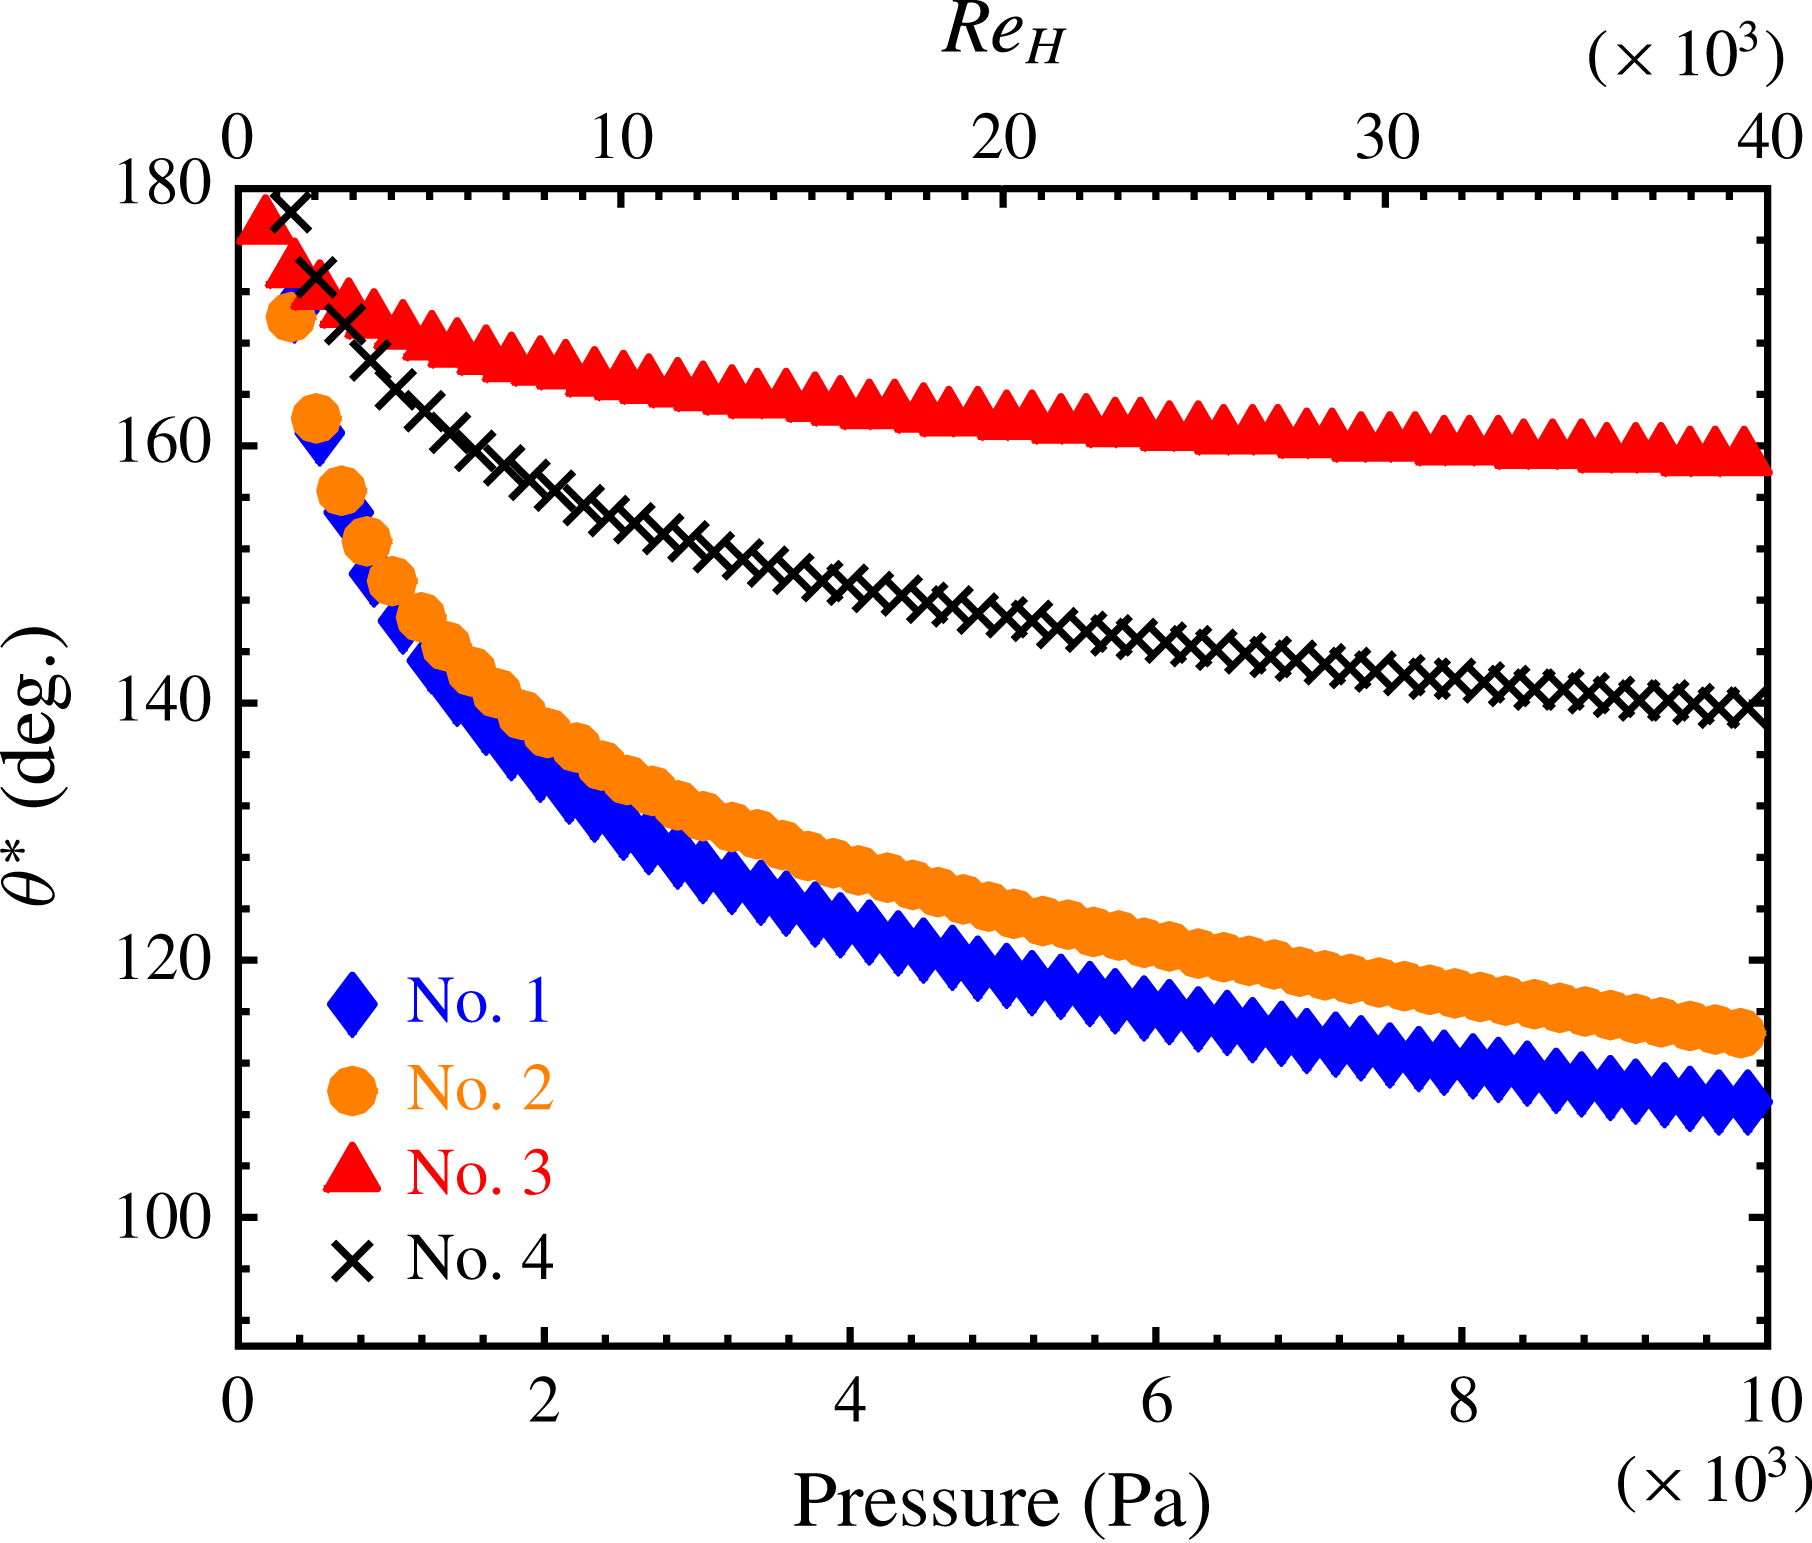
, indicating a disparate response to applied pressure, as seen in figure 4. Although the pressure range of this method is limited by the minimum drop size that may be deposited and measured, contact angles at higher pressures and Reynolds numbers may be extrapolated with a power law fit to the data, as shown in figure 5. The range of mean pressures
 $P_{m}$
experienced in this study was approximately 300 to 9000 Pa, linearly varying with a nominally zero outlet pressure at the downstream end of the SHSs. Additionally, the variation of
 $r_{\unicode[STIX]{x1D719}}\unicode[STIX]{x1D719}_{s}$
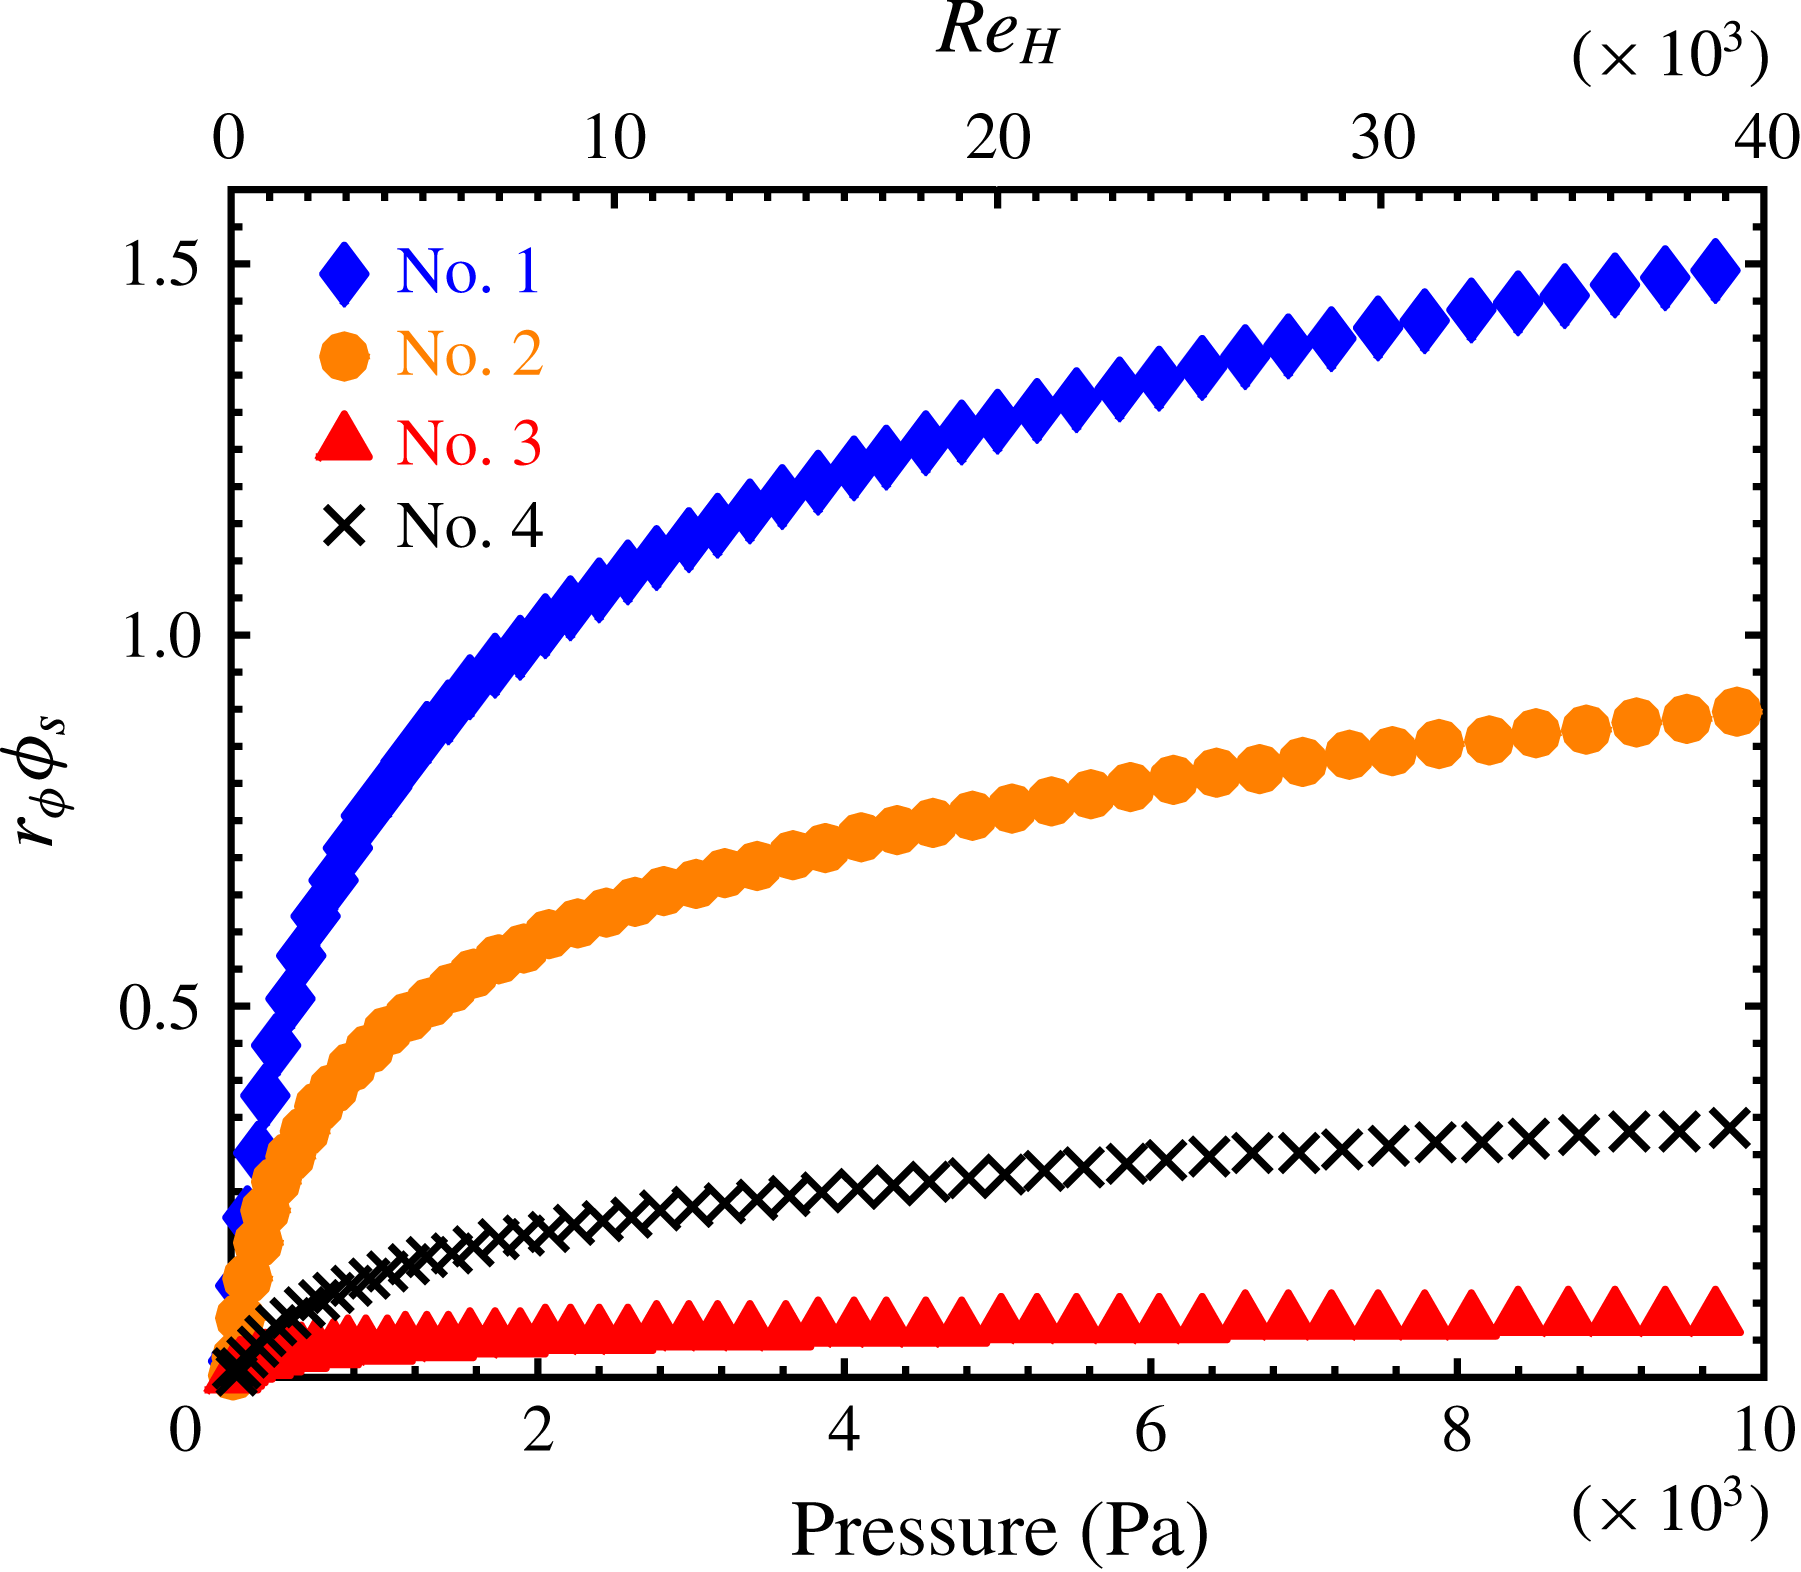
with pressure is shown in figure 6 as a power law fit to the experimental data.
The apparent contact angle
 $\unicode[STIX]{x1D703}^{\ast }$
as a function of pressure for the four surfaces considered in this work, as measured using drops of varying volume and Laplace pressure. The lines are power law fits to the data. The insets show goniometer images of droplets on surface number 1 (below) and number 3 (above).

The expected measured apparent contact angle
 $\unicode[STIX]{x1D703}^{\ast }$
as a function of pressure and the corresponding height-based Reynolds number
 $Re_{H}$
(see (3.1)) of the experimental flow facility (shown in figure 7 and discussed in § 3) for the four surfaces considered in this work. The quantities presented were extrapolated from a power law fit to the experimental contact angle data in figure 4.

The expected variation of
 $r_{\unicode[STIX]{x1D719}}\unicode[STIX]{x1D719}_{s}$
as a function of pressure and the corresponding height-based Reynolds number
 $Re_{H}$
(see (3.1)) of the experimental flow facility (shown in figure 7 and discussed in § 3) for the four surfaces considered in this work. The quantities presented were extrapolated from a power law fit to the experimental contact angle data in figure 4.

According to (2.1),
 $\unicode[STIX]{x1D703}^{\ast }$
must decrease with the increased wetted area at increased pressures, as shown in figure 4. This has two critical implications. First, the projected wetted area
 $\unicode[STIX]{x1D719}_{s}$
calculated from conventional measurements of
 $\unicode[STIX]{x1D703}^{\ast }$
may be significantly different from the
 $\unicode[STIX]{x1D719}_{s}$
in a turbulent flow at elevated pressures, depending on the pressure resistance of the texture. Second, the wetted asperities that protrude into the flow, as characterized by the wetted roughness
 $r_{\unicode[STIX]{x1D719}}$
, may cause form drag (Kanda, Moriwaki & Kasamatsu Reference Kanda, Moriwaki and Kasamatsu2004; Xie & Castro Reference Xie and Castro2006; Leonardi, Orlandi & Antonia Reference Leonardi, Orlandi and Antonia2007; Leonardi & Castro Reference Leonardi and Castro2010; Bidkar et al.
Reference Bidkar, Leblanc, Kulkarni, Bahadur, Ceccio and Perlin2014), increase turbulent mixing and/or enhance turbulent structures (White Reference White2006) that may negate any skin-friction drag reduction, resulting in a net increase in drag. A significant decrease in
 $\unicode[STIX]{x1D703}^{\ast }$
with elevated pressure necessarily indicates an increase in
 $r_{\unicode[STIX]{x1D719}}\unicode[STIX]{x1D719}_{s}$
and equivalently, an increase in the number and size of texture elements protruding into the flow. In short, a surface that exhibits a large decrease in
 $\unicode[STIX]{x1D703}^{\ast }$
with increasing pressure will exhibit an increase in form drag in turbulent flow. It is therefore important to characterize the wetted area of the surface at the pressures expected during turbulent flow to accurately predict turbulent skin-friction drag reduction.
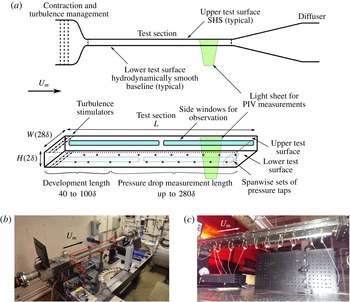
(a) Schematic of the fully developed turbulent flow facility. The major flow components are presented in upper half of (a), while a detailed depiction of the test section is shown in the lower half of (a). (b) Image of the flow facility. Fabricated SHSs are inserted into the top of test section (outlined in red). (c) Image of the pressure taps used to infer the skin friction, viewed obliquely from the underside of the test section.

We estimate the contribution of form drag by the wetted roughness as a means of determining if a rough surface is expected to cause a drag increase when compared to a smooth baseline. As form drag is not present for a hydrodynamically smooth plate (r.m.s. roughness
 ${<}1~\unicode[STIX]{x03BC}\text{m}$
for the present study), we estimate if there is an expected increase in resistance over the skin friction, i.e. if there are enough texture elements protruding above the heterogeneous three-phase interface to increase the power required to move water over the surface at a predetermined speed. Using the height map and meniscus height and the geometry of each wetted texture element (using the method presented and figure 3), the form drag on each texture element was approximated by the following (White Reference White2006):
 $$\begin{eqnarray}F_{Di}={\textstyle \frac{1}{2}}\unicode[STIX]{x1D70C}U_{i}^{2}A_{i}C_{D},\end{eqnarray}$$
where
 $\unicode[STIX]{x1D70C}$
is the density of water,
 $U_{i}$
is the average flow speed in the vicinity of each texture element,
 $A_{i}$
is the element’s projected area in the flow direction and
 $C_{D}$
is the drag coefficient based on the geometry of each element. In this analysis, the wetted geometry is determined using the high-pressure contact angle measurements and the measured geometry of the surface. Thus, for a given mean flow speed and pressure, the number of wetted elements and their area projected normal to the flow are known. We assume that
 $U$
is equal to the flow speed that would occur in the one half-height of each element in the viscous sublayer. Admittedly, this is a gross assumption, especially in the presence of slip. Nevertheless, acknowledging the velocity in the viscous sublayer can be related to the height above the surface (
 $u^{+}=y^{+}$
, where
 $u^{+}$
is the local flow speed non-dimensionalized by the friction velocity, i.e.
 $u(y)/u_{\unicode[STIX]{x1D70F}}$
, and
 $y^{+}$
is the inner variable coordinate above the surface non-dimensionalized by the friction velocity and kinematic viscosity, i.e.
 $y^{+}=yu_{\unicode[STIX]{x1D70F}}/\unicode[STIX]{x1D708}$
, where
 $u_{\unicode[STIX]{x1D70F}}$
is as defined in § 3), an approximation of the flow speed at each element is reached. The last step is to determine
 $C_{D}$
for the roughness elements, which based on their shape is assumed to most closely match the
 $C_{D}$
of a triangular roughness element, or
 $C_{D}\approx 1.0$
. It should be stated that this analysis should only be used to evaluate if a net increase or a potential reduction is possible, based on the known flow conditions and the measured rough surface topology, which we will show in § 4.
On an SHS, if the sum of the forces due to form drag on each of the protruding texture elements exceeds the drag reduction due to the presence of the trapped air pockets, a net drag increase will result. This drag increase is a direct consequence of the meniscus height at pressure, and is independent of the
 $\unicode[STIX]{x1D703}_{adv}^{\ast }$
or
 $\unicode[STIX]{x1D703}_{rec}^{\ast }$
measured at low/atmospheric pressure. Computationally it has been shown that surfaces with
 $\unicode[STIX]{x1D719}_{s}\approx 0.1$
exhibit the highest form drag in the fully wetted case (Kanda et al.
Reference Kanda, Moriwaki and Kasamatsu2004; Leonardi & Castro Reference Leonardi and Castro2010). Moreover, the largest texture elements produce disproportionately high form drag (Leonardi et al.
Reference Leonardi, Orlandi and Antonia2007; Xie, Coceal & Castro Reference Xie, Coceal and Castro2008). As such, designing SHSs that will not cause significant form drag in turbulent flow is non-trivial and has rarely been investigated (Bidkar et al.
Reference Bidkar, Leblanc, Kulkarni, Bahadur, Ceccio and Perlin2014; Hokmabad & Ghaemi Reference Hokmabad and Ghaemi2016). The dynamics of the gas–liquid interfaces on the SHS will also play a significant role in how the wetted surface textures may be exposed to the flow under changing flow pressure. This, in turn, is related to the contact angle hysteresis of the SHS, measured at higher pressure. For higher pressure
 $\unicode[STIX]{x0394}\unicode[STIX]{x1D703}$
measurements, low volume (250 nl to
 $6~\unicode[STIX]{x03BC}\text{l}$
) droplets were deposited onto the SHSs using a micropipette. The surface was then tilted on the goniometer until the droplet rolled off, while monitoring the contact angles of the droplet. Here we assume
 $\unicode[STIX]{x1D703}_{adv}^{\ast }=\unicode[STIX]{x1D703}_{max}$
and
 $\unicode[STIX]{x1D703}_{rec}^{\ast }=\unicode[STIX]{x1D703}_{min}$
immediately prior to droplet roll-off.
3 Experimental set-up to measure skin friction of SHSs
We evaluated the skin friction of the four SHSs in a fully developed turbulent channel flow at various flow speeds using pressure drop measurements and particle image velocimetry (PIV). The test facility is shown in figure 7. Two noteworthy characteristics of channel flow prove efficacious when compared to zero-pressure-gradient flows for the fundamental evaluation of skin friction in turbulent flow, and particularly, for the development and characterization of SHSs for drag reduction. First, channel flows are internal and have a confined outer length scale (channel height
 $H$
), which is fixed by the opposing walls. In zero-pressure-gradient flows the outer length scale
 $\unicode[STIX]{x1D6FF}$
is unrestricted and grows as a function of distance along the surface. A fixed outer length scale eliminates the dependence of the spatial location on scaling, and results in the scaling being primarily dependent on the bulk-flow variables. Second, channel flow facilities simplify the determination of frictional drag by measurement of the pressure drop for a fully developed turbulent flow. Pressure drop analysis offers the simplest, and perhaps, the most widely utilized method of measuring skin friction for internal flows. Schultz & Flack (Reference Schultz and Flack2013) provide a thorough discussion of Reynolds number scaling for turbulent channel flow and ultimately conclude, ‘channel flow results show Reynolds-number scaling trends that are consistent with recent experimental results from pipe and boundary layer flows’. Our channel’s height-based Reynolds number
 $Re_{H}$
ranged from 10 000 to 30 000, and was calculated using (3.1):
 $$\begin{eqnarray}Re_{H}=\frac{U_{m}H}{\unicode[STIX]{x1D708}}.\end{eqnarray}$$
In (3.1),
 $\unicode[STIX]{x1D708}$
is the kinematic viscosity of water and
 $U_{m}$
is the streamwise mean flow speed, determined from the volumetric flow rate, and verified with PIV of the entire flow field. PIV was conducted in the
 $x$
–
 $y$
mid-plane of the channel, approximately 95
 $H$
downstream of the channel inlet. As many as 1200 image pairs were captured, analysed and averaged with commercial processing software. The purpose of the PIV was not to measure the near-wall velocities, but instead was strictly used to measure the mean water speed through the channel. Moreover, the near-wall resolution of the PIV set-up was inadequate to accurately infer the effective slip length or slip velocity over the surfaces. As such the drag reduction reported is strictly based on the streamwise pressure drop through the channel, which is a well-understood method of characterizing the resistance of the fluid flow investigated.
For our system, drag reduction is defined as
 $$\begin{eqnarray}DR(\%)=2\times 100\left[\frac{C_{f,baseline}-C_{T,SHS}}{C_{f,baseline}}\right],\end{eqnarray}$$
where
 $C_{f}$
is the skin-friction coefficient, which for the hydrodynamically smooth baseline is the only drag component, i.e. form drag is zero for the hydrodynamically smooth baseline. To be consistent with the wettability analysis discussed in § 2.3,
 $C_{T,SHS}$
is used to denote the resistance coefficient for the SHS, which has both skin friction and an assumed form drag contribution.
 $C_{f,baseline}$
, and correspondingly
 $C_{T,SHS}$
, were inferred from the streamwise pressure gradient
 $\text{d}P/\text{d}x$
along one SHS and one baseline hydrodynamically smooth surface in a fully developed turbulent flow channel measuring 1.2 (
 $L$
)
 $\times$
0.1 (
 $W$
)
 $\times$
0.0073 m (
 $H$
). The height of the channel was nominally 0.0073 m. However, due to the presence of the SHS, systematic error associated with reassembling the test section and the thickness of each surface evaluated caused the height to vary by as much as 0.1 mm. To address this issue, the height of the channel was carefully measured at no less than five locations along the length of the test section using a set of precision gauge blocks and a bore gauge. The resulting heights for each test were recorded, averaged and used to analyse the performance of the SHS. Any anomalies were noted and corrected prior to testing. The error in the height measurement was estimated to be
 $\pm 0.05$
mm. The pressure drop was measured over a 0.5 m span (
 $70H$
), starting approximately (
 $50H$
) from the channel inlet, and was used to determine the average local wall shear stress
 $\unicode[STIX]{x1D70F}_{w}$
and wall shear velocity
 $u_{\unicode[STIX]{x1D70F}}$
, as shown in (3.3) and (3.4):
 $$\begin{eqnarray}\displaystyle & \displaystyle \unicode[STIX]{x1D70F}_{w}=-\frac{H}{2}\frac{\text{d}P}{\text{d}x}, & \displaystyle\end{eqnarray}$$
 $$\begin{eqnarray}\displaystyle & \displaystyle u_{\unicode[STIX]{x1D70F}}=\sqrt{\frac{\unicode[STIX]{x1D70F}_{w}}{\unicode[STIX]{x1D70C}}}. & \displaystyle\end{eqnarray}$$
 $C_{f}$
and (
 $C_{T,SHS}$
) is then given by (3.5):
 $$\begin{eqnarray}C_{f}=\frac{\unicode[STIX]{x1D70F}_{w}}{1/2\unicode[STIX]{x1D70C}U_{m}^{2}}.\end{eqnarray}$$
The factor of two in (3.2) arises as only one of the two channel walls is an SHS. This is equivalently the local skin-friction drag reduction on the SHS, whereas
 $\text{d}P/\text{d}x$
is the average pressure drop along the channel with one SHS surface and one hydrodynamically smooth surface. A similar scaling was observed by Daniello et al. (Reference Daniello, Waterhouse and Rothstein2009) using micro-fabricated parallel ridges. They observed
 ${\approx}25\,\%$
drag reduction in their channel using one SHS and one smooth plate, and
 ${\approx}50\,\%$
drag reduction in their channel using two SHSs. However, we note that the wall shear stresses measured here, for which drag reduction was still observed, are an order of magnitude greater than that of Daniello et al. (Reference Daniello, Waterhouse and Rothstein2009). The friction on the two side walls was neglected due to their small areas and negligible influence on the mean flow properties at the centre of the channel (Zanoun, Nagib & Durst Reference Zanoun, Nagib and Durst2009; Schultz & Flack Reference Schultz and Flack2013). Moreover, local wall shear stress along the top wall of the channel was derived from a simple control volume, constructed along the fully developed, two-dimensional flow region in the centre of the channel. A conservation of momentum analysis of this control volume indicated that shear on the side walls was negligible. Although including the side wall shear would provide a better idea of the overall frictional loss through the duct, this differs from the local shear along the SHS and would not be pertinent for turbulence scaling arguments.
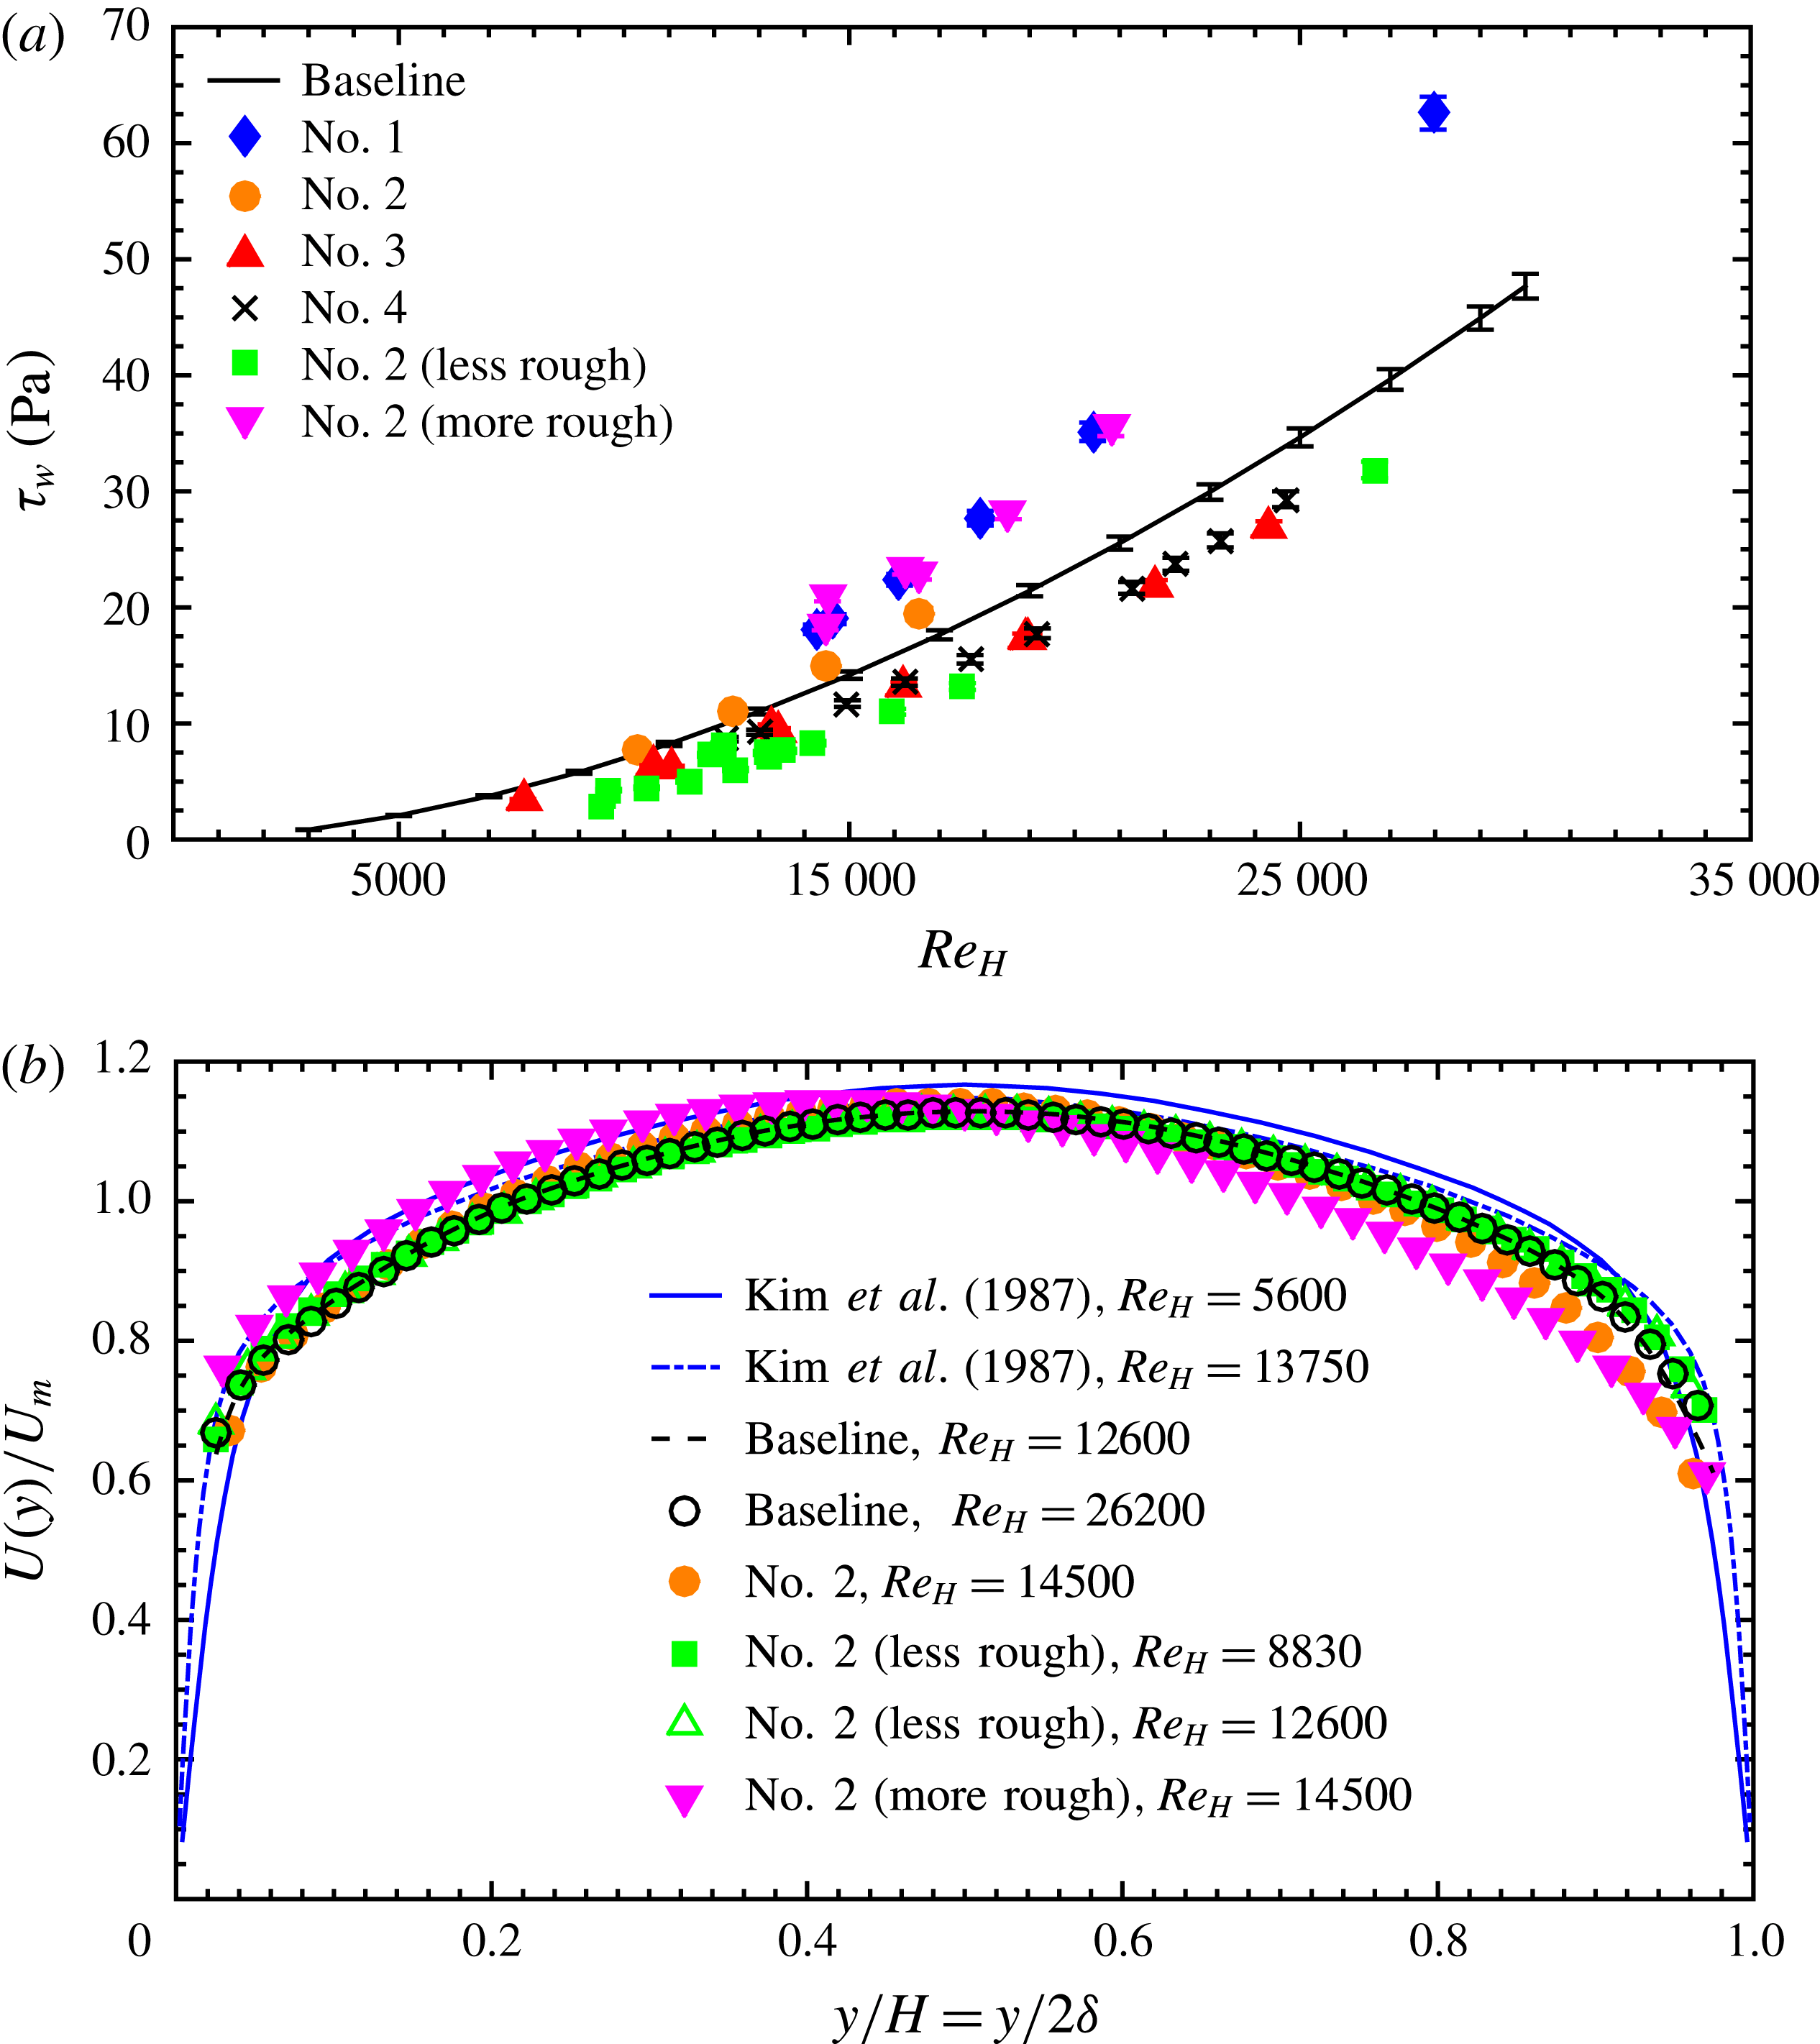
(a) Average wall shear stress calculated from the streamwise pressure drop along the fully developed turbulent channel with one baseline, hydrodynamically smooth surface and one SHS. The reduction in shear stress is only seen on some of the SHSs. (b) Velocity profiles measured over the baseline and the variations of SHS number 2. Significant reduction in the velocity occurs in the presence of the roughness elements on the rougher surface variations. DNS data from Kim, Moin & Moser (Reference Kim, Moin and Moser1987) are included for reference purposes.

Experimental (exp.) and calculated (calc.)
 $C_{T}$
values for surface numbers 1–4, denoted as panels (a–d). The calculated
 $C_{T}$
includes the skin friction expected for a hydrodynamically smooth flat plate as well as the total form drag due to any asperity roughness. The experimental
 $C_{T}$
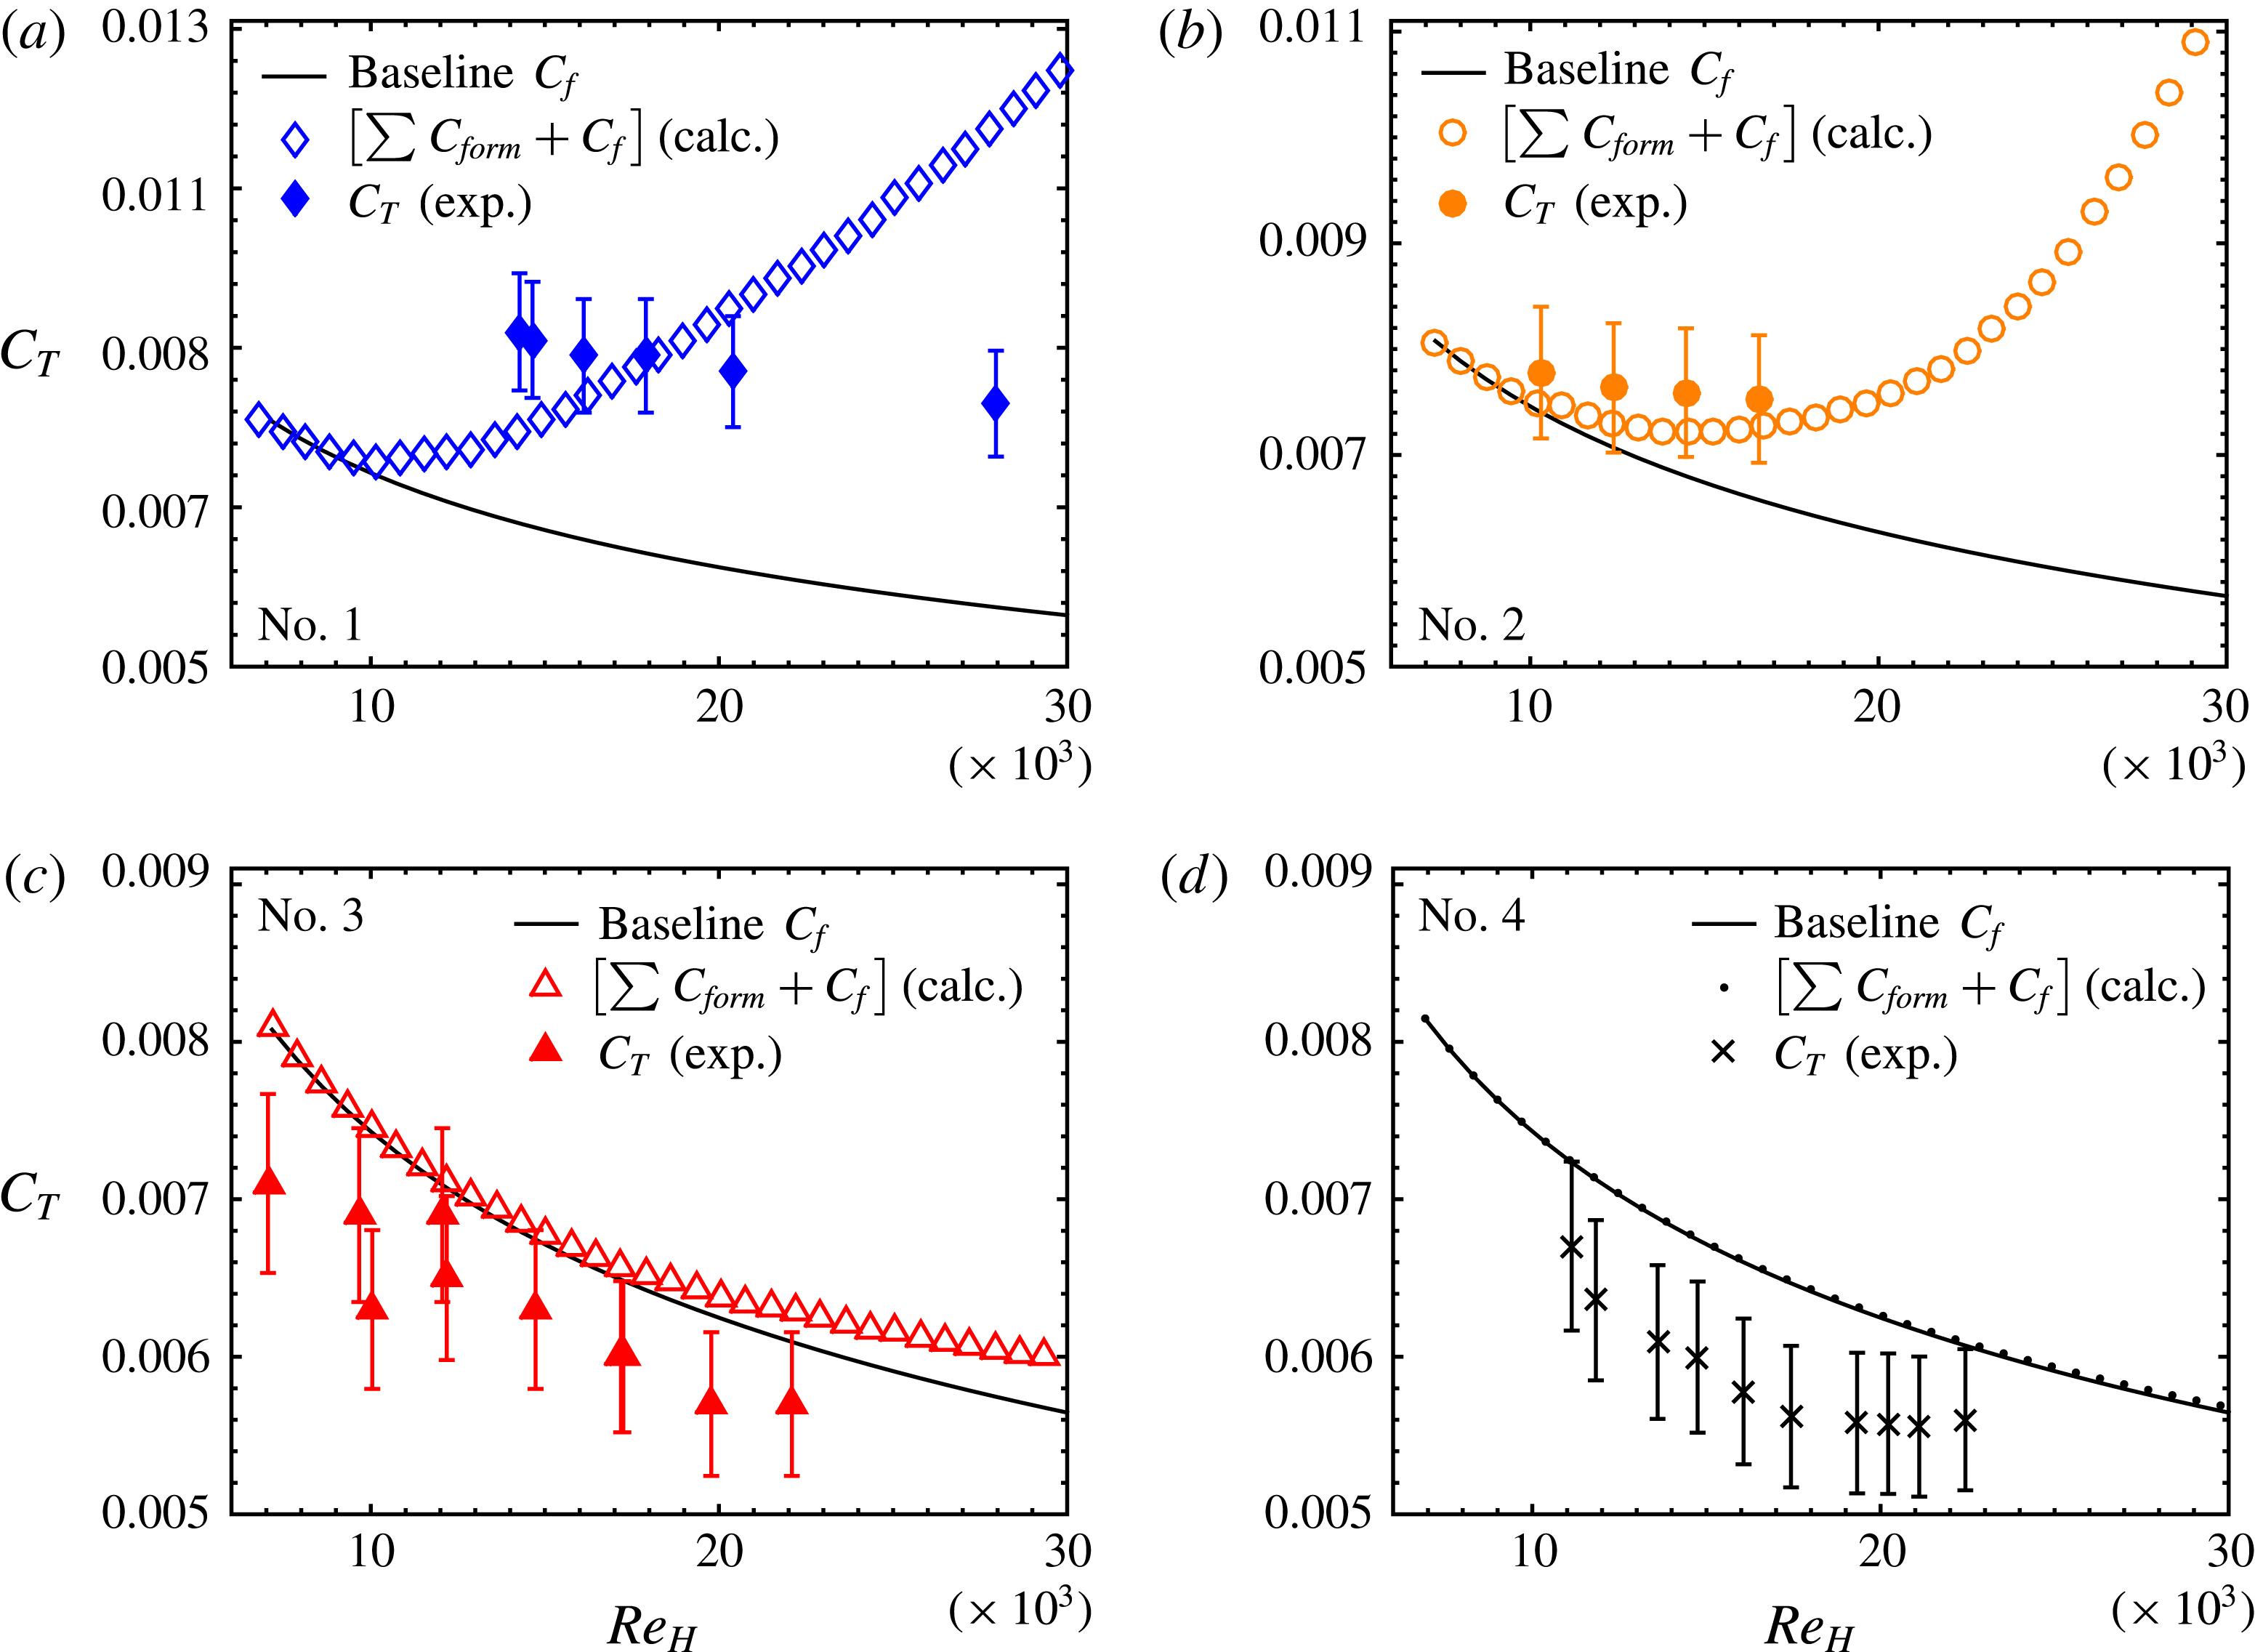
includes both asperity form drag and the skin-friction drag on the SHS. Therefore, these surfaces may still be producing skin-friction drag reduction locally, but the effect was sometimes mitigated by the overall increase in form drag (surface numbers 1 and 2).

4 Results and discussion
Figure 8 shows the wall shear stress for each of the SHSs and the velocity profiles from the PIV measurements for the baseline and all variations of surface number 2. Figure 9 presents the overall measured and calculated drag coefficients for surface numbers 1 to 4, while the more rough and less rough variants of surface number 2 are presented in figure 10(a). Again,
 $C_{T}$
for the SHSs, as referenced in figures 9 and 10, have contributions from both and is presented the sum of
 $C_{f}$
and a presumed form drag component, denoted as
 $\sum C_{form}=\sum _{i=1}^{n}C_{Di}=\left[\sum _{i=1}^{n}F_{Di}/\left(1/2~\unicode[STIX]{x1D70C}U_{m}^{2}\right)\right]$
. None of the SHSs were wetted following the high
 $Re_{H}$
flow testing, i.e. there was no loss of entrapped air. However, surface numbers 1 and 2 showed an increase in the wall shear stress and the overall measured drag coefficient
 $C_{T}$
(inferred from the pressure drop measurements), as shown in the top of figures 8 and 9. Thus, although the entrapped air pockets of surface numbers 1 and 2 provided a slip interface, the overall wall shear was increased, as shown in figure 8. On the other hand, surface numbers 3 and 4 showed significant drag reduction, as high as 34 % at a Reynolds number of 19 000, as shown in the bottom of figure 9. For surface numbers 3 and 4, the wall shear was significantly lower than that experienced by a hydrodynamically smooth baseplate. Using our form drag calculations, these results could be anticipated. The drag reduction was both sustainable over hours of continuous high-speed flow (
 $Re_{H}\approx 30\,000$
), and repeatable even after months separating successive runs of the same SHS. To date, in fully developed turbulence, i.e. where the necessary fluid flow development length (
 ${>}50H$
) requires the fabrication of large surfaces, scalable SHSs capable of reducing drag have rarely been evaluated.
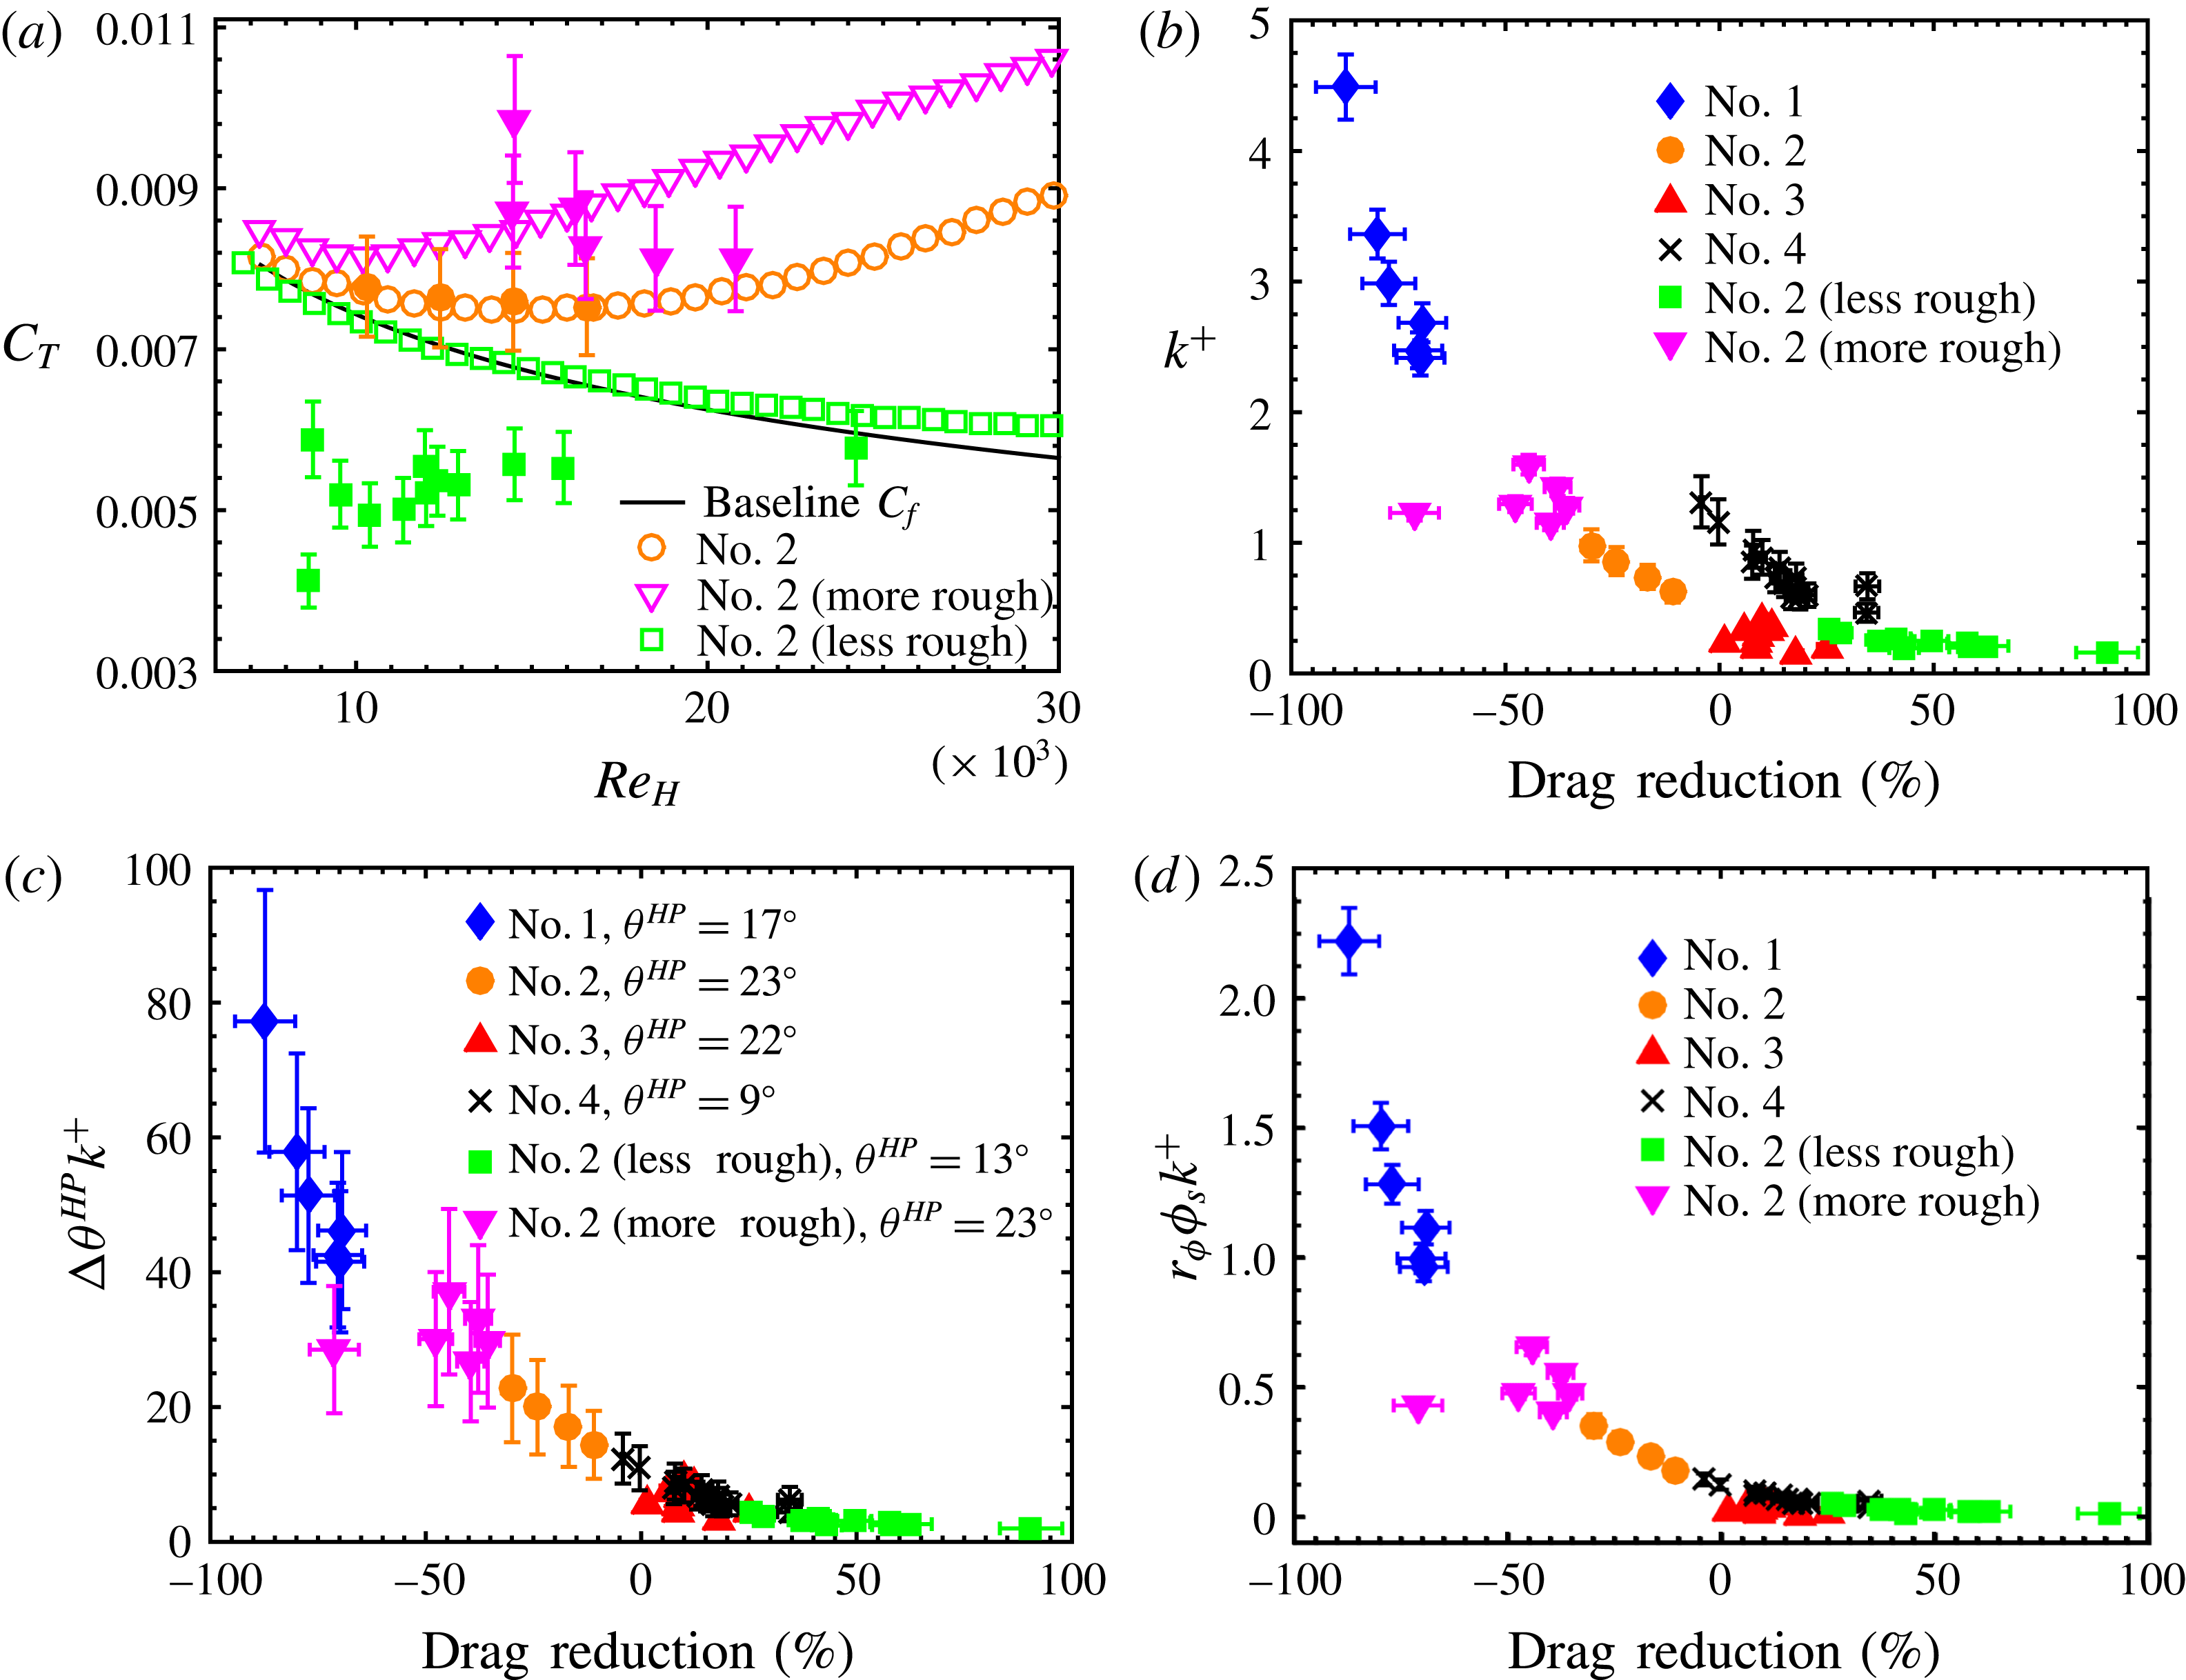
The effect of surface roughness. (a) Three variations of surface number 2, exhibiting either significant form drag, or significant drag reduction. Open symbols are the calculated
 $C_{T}$
values and closed symbols are the experimental data. The baseline is for the unmodified surface number 2. (b) The drag reduction or increase (negative means drag increase) provided by all the surfaces considered as a function of the non-dimensional roughness. Recall that the drag associated with the smooth baseplate has been removed. (c–d) The drag reduction data collapsed onto a single curve when plotted versus the product of the non-dimensional roughness and the higher-pressure contact angle hysteresis (370 Pa for a 250 nl droplet) or
 $r_{\unicode[STIX]{x1D719}}\unicode[STIX]{x1D719}_{s}$
.

Figure 9 shows the calculated values of
 $C_{T}$
, defined as the summation of the expected drag on a smooth plate (Zanoun et al.
Reference Zanoun, Nagib and Durst2009) and any additional form drag caused by the wetted roughness elements of the SHS. In contrast, the measured total drag coefficients are the summation of any form drag due to surface roughness, plus the frictional drag on the mixed slip/no-slip boundary condition SHS, as inferred from the streamwise pressure drop. For SHSs, the latter term could be significantly less than the frictional drag experienced on a smooth, no-slip surface. In this case, our calculated drag coefficients would over-predict the measured drag coefficients, as was observed for surface number 1 and the rougher variant of surface number 2. Thus, deviation between measured and calculated drag increase most likely indicates surface slip (which decreases drag) that is mitigated by surface roughness (which increases drag) and a large form drag contribution that should trend towards a value significantly greater than
 $C_{f,baseline}$
with increasing form drag contributions (
 $C_{D}$
was assumed to be 1.0 for the asperity roughness elements). In fact, form drag due to large, sparse (
 $\unicode[STIX]{x1D719}_{s}\leqslant 0.2$
) features has been shown to be the major component of total friction for certain texture geometries (Kanda et al.
Reference Kanda, Moriwaki and Kasamatsu2004; Leonardi et al.
Reference Leonardi, Orlandi and Antonia2007; Xie et al.
Reference Xie, Coceal and Castro2008; Leonardi & Castro Reference Leonardi and Castro2010). When the form drag did not nullify the decrease in frictional drag due to slip, drag reduction was observed. Some deviation in the calculated and measured
 $C_{T}$
is expected as these surfaces can in fact be altered by the fluid flow. Additionally, we have observed that larger, less firmly attached SHS roughness features can be removed from the surface at low water speeds if the particles used in the SHS fabrication are not adequately bonded to the substrate. This artefact may be apparent in the measured resistance of surface numbers 1 and 2 (more rough), where deviation in the measured and calculated values are observed.
The effects of roughness-induced resistance are demonstrated in figure 8, and later in figure 10(a). For this effort we slightly modified the fabrication methodology of surface number 2 (§ 2.2) to either increase or decrease the expected form drag, while maintaining the same surface chemistry. To increase asperity roughness, the total volume of sprayed solution was tripled. This surface is denoted surface number 2 (more rough). To decrease asperity roughness, the spray gun was replaced with an airbrush with a much finer nozzle (Golovin et al.
Reference Golovin, Lee, Mabry and Tuteja2013), resulting in smaller texture elements, and is denoted surface number 2 (less rough). All three variants of surface number 2 displayed
 $\unicode[STIX]{x1D703}^{\ast }$
ranging from
 $161^{\circ }$
to
 $167^{\circ }$
and
 $\unicode[STIX]{x0394}\unicode[STIX]{x1D703}<2^{\circ }$
, at ambient pressure.
Figure 8 shows effect of roughness examined through the results of the mean velocity profile in the fully developed channel flow. The PIV analysis of the hydrodynamically smooth, baseline channel is shown to be in good agreement with the mean velocity profiles from the direct numerical simulations (DNS) of Kim et al. (Reference Kim, Moin and Moser1987). However, significant deviation was observed when reviewing the results from the variations of surface number 2. Specifically, the maximum flow speed, which is typically located along the centreline of a symmetric, fully developed channel, shifted towards the hydrodynamically smooth baseline surface (
 $y=0$
) as the roughness of the SHS increased. From the streamwise conservation of mass and momentum, this necessarily dictated that the fluid speed decreased near the ‘rough’ wall, and consequently, the interaction with the roughness elements was increased. Ideally, if the roughness elements are small compared to the purely viscous sublayer, which is conventionally defined as five times the viscous length scale
 $\unicode[STIX]{x1D6FF}_{\unicode[STIX]{x1D708}}\equiv \unicode[STIX]{x1D708}/u_{\unicode[STIX]{x1D70F}}$
(Schlichting & Gersten Reference Schlichting and Gersten2000), no drag increase is expected. This was observed with the less rough variant of surface number 2. We see that for the smoother surface there is a slight decrease in the maximum velocity and a slight increase in flow speed near the SHS wall. The flow speed increase over the less rough SHS is not as large as expected, at least visually; however, the largest change in velocity for a friction reducing surface, when compared to a smooth wall, will occur in the viscous sublayer, which cannot be measured with the current PIV set-up. Alternatively, if the roughness elements are large enough to extend into or beyond the viscous sublayer, roughness effects will become significant. This is seen with surface number 2 and its rougher variant, which in a mean sense (based on
 $k$
) do not have roughness features extending beyond the viscous sublayer; however, they do have very large asperity roughness features measuring 100 to
 $200~\unicode[STIX]{x03BC}\text{m}$
across (a result of the fabrication method) that do protrude well beyond the buffer layer, typically defined as
 $5\unicode[STIX]{x1D6FF}_{\unicode[STIX]{x1D708}}$
to
 $70\unicode[STIX]{x1D6FF}_{\unicode[STIX]{x1D708}}$
(Schlichting & Gersten Reference Schlichting and Gersten2000). These very large asperity features, which can be numerous, may explain the significant slowing of the flow velocity at the rougher SHS surfaces, despite still being hydrodynamically smooth, based on
 $k$
being less than the height of the viscous sublayer.
The surface number 2 variations, with identical surface chemistry, but slightly different texture, were expected to produce drastically different resistance due to form drag effects, as was previously demonstrated in figure 8. When exposed to flow, the rougher variant of surface number 2 increased the wall shear and form drag significantly. Conversely, the less rough variant of surface number 2 produced significant of drag reduction. The drag savings measured in the channel were in excess of 60 % at lower Reynolds number, and spanned 26 to 90 % for the investigated Reynolds numbers ranging from 9500 to 18 000 (decreased savings with increased speeds). Note that, in our channel flow, for
 $U_{m}=1~\text{m}~\text{s}^{-1}$
, the mean pressure
 $P_{m}\approx 300$
Pa. For
 $U_{m}=5~\text{m}~\text{s}^{-1}$
,
 $P_{m}\approx 9000$
Pa, highlighting how increasing
 $Re_{H}$
can drastically alter the pressure exerted on the SHS. Regardless, it is clear that even before the surface is exposed to flow, the method described above can be used to predict the drag-reducing efficacy of an SHS a priori.
Conventionally, a surface is considered hydrodynamically smooth when
 $k^{+}\leqslant 5.0$
(Schlichting & Gersten Reference Schlichting and Gersten2000). Only when
 $k^{+}\geqslant 60$
is the surface considered fully rough (White Reference White2006). Several researchers have attempted to limit the allowable r.m.s. roughness
 $k$
of SHSs that are capable of producing turbulent drag reduction. By non-dimensionalizing
 $k$
with the viscous length scale
 $\unicode[STIX]{x1D6FF}_{\unicode[STIX]{x1D708}}$
, values of
 $k^{+}=k/\unicode[STIX]{x1D6FF}_{\unicode[STIX]{x1D708}}=0.1$
(Ünal et al.
Reference Ünal, Ünal and Atlar2012) and 0.5 (Bidkar et al.
Reference Bidkar, Leblanc, Kulkarni, Bahadur, Ceccio and Perlin2014) have been proposed as limits for SHS drag reduction, while 1.0 (Schultz & Flack Reference Schultz and Flack2007) has been proposed as a limit for when traditionally rough surfaces become noticeable. Using the height maps discussed in § 2.3 to calculate
 $k$
of the unwetted SHSs, in combination with
 $u_{\unicode[STIX]{x1D70F}}$
inferred from the pressure drop measurements, we determined
 $k^{+}$
for this effort. We observed drag reduction as high as 8 % when
 $k^{+}=0-0.95$
, and a drag increase of 19 % even when
 $k^{+}$
was as low as 0.11 (figure 10
b). This finding is indeed in agreement with others conclusions that the conventional definition of a hydrodynamically smooth surface does not apply to randomly rough SHSs; however, we demonstrate the
 $k^{+}$
alone cannot be used to determine SHS drag reduction. Additional explanation can be found in the computational work of Jelly et al. (Reference Jelly, Jung and Zaki2014). In their work, they found that over 70 % of the friction on the regions of no slip (wetted solid surfaces,
 $r_{\unicode[STIX]{x1D719}}\unicode[STIX]{x1D719}_{s}$
) was a direct result of the presence of the slip regions (air pockets,
 $1-\unicode[STIX]{x1D719}_{s}$
). Thus, the deleterious roughness effects of SHSs with
 $k^{+}\geqslant 1.0$
may be amplified by the entrapped air pockets. Moreover, as Min & Kim (Reference Min and Kim2004) have computed, and Woolford et al. (Reference Woolford, Prince, Maynes and Webb2009) has experimentally confirmed, entrapped air pockets that produce spanwise slip unambiguously increase drag. We found that a surface’s contact angle hysteresis, measured at higher pressure
 $\unicode[STIX]{x0394}\unicode[STIX]{x1D703}^{HP}$
, helped explain the increase in resistance for these SHSs. Whereas the conventional measurement of
 $\unicode[STIX]{x1D703}_{adv}^{\ast }$
and
 $\unicode[STIX]{x1D703}_{rec}^{\ast }$
always resulted in
 $\unicode[STIX]{x0394}\unicode[STIX]{x1D703}<5^{\circ }$
for all our surfaces, the higher-pressure measurement varied drastically between surfaces that increased or decreased drag. The product of
 $\unicode[STIX]{x0394}\unicode[STIX]{x1D703}^{HP}$
and
 $k^{+}$
collapsed all our drag measurements onto a single curve, as shown in figure 10(c). A similar collapse of the data was observed with the product of
 $k^{+}$
and the wetted solid surface area
 $r_{\unicode[STIX]{x1D719}}\unicode[STIX]{x1D719}_{s}$
, as calculated from
 $\unicode[STIX]{x1D703}^{\ast }$
of varying drop volumes and height map data as described in figure 3. This is to be expected, as
 $\unicode[STIX]{x0394}\unicode[STIX]{x1D703}^{HP}$
increases with increasing wetted area at elevated pressures. The advantage of the
 $\unicode[STIX]{x0394}\unicode[STIX]{x1D703}^{HP}k^{+}$
scaling parameter lies in its ease of measurement, as no height map data (only
 $k$
) or computation of the meniscus height are required. Note that these are empirical scaling laws, and products of other relevant quantities (
 $k$
,
 $\unicode[STIX]{x1D703}^{\ast }$
,
 $\unicode[STIX]{x1D703}_{adv}^{\ast }$
,
 $\unicode[STIX]{x1D703}_{rec}^{\ast }$
,
 $\unicode[STIX]{x1D719}_{s}$
, etc.) did not produce a collapse of the measured drag reduction.
It is perhaps unsurprising that the measured drag reduction using SHSs was dependent on both wettability and flow characteristics.
 $\unicode[STIX]{x0394}\unicode[STIX]{x1D703}^{HP}$
, which is not independent of
 $r_{\unicode[STIX]{x1D719}}\unicode[STIX]{x1D719}_{s}$
, gives some indication of the stability of the entrapped air pockets, but says nothing about how the flow will interact with these air pockets or the texture elements entrapping them. Conversely,
 $k^{+}$
designates if the roughness features will interact with the viscous sublayer, but gives no indication as to how much of the roughness the flow will see, i.e. where the meniscus will lie. For example, consider the nanograss evaluated in turbulent flow by Henoch et al. (Reference Henoch, Krupenkin, Kolodner, Taylor, Hodes, Lyons, Peguero and Breuer2006), which consisted of nano-posts with diameters of 400 nm and heights of
 $7~\unicode[STIX]{x03BC}\text{m}$
. If the height of such posts was significantly increased,
 $k^{+}$
would become extremely large. However, the flat meniscus pinned on the top of these posts ensures that the flow would be oblivious to this additional roughness. Moreover, in laminar flow, in which roughness effects are often negligible, minimizing
 $\unicode[STIX]{x0394}\unicode[STIX]{x1D703}$
has been shown previously to maximize drag reduction (Song, Daniello & Rothstein Reference Song, Daniello and Rothstein2014). We extend this finding to turbulent flow, with two additional stipulations: the pressure and the surface roughness must also be considered. Thus, it is clear that to maximize friction drag reduction in turbulent flow, SHSs should be designed such that both
 $k^{+}$
and
 $\unicode[STIX]{x0394}\unicode[STIX]{x1D703}^{HP}$
are minimized. In this work, we only observed a reduction in friction when
 $\unicode[STIX]{x0394}\unicode[STIX]{x1D703}^{HP}k^{+}\leqslant 8.9\pm 2.7$
.
5 Conclusions
In closing, we have fabricated scalable, mechanically robust superhydrophobic surfaces that significantly reduce skin friction, by more than 50 %, in high-speed turbulent flows such as those relevant to many naval applications. We did so by fabricating randomly rough SHSs that minimize the product of the non-dimensional roughness and the contact angle hysteresis measured at higher pressure. Only by considering both the wettability and the flow-dependent characteristics of these SHSs can turbulent drag reduction be achieved. The conventional characterization techniques for SHSs that do not consider the dynamic nature of the micro gas–liquid interfaces and will not predict if or when a randomly rough SHS can produce turbulent drag reduction. We have shown a significant increase in the wetted area of these SHSs at pressures realized in turbulent flows. The combination of surface roughness, wetted solid surface area and the form drag contributions from the heterogeneous, randomly rough surface significantly impact the resulting resistance of flow over an SHS.
Acknowledgements
This project was carried out as part of the US Office of Naval Research (ONR) MURI (Multidisciplinary University Research Initiatives) program (grant no. N00014-12-1-0874) managed by Dr K.-H. Kim and led by Dr S.L.C. We thank Dr C. Y. Lee and the US Air Force Office of Scientific Research (AFOSR) for financial support under grants FA9550-15-1-0329 and LRIR-12RZ03COR. Furthermore, we thank the National Science Foundation and the Nanomanufacturing program for supporting this work through grant no. 1351412. K.G. thanks the US Department of Defense (DoD) for a National Defense Science and Engineering Graduate (NDSEG) Fellowship.