



%20--%3e%3c!DOCTYPE%20svg%20PUBLIC%20'-//W3C//DTD%20SVG%201.0//EN'%20'http://www.w3.org/TR/2001/REC-SVG-20010904/DTD/svg10.dtd'%3e%3csvg%20version='1.0'%20id='Layer_1'%20xmlns='http://www.w3.org/2000/svg'%20xmlns:xlink='http://www.w3.org/1999/xlink'%20x='0px'%20y='0px'%20width='64px'%20height='64px'%20viewBox='5.5%20-3.5%2064%2064'%20enable-background='new%205.5%20-3.5%2064%2064'%20xml:space='preserve'%3e%3cg%3e%3ccircle%20fill='%23FFFFFF'%20fill-opacity='0'%20cx='37.785'%20cy='28.501'%20r='28.836'/%3e%3cpath%20fill='%23595959'%20d='M37.441-3.5c8.951,0,16.572,3.125,22.857,9.372c3.008,3.009,5.295,6.448,6.857,10.314%20c1.561,3.867,2.344,7.971,2.344,12.314c0,4.381-0.773,8.486-2.314,12.313c-1.543,3.828-3.82,7.21-6.828,10.143%20c-3.123,3.085-6.666,5.448-10.629,7.086c-3.961,1.638-8.057,2.457-12.285,2.457s-8.276-0.808-12.143-2.429%20c-3.866-1.618-7.333-3.961-10.4-7.027c-3.067-3.066-5.4-6.524-7-10.372S5.5,32.767,5.5,28.5c0-4.229,0.809-8.295,2.428-12.2%20c1.619-3.905,3.972-7.4,7.057-10.486C21.08-0.394,28.565-3.5,37.441-3.5z%20M37.557,2.272c-7.314,0-13.467,2.553-18.458,7.657%20c-2.515,2.553-4.448,5.419-5.8,8.6c-1.354,3.181-2.029,6.505-2.029,9.972c0,3.429,0.675,6.734,2.029,9.913%20c1.353,3.183,3.285,6.021,5.8,8.516c2.514,2.496,5.351,4.399,8.515,5.715c3.161,1.314,6.476,1.971,9.943,1.971%20c3.428,0,6.75-0.665,9.973-1.999c3.219-1.335,6.121-3.257,8.713-5.771c4.99-4.876,7.484-10.99,7.484-18.344%20c0-3.543-0.648-6.895-1.943-10.057c-1.293-3.162-3.18-5.98-5.654-8.458C50.984,4.844,44.795,2.272,37.557,2.272z%20M37.156,23.187%20l-4.287,2.229c-0.458-0.951-1.019-1.619-1.685-2c-0.667-0.38-1.286-0.571-1.858-0.571c-2.856,0-4.286,1.885-4.286,5.657%20c0,1.714,0.362,3.084,1.085,4.113c0.724,1.029,1.791,1.544,3.201,1.544c1.867,0,3.181-0.915,3.944-2.743l3.942,2%20c-0.838,1.563-2,2.791-3.486,3.686c-1.484,0.896-3.123,1.343-4.914,1.343c-2.857,0-5.163-0.875-6.915-2.629%20c-1.752-1.752-2.628-4.19-2.628-7.313c0-3.048,0.886-5.466,2.657-7.257c1.771-1.79,4.009-2.686,6.715-2.686%20C32.604,18.558,35.441,20.101,37.156,23.187z%20M55.613,23.187l-4.229,2.229c-0.457-0.951-1.02-1.619-1.686-2%20c-0.668-0.38-1.307-0.571-1.914-0.571c-2.857,0-4.287,1.885-4.287,5.657c0,1.714,0.363,3.084,1.086,4.113%20c0.723,1.029,1.789,1.544,3.201,1.544c1.865,0,3.18-0.915,3.941-2.743l4,2c-0.875,1.563-2.057,2.791-3.541,3.686%20c-1.486,0.896-3.105,1.343-4.857,1.343c-2.896,0-5.209-0.875-6.941-2.629c-1.736-1.752-2.602-4.19-2.602-7.313%20c0-3.048,0.885-5.466,2.658-7.257c1.77-1.79,4.008-2.686,6.713-2.686C51.117,18.558,53.938,20.101,55.613,23.187z'/%3e%3c/g%3e%3c/svg%3e)
%20--%3e%3c!DOCTYPE%20svg%20PUBLIC%20'-//W3C//DTD%20SVG%201.0//EN'%20'http://www.w3.org/TR/2001/REC-SVG-20010904/DTD/svg10.dtd'%3e%3csvg%20version='1.0'%20id='Layer_1'%20xmlns='http://www.w3.org/2000/svg'%20xmlns:xlink='http://www.w3.org/1999/xlink'%20x='0px'%20y='0px'%20width='64px'%20height='64px'%20viewBox='5.5%20-3.5%2064%2064'%20enable-background='new%205.5%20-3.5%2064%2064'%20xml:space='preserve'%3e%3cg%3e%3ccircle%20fill='%23FFFFFF'%20fill-opacity='0'%20cx='37.637'%20cy='28.806'%20r='28.276'/%3e%3cg%3e%3cpath%20fill='%23595959'%20d='M37.443-3.5c8.988,0,16.57,3.085,22.742,9.257C66.393,11.967,69.5,19.548,69.5,28.5c0,8.991-3.049,16.476-9.145,22.456%20C53.879,57.319,46.242,60.5,37.443,60.5c-8.649,0-16.153-3.144-22.514-9.43C8.644,44.784,5.5,37.262,5.5,28.5%20c0-8.761,3.144-16.342,9.429-22.742C21.101-0.415,28.604-3.5,37.443-3.5z%20M37.557,2.272c-7.276,0-13.428,2.553-18.457,7.657%20c-5.22,5.334-7.829,11.525-7.829,18.572c0,7.086,2.59,13.22,7.77,18.398c5.181,5.182,11.352,7.771,18.514,7.771%20c7.123,0,13.334-2.607,18.629-7.828c5.029-4.838,7.543-10.952,7.543-18.343c0-7.276-2.553-13.465-7.656-18.571%20C50.967,4.824,44.795,2.272,37.557,2.272z%20M46.129,20.557v13.085h-3.656v15.542h-9.944V33.643h-3.656V20.557%20c0-0.572,0.2-1.057,0.599-1.457c0.401-0.399,0.887-0.6,1.457-0.6h13.144c0.533,0,1.01,0.2,1.428,0.6%20C45.918,19.5,46.129,19.986,46.129,20.557z%20M33.042,12.329c0-3.008,1.485-4.514,4.458-4.514s4.457,1.504,4.457,4.514%20c0,2.971-1.486,4.457-4.457,4.457S33.042,15.3,33.042,12.329z'/%3e%3c/g%3e%3c/g%3e%3c/svg%3e)
1. Introduction
Buoyancy-driven flows of electrically conducting fluids under the influence of magnetic fields are a common occurrence in geophysical, astrophysical and several technological applications. Such flows are called magnetoconvection and their driving mechanism is the temperature dependence of the fluid density, which results in spatial density variations leading to buoyancy forces acting on the fluid. When such a fluid moves under the influence of magnetic fields, electric currents are induced in the fluid due to Faraday's law, which, in turn, induce magnetic fields via Ampère's law. These electric currents interact with the applied and induced magnetic fields to generate a Lorentz force distribution that acts on the fluid. Therefore, magnetoconvective flows are governed by equations of conservation of mass, momentum and thermal energy, along with Maxwell's equations for electromagnetism and Ohm's law (Weiss & Proctor Reference Weiss and Proctor2014). Magnetoconvection is encountered in the Sun, stars and planetary dynamos. In industries and technological applications, magnetoconvection is typically encountered in liquid-metal batteries (Kelley & Sadoway Reference Kelley and Sadoway2014; Shen & Zikanov Reference Shen and Zikanov2016; Kelley & Weier Reference Kelley and Weier2018), cooling liquid-metal blankets in fusion reactors (Mistrangelo, Bühler & Klüber Reference Mistrangelo, Bühler and Klüber2020; Mistrangelo et al. Reference Mistrangelo, Bühler, Smolentsev, Klüber, Maione and Aubert2021) and magnetic stirring and braking of liquid-metal melts (Davidson Reference Davidson1999, Reference Davidson2017; Lyubimov et al. Reference Lyubimov, Burnysheva, Benhadid, Lyubimova and Henry2010).
A simplified paradigm for magnetoconvection consists of a fluid layer that is heated from below and cooled from above (Rayleigh–Bénard convection) with imposed magnetic fields in different configurations. Typically, the Boussinesq approximation is employed for modelling the aforementioned flows; this approximation assumes that the flow is incompressible and the density variations are negligible except in the buoyancy term in the momentum equation (Chandrasekhar Reference Chandrasekhar1981; Lohse & Xia Reference Lohse and Xia2010; Chillà & Schumacher Reference Chillà and Schumacher2012; Verma Reference Verma2018). Magnetoconvection is governed by the following non-dimensional parameters: (i) Rayleigh number  ${\textit {Ra}}$ – the ratio of buoyancy to dissipative forces; (ii) Prandtl number
 ${\textit {Pr}}$ – the ratio of kinematic viscosity to thermal diffusivity; (iii) Hartmann number
 ${\textit {Ha}}$ – the ratio of Lorentz to viscous forces; and (iv) magnetic Prandtl number
 ${\textit {Pm}}$ – the ratio of kinematic viscosity to magnetic diffusivity. The important non-dimensional output parameters of magnetoconvection are (i) the Nusselt number
 ${\textit {Nu}}$ – the ratio of the total heat transport to the diffusive heat transport; (ii) the Reynolds number
 ${\textit {Re}}$ – the ratio of inertial to viscous forces; and (iii) the magnetic Reynolds number
 ${\textit {Rm}}$ – the ratio of induction to diffusion of the magnetic field. In liquid-metal convection typically encountered in laboratory experiments and most industrial applications, the magnetic Reynolds number is sufficiently small such that the induced magnetic field is negligible compared with the applied magnetic field and is thus neglected in the expressions of the Lorentz force and Ohm's law (Roberts Reference Roberts1967; Davidson Reference Davidson2017; Verma Reference Verma2019). Such cases are referred to as quasi-static magnetoconvection where the induced magnetic field adjusts instantaneously to the changes in velocity. In the quasi-static approximation, the magnetic Prandtl number vanishes and there exists a one-way influence of the magnetic field on the flow only.
Magnetoconvection has been studied theoretically in the past (e.g. Chandrasekhar Reference Chandrasekhar1954; Gershuni & Zhukhovitskii Reference Gershuni and Zhukhovitskii1958, Reference Gershuni and Zhukhovitskii1962; Shliomis Reference Shliomis1963, Reference Shliomis1964; Dunwoody Reference Dunwoody1964; Yih Reference Yih1965; Gershuni & Zhukhovitskii Reference Gershuni and Zhukhovitskii1976; Chandrasekhar Reference Chandrasekhar1981; Houchens, Witkowski & Walker Reference Houchens, Witkowski and Walker2002; Busse Reference Busse2008) as well as with the help of experiments (e.g. Nakagawa Reference Nakagawa1957; Fauve, Laroche & Libchaber Reference Fauve, Laroche and Libchaber1981; Cioni, Chaumat & Sommeria Reference Cioni, Chaumat and Sommeria2000; Aurnou & Olson Reference Aurnou and Olson2001; Burr & Müller Reference Burr and Müller2001; King & Aurnou Reference King and Aurnou2015; Vogt et al. Reference Vogt, Ishimi, Yanagisawa, Tasaka, Sakuraba and Eckert2018, Reference Vogt, Yang, Schindler and Eckert2021; Zürner et al. Reference Zürner, Schindler, Vogt, Eckert and Schumacher2020; Grannan et al. Reference Grannan, Cheng, Aggarwal, Hawkins, Xu, Horn, Sánchez-Álvarez and Aurnou2022) and numerical simulations (e.g. Liu, Krasnov & Schumacher Reference Liu, Krasnov and Schumacher2018; Yan et al. Reference Yan, Calkins, Maffei, Julien, Tobias and Marti2019; Akhmedagaev et al. Reference Akhmedagaev, Zikanov, Krasnov and Schumacher2020a,Reference Akhmedagaev, Zikanov, Krasnov and Schumacherb; Nicoski, Yan & Calkins Reference Nicoski, Yan and Calkins2022; Bhattacharya et al. Reference Bhattacharya, Boeck, Krasnov and Schumacher2023). An application of horizontal magnetic fields causes the large-scale rolls to become quasi-two-dimensional and align in the direction of the field (Fauve et al. Reference Fauve, Laroche and Libchaber1981; Busse & Clever Reference Busse and Clever1983; Burr & Müller Reference Burr and Müller2002; Yanagisawa et al. Reference Yanagisawa, Hamano, Miyagoshi, Yamagishi, Tasaka and Takeda2013; Tasaka et al. Reference Tasaka, Igaki, Yanagisawa, Vogt, Zürner and Eckert2016; Vogt et al. Reference Vogt, Ishimi, Yanagisawa, Tasaka, Sakuraba and Eckert2018, Reference Vogt, Yang, Schindler and Eckert2021). These self-organized flow structures reach an optimal state wherein the heat transport and convective velocities increase significantly compared with convection without magnetic fields (Vogt et al. Reference Vogt, Yang, Schindler and Eckert2021). In contrast, strong vertical magnetic fields suppress convection (Chandrasekhar Reference Chandrasekhar1981; Cioni et al. Reference Cioni, Chaumat and Sommeria2000; Akhmedagaev et al. Reference Akhmedagaev, Zikanov, Krasnov and Schumacher2020a,Reference Akhmedagaev, Zikanov, Krasnov and Schumacherb; Zürner et al. Reference Zürner, Schindler, Vogt, Eckert and Schumacher2020). It must be noted that in a Rayleigh–Bénard system, convection commences only above a certain critical Rayleigh number, which is  ${\textit {Ra}}_c\approx 1708$ for the case with infinite no-slip horizontal walls (Chandrasekhar Reference Chandrasekhar1981). For
 ${\textit {Ra}}<{\textit {Ra}}_c$, the heat transfer occurs purely by diffusion. The critical Rayleigh number increases when a vertical magnetic field is imposed and scales as
 ${\textit {Ra}}_c \sim {\textit {Ha}}^2$ in the asymptotic limit of large Hartmann numbers.
The dynamics of convection under strong vertical magnetic fields becomes more intricate in the presence of sidewalls. Houchens et al. (Reference Houchens, Witkowski and Walker2002) and Busse (Reference Busse2008) analytically showed that magnetoconvection near sidewalls ceases at Rayleigh numbers below those required to completely suppress convection in the bulk. Several numerical and experimental studies on magnetoconvection with sidewalls have also revealed the presence of residual wall-attached convection at  ${\textit {Ra}}<{\textit {Ra}}_c$ (Houchens et al. Reference Houchens, Witkowski and Walker2002; Liu et al. Reference Liu, Krasnov and Schumacher2018; Akhmedagaev et al. Reference Akhmedagaev, Zikanov, Krasnov and Schumacher2020a,Reference Akhmedagaev, Zikanov, Krasnov and Schumacherb; Zürner et al. Reference Zürner, Schindler, Vogt, Eckert and Schumacher2020; McCormack et al. Reference McCormack, Teimurazov, Shishkina and Linkmann2023). These so-called wall modes were shown to exhibit a two-layered structure and become more closely attached to the sidewalls with an increase of Hartmann number (Liu et al. Reference Liu, Krasnov and Schumacher2018).
There are only a few studies on convection with inclined magnetic fields which motivates the present work (Hurlburt, Matthews & Proctor Reference Hurlburt, Matthews and Proctor1996; Nicoski et al. Reference Nicoski, Yan and Calkins2022). The results of Hurlburt et al. (Reference Hurlburt, Matthews and Proctor1996) indicate that the mean flows tend to travel in the direction of the tilt. Nicoski et al. (Reference Nicoski, Yan and Calkins2022) observed qualitative similarities between convection with an inclined magnetic field and that with a vertical magnetic field in terms of the behaviour of convection patterns, heat transport and flow speed. However, to the best of our knowledge, there are no studies for the case with inclined magnetic fields where the Rayleigh number is close to but less than the critical Rayleigh number. Therefore, in the present work, we study thermal magnetoconvection in the wall-attached convection regime and explore the effects of additional horizontal magnetic fields on the wall modes. We use a combination of linear stability analysis and direct numerical simulations to study the dependence of the horizontal magnetic field strength, relative to the vertical magnetic field, on the wall-mode structures and their impact on large-scale heat and momentum transport.
The outline of the paper is as follows. In § 2, we discuss the problem set-up, the linear stability model and the schemes for direct numerical simulations. The linear stability analysis and the results of direct numerical simulations are described in § 3. We conclude in § 4.
2. Numerical model
In this section, we discuss the mathematical model of our problem and the numerics employed for the stability analysis and direct numerical simulations. A general set-up for our problem is illustrated in figure 1. The convection cell consists of a rectangular box having an aspect ratio of  $\varGamma$. The aspect ratio is the ratio of the length to the height of the convection cell. The box comprises rigid horizontal walls, with the bottom wall kept at a higher temperature than the top wall. Gravity acts along the
 $z$ direction (vertical direction), and a magnetic field
 $\boldsymbol {B}$ is imposed along the
 $z$ and the horizontal
 $y$ directions. The magnetic field does not have a component along the horizontal
 $x$ direction. The vertical component of the magnetic field (
 $B_z$) is kept fixed while the horizontal
 $y$ component (
 $B_y$) is varied from 0 to 3 times the value of
 $B_z$. In the forthcoming analyses, we denote
 $R=B_y/B_z$ as the ratio of the horizontal to the vertical components of the magnetic field.
A sketch of the Rayleigh–Bénard convection set-up with inclined magnetic field employed in our present study.

The study is conducted under the quasi-static approximation, in which the induced magnetic field is neglected as it is very small compared with the applied magnetic field. This approximation is fairly accurate for magnetoconvection in liquid metals (Davidson Reference Davidson2017). Further, we employ the Boussinesq approximation, in which the variations in the density of the fluid are ignored except in the buoyancy term in the momentum equation. Hence, the flow is essentially treated as incompressible. The governing equations of magnetoconvection under these approximations are as follows:
 $$\begin{gather} {\boldsymbol{\nabla}} \boldsymbol{\cdot} \boldsymbol{u}=0, \end{gather}$$
 $$\begin{gather}\frac{\partial \boldsymbol{u}}{\partial t} + \boldsymbol{u}\boldsymbol{\cdot} {\boldsymbol{\nabla}} \boldsymbol{u} =-\frac{{\boldsymbol{\nabla}} p}{\rho} + \alpha g T\hat{z}+ \nu\nabla^2 \boldsymbol{u}+ \frac{1}{\rho}(\,\boldsymbol{j} \times {\boldsymbol{B}}), \end{gather}$$
 $$\begin{gather}\frac{\partial T}{\partial t} + \boldsymbol{u} \boldsymbol{\cdot} {\boldsymbol{\nabla}} T = \kappa \nabla^2 T, \end{gather}$$
 $$\begin{gather}\boldsymbol{j} = \sigma \left(-{\boldsymbol{\nabla}} \phi + \boldsymbol{u} \times {\boldsymbol{B}}\right)\!, \end{gather}$$
 $$\begin{gather}\nabla^2 \phi = {\boldsymbol{\nabla}} \boldsymbol{\cdot} (\boldsymbol{u} \times {\boldsymbol{B}}), \end{gather}$$
where  $\boldsymbol {u}$,
 $\boldsymbol {j}$,
 $p$,
 $T$ and
 $\phi$ are the fields of velocity, current density, pressure, temperature and electrical potential, respectively. Further,
 $\nu$ is the kinematic viscosity,
 $\kappa$ is the thermal diffusivity,
 $\rho$ is the density,
 $\sigma$ is the electrical conductivity of the fluid and
 $\hat {z}$ is the unit vector along the vertical direction. The last term in the momentum equation (2.2) is the Lorentz force density. Equation (2.4) is Ohm's law. The Poisson equation (2.5) for the electric potential is a consequence of the charge conservation condition
 ${\boldsymbol {\nabla }}\boldsymbol {\cdot } \boldsymbol {j}=0$.
In the following, we discuss how the aforementioned equations have been employed for our linear stability analysis and direct numerical simulations.
2.1. Linear stability model
We first discuss the derivation of the perturbation equations for our linear stability analysis. Equations (2.1)–(2.5) are non-dimensionalized using the cell height  $H$ as the length scale,
 $\kappa /H$ as the velocity scale, the temperature difference
 $\varDelta$ between the two horizontal plates as the temperature scale and
 $B_z$, the vertical component of the applied magnetic field. Further, we write
 $T$ in terms of
 $\theta$, which is the difference between the temperature and the linear conduction profile, i.e.
 \begin{equation} T({\boldsymbol x},t)=\theta({\boldsymbol x},t) -z. \end{equation}
The non-dimensionalized governing equations are as follows:
 $$\begin{gather} \frac{1}{Pr}\left(\frac{\partial \boldsymbol{u}}{\partial t} + (\boldsymbol{u} \boldsymbol{\cdot}{{\boldsymbol{\nabla}}})\boldsymbol{u}\right) =- {{\boldsymbol{\nabla}} p} + {\nabla}^2 \boldsymbol{u} + {\textit{Ra}} \theta \boldsymbol{e}_z + {\textit{Ha}}_z^2 \kern0.2em \boldsymbol{j}\times\left( \boldsymbol{e}_z+R \boldsymbol{e}_y\right)\!, \end{gather}$$
 $$\begin{gather}\frac{\partial \theta}{\partial t} + (\boldsymbol{u} \boldsymbol{\cdot}{ {\boldsymbol{\nabla}}})\theta = {\nabla}^2 \theta +u_z, \end{gather}$$
 $$\begin{gather}{\boldsymbol{\nabla}} \boldsymbol{\cdot} \boldsymbol{u}= 0, \end{gather}$$
 $$\begin{gather}\boldsymbol{j}=-{\boldsymbol{\nabla}} \phi + \boldsymbol{u} \times \left(\boldsymbol{e}_z+ R \boldsymbol{e}_y\right)\!, \end{gather}$$
 $$\begin{gather}{\boldsymbol{\nabla}} \boldsymbol{\cdot} \boldsymbol{j} =0. \end{gather}$$
In the aforementioned system of equations,  ${\textit {Ra}}$ is the Rayleigh number,
 ${\textit {Pr}}$ is the Prandtl number and
 ${\textit {Ha}}_z$ is the Hartmann number based on the vertical component of the magnetic field. These quantities are given by
 \begin{equation} {\textit{Ra}} = \frac{\alpha g \Delta H^3}{\nu \kappa}, \quad {\textit{Pr}}= \frac{\nu}{\kappa}, \quad {\textit{Ha}}_z = B_z H\sqrt{\frac{\sigma}{\rho \nu}}. \end{equation}
The aforementioned quantities, along with  $R=B_y/B_z$, are the main governing parameters for our set-up. Apart from
 ${\textit {Ra}}$,
 ${\textit {Pr}}$,
 ${\textit {Ha}}_z$ and
 $R$, the dynamics is also governed by the aspect ratio
 $\varGamma$. In (2.8),
 $u_z$ appears as a consequence of the decomposition of temperature into the linear conduction profile and the fluctuation part
 $\theta$. It is to be noted that for the stability analysis, we take the units that are typically chosen so as to end with a Prandtl-number-independent set of equations at the marginal stability threshold. The characteristic units for the direct numerical simulations will differ.
The stability analysis is conducted for a convection cell which is periodic in the  $x$ direction and consists of no-slip horizontal walls at
 $z = \pm 1/2$ along with two no-slip sidewalls at
 $y= \pm \varGamma /2$. All the walls are electrically insulated. Each horizontal wall is at a constant temperature, with the bottom wall at
 $T=0.5$ and the top wall at
 $T=-0.5$. The sidewalls are thermally insulated with
 $\partial T/\partial \eta =0$, where
 $\eta$ is the direction normal to the wall. A sketch of our set-up is shown in figure 1.
In the present work we assume that the instability is of stationary type. It must be noted that an oscillatory instability can appear in magnetoconvection of an infinite layer (Chandrasekhar Reference Chandrasekhar1981) or in the bulk in the case of confined convection (Busse Reference Busse2008); however, this requires the condition of  ${\textit {Pm}}>{\textit {Pr}}$, where
 ${\textit {Pm}}$ is the magnetic Prandtl number. Since the present study deals with quasi-static magnetoconvection where
 ${\textit {Pm}} \rightarrow 0$, we do not expect any oscillatory instability to occur. The nonlinear terms as well as the time derivatives in (2.7) and (2.8) are therefore neglected. The momentum and continuity equations reduce to the Stokes problem with additional buoyancy and Lorentz force. To avoid complications stemming from the coupling between pressure and velocity we choose a representation for the velocity that satisfies the continuity equation automatically and eliminate the pressure term. The velocity field is written as the curl of a vector streamfunction
 $\boldsymbol {\psi }$,
 \begin{equation} \boldsymbol{u}={\boldsymbol{\nabla}} \times \boldsymbol{\psi}, \end{equation}
and the gauge condition  ${\boldsymbol {\nabla }}\boldsymbol {\cdot } \boldsymbol {\psi }=0$ is imposed to determine
 $\boldsymbol {\psi }$ uniquely as in Priede, Aleksandrova & Molokov (Reference Priede, Aleksandrova and Molokov2010). The dependence on
 $x$ is represented by the normal mode ansatz with wavenumber
 $\beta$ for all fields, e.g.
 $\theta (y,z)\exp ({\rm i}\beta x)$ for the temperature perturbation. The gauge condition allows one to express the
 $x$ component of
 $\boldsymbol {\psi }$ by
 \begin{equation} {\rm i} \beta \psi_x (y,z)=-\partial_y \psi_y(y,z)-\partial_z \psi_z(y,z). \end{equation}
The velocity components then read
 $$\begin{gather} u_x = \partial_y \psi_z -\partial_z \psi_y, \end{gather}$$
 $$\begin{gather}u_y =-{\rm i}\beta \psi_z +\frac{{\rm i}}{\beta}\left(\partial_y \partial_z\psi_y+\partial_z^2 \psi_z\right)\!, \end{gather}$$
 $$\begin{gather}u_z = {\rm i}\beta \psi_y -\frac{{\rm i}}{\beta}\left(\partial_y^2 \psi_y+\partial_y \partial_z \psi_z\right)\!. \end{gather}$$
Equations for  $\psi _y$ and
 $\psi _z$ are obtained by taking the curl of the definition (2.13) and the momentum equation (2.7). They are
 $$\begin{gather} 0=\nabla^2 \psi_y + \omega_y, \end{gather}$$
 $$\begin{gather}0=\nabla^2 \psi_z + \omega_z, \end{gather}$$
 $$\begin{gather}0=\nabla^2 \omega_y- {\rm i} \beta {\textit{Ra}} \theta +{\textit{Ha}}_z^2 \left(-\partial_y\partial_z \phi -\partial_z u_x+R\left(-\partial_y^2\phi+\omega_z-{\rm i}\beta u_y\right)\right)\!, \end{gather}$$
 $$\begin{gather}0=\nabla^2 \omega_z +{\textit{Ha}}_z^2 \left(-\partial_z^2 \phi +R\left(-\partial_y\partial_z\phi+\omega_y +{\rm i}\beta u_z +R \partial_y u_x\right)\right)\!. \end{gather}$$
The quantities  $\omega _y$ and
 $\omega _z$ are the
 $y$ and
 $z$ components of the vorticity field
 ${\boldsymbol {\nabla }}\times \boldsymbol {u}$. Equations for the remaining quantities are
 $$\begin{gather} 0=\nabla^2 \theta +u_z, \end{gather}$$
 $$\begin{gather}0=\nabla^2 \phi -\omega_z -R \omega_y. \end{gather}$$
Equation (2.23) is obtained by substitution of Ohm's law (2.10) into (2.11). Combined with boundary conditions on the top wall, bottom wall and sidewalls, (2.18)–(2.23) represent a linear eigenvalue problem for the Rayleigh number  ${\textit {Ra}}$ that must be solved numerically. A suitable discretization of this problem is obtained by a spectral collocation method with Chebyshev polynomials
 $T_n(z)=\cos \{n \arccos (z)\}$. The scalar fields such as
 $\theta$ are expanded as
 \begin{equation} \theta(y,z)=\sum_{i}\sum_{k} \theta_{ik} T_i(2y/\varGamma) T_k(2z), \end{equation}
where  $-\varGamma /2\le y\le \varGamma /2$ and
 $-1/2 \le z\le 1/2$. The Poisson equations (2.20)–(2.23) and boundary conditions are imposed pointwise at the Gauss–Lobatto collocation points:
 \begin{align} y_j=\varGamma\cos(\,j{\rm \pi}/N_y)/2\quad (0\le j \le N_y),\qquad z_k=\cos(k{\rm \pi}/N_z)/2 \quad (0\le k \le N_z), \end{align}
where  $N_y+1$ and
 $N_z+1$ are the number of expansion terms with respect to
 $y$ and
 $z$.
The boundary conditions for the vector streamfunction and vorticity components are determined with the help of (2.15)–(2.17). Zero normal velocity on the horizontal walls requires  $\psi _y=0$ and
 $\partial _z \psi _z=0$. On the
 $y=\pm \varGamma /2$ sidewalls, the corresponding conditions are
 $\psi _z=0$ and
 $\partial _y\psi _y=0$. The tangential velocity vanishes on the sidewalls if
 $\omega _y=0$ and
 $\partial _y\psi _z=\partial _z\psi _y$. On the top and bottom walls these conditions are
 $\omega _z=0$ and
 $\partial _y\psi _z=\partial _z\psi _y$. The remaining boundary conditions for (2.22) are
 $\theta =0$ on the top and bottom walls and
 $\partial _y\theta =0$ on the
 $y=\pm \varGamma /2$ sidewalls. The boundary condition for the electric potential supplementing equation (2.23) is the homogeneous Neumann condition.
Since the boundary conditions (zero normal velocity) for (2.18) and (2.19) only involve  $\psi _y$ and
 $\psi _z$, respectively, one can represent the expansion coefficients of
 $\psi _y$ and
 $\psi _z$ by linear invertible maps through those of
 $\omega _y$ and
 $\omega _z$ (assuming the latter are augmented by the zero boundary values to be imposed on either
 $\psi _y$,
 $\psi _z$ or its normal derivatives). The expansions for
 $\psi _y$ and
 $\psi _z$ therefore contain
 $N_y+3$ and
 $N_z+3$ terms, respectively. The values of
 $\psi _y$,
 $\psi _z$ or its derivatives in (2.20)–(2.23) (and associated boundary conditions) at the collocation points are represented through expansion coefficients of
 $\omega _y$ and
 $\omega _z$ via these linear invertible maps. The same can be done for the electric potential, which is the sum of a contribution from
 $\omega _z$ and
 $\omega _y$. As a result of the collocation approximation one obtains a vector
 $\boldsymbol {Y}$ of unknowns containing the expansion coefficients of
 $\omega _y$,
 $\omega _z$,
 $\theta$ with a size of
 $3 (N_y+1)(N_z+1)$ and a generalized linear eigenvalue problem
 \begin{equation} \boldsymbol{\mathcal{A}} \boldsymbol{Y} ={\textit{Ra}} \boldsymbol{\mathcal{B}} \boldsymbol{Y}. \end{equation}
The method was implemented in Matlab (The MathWorks Inc. 2022) using the default double precision. Notice that  $\omega _y$,
 $\omega _z$ and
 $\phi$ are real variables. According to (2.15)–(2.17) and (2.20)–(2.22),
 $u_y$,
 $u_z$ and
 $\theta$ would be purely imaginary quantities. They are considered as real variables in the code and in this work. Problem (2.26) was solved with Matlab's eig routine to find all eigenvalues and eigenvectors. The routine also works with a matrix
 $\boldsymbol {\mathcal {B}}$ whose rank is smaller than the rank of
 $\boldsymbol {\mathcal {A}}$ (as is the case for (2.26)). It associates the spurious solutions that stem from equations not containing the eigenvalue
 $Ra$ with infinite eigenvalues.
2.2. Direct numerical simulations
We conduct direct numerical simulations of our magnetoconvection set-up using a second-order finite-difference code developed by Krasnov, Zikanov & Boeck (Reference Krasnov, Zikanov and Boeck2011) and Krasnov et al. (Reference Krasnov, Akhtari, Zikanov and Schumacher2023). The governing equations are made dimensionless using the cell height  $H$, the imposed temperature difference
 $\varDelta$ and the free-fall velocity
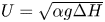 $U = \sqrt {\alpha g \Delta H}$. The following non-dimensional equations are employed for our direct numerical simulations:
 $$\begin{gather} {\boldsymbol{\nabla}} \boldsymbol{\cdot} \boldsymbol{u}=0, \end{gather}$$
 $$\begin{gather}\frac{\partial \boldsymbol{u}}{\partial t} + \boldsymbol{u}\boldsymbol{\cdot} {\boldsymbol{\nabla}} \boldsymbol{u} =-{\boldsymbol{\nabla}} p + T\hat{z}+ \sqrt{\frac{{\textit{Pr}}}{Ra}} \nabla^2 \boldsymbol{u}+ {\textit{Ha}}_z^2\sqrt{\frac{{\textit{Pr}}}{Ra}}(\,\boldsymbol{j} \times {\boldsymbol{B}}), \end{gather}$$
 $$\begin{gather}\frac{\partial T}{\partial t} + \boldsymbol{u} \boldsymbol{\cdot} {\boldsymbol{\nabla}} T = \frac{1}{\sqrt{Ra {\textit{Pr}}}}\nabla^2 T, \end{gather}$$
 $$\begin{gather}\boldsymbol{j} =-{\boldsymbol{\nabla}} \phi + (\boldsymbol{u} \times {\boldsymbol{B}}), \end{gather}$$
 $$\begin{gather}\nabla^2 \phi = {\boldsymbol{\nabla}} \boldsymbol{\cdot} (\boldsymbol{u} \times {\boldsymbol{B}}). \end{gather}$$
The mesh is non-uniform with stronger clustering of the grid points near the boundaries. The elliptic equations for pressure, electric potential and temperature are solved using a tridiagonal solver. The diffusive term in the temperature transport equation is treated implicitly. The time discretization of the momentum equation uses a semi-implicit Adams–Bashforth/backward-differentiation method of second order (Peyret Reference Peyret2002). A constant time step size ranging from  $5 \times 10^{-5}$ to
 $1 \times 10^{-4}$ free-fall time units was chosen for our simulations, which satisfied the Courant–Friedrichs–Lewy condition for our runs.
The horizontal walls are at  $z=\pm 1/2$ and the sidewalls are at
 $x=\pm \varGamma /2$ and
 $y=\pm \varGamma /2$. All the walls are rigid and electrically insulated such that the electric current density
 $\boldsymbol {j}$ forms closed field lines inside the cell. The top and bottom walls are held fixed at
 $T=-0.5$ and
 $T=0.5$, respectively, and the sidewalls are adiabatic with
 $\partial T/\partial \eta =0$ (where
 $\eta$ is the component normal to the sidewall). All the simulations are initialized with the linear conduction profile for temperature (which is a function of the
 $z$ coordinate only) and a random noise of amplitude
 $A=0.001$ along the
 $z$ direction for velocity. We run the simulations initially on a coarse grid of
 $120 \times 120 \times 30$ points for 100 free-fall time units in which they converge to a statistically steady state. Following this, we successively refine the mesh to the required resolutions (specified in § 2.3) and allow the simulations to converge after each refinement. Once the simulations reach the statistically steady state at the highest resolution, they are run for another 20 to 21 free-fall time units and a snapshot of the flow field is saved after every free-fall time unit.
Since all the walls are no-slip, thin velocity boundary layers are formed adjacent to the walls. For our simulations to be well-resolved, an adequate number of grid points need to be present in these boundary layers. It must be noted that the boundary-layer profiles are strongly influenced by the magnetic fields. For a purely vertical magnetic field, these boundary layers are categorized into Hartmann layers adjacent to the top and bottom walls and Shercliff layers adjacent to the sidewalls. The thickness of the Hartmann layers is given by  $\delta _H=1/{\textit {Ha}}_z$ and that for the Shercliff layers is given by
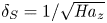 $\delta _S=1/\sqrt {{\textit {Ha}}_z}$. However, in our case, the magnetic field is inclined with respect to the vertical direction; therefore, both the horizontal walls and
 $y=\pm \varGamma /2$ sidewalls will have a mix of Hartmann and Shercliff layers. On the other hand, the
 $x=\pm \varGamma /2$ sidewalls will have pure Shercliff layers. Thus, we use
 $\delta$ only for representing the boundary-layer thickness. For a conservative analysis, the thicknesses of these boundary layers are estimated as follows:
 \begin{equation} \delta = \begin{cases} \min\left(\dfrac{1}{{\textit{Ha}}_z},\dfrac{1}{\sqrt{R{\textit{Ha}}_z}}\right), & \text{horizontal walls}, \\ \min\left(\dfrac{1}{\sqrt{{\textit{Ha}}_z}},\dfrac{1}{R{\textit{Ha}}_z}\right), & y={\pm}\varGamma/2\text{ sidewalls},\\ \dfrac{1}{({\textit{Ha}}_z^2(1+R^2))^{1/4}}, & x={\pm}\varGamma/2\text{ sidewalls}. \end{cases} \end{equation}
We ensure that a minimum of 10 points is present in the boundary layers so as to adequately resolve our simulation runs. In the following, we describe the cases examined for our stability analysis and numerical simulations.
2.3. Cases examined
For the stability analysis, we examine a total of 12 cases of magnetoconvection in a bounded, horizontally extended domain of dimension  $\varGamma \times 1$ in the
 $y$–
 $z$ plane. Two aspect ratios are considered:
 $\varGamma =2$ and
 $\varGamma =4$. For
 $\varGamma =2$, we consider the cases of
 ${\textit {Ha}}_z=50$ and
 ${\textit {Ha}}_z=100$, whereas for
 $\varGamma =4$, we consider only the case of
 ${\textit {Ha}}_z=50$. For each
 ${\textit {Ha}}_z$ analysed in our study, we vary
 $R$ from 0 (corresponding to a purely vertical magnetic field) to 3 in steps of 1. The numerical resolution was typically
 $N_y=70$,
 $N_z=60$ for
 $Ha_z=50$ and
 $N_y=90$,
 $N_z=70$ for
 $Ha_z=100$ with aspect ratio
 $\varGamma =2$. A decrease of
 $N_y$ by 10 typically only resulted in a relative change of the first eigenvalue below
 $10^{-5}$. The generation of the matrices and the solution of problem (2.26) for a given wavenumber took about 20 h for
 $N_y=90$,
 $N_z=70$ and about 6 h for
 $N_y=70$,
 $N_z=60$ on an Intel Xeon E5 CPU.
For the direct numerical simulations, we examine a total of 10 cases of magnetoconvection inside a domain of dimensions  $\varGamma \times \varGamma \times H = 4 \times 4 \times 1$. The Prandtl number
 ${\textit {Pr}}$ is chosen to be 0.025, which is the same as that of mercury. We choose two Hartmann numbers based on vertical magnetic field:
 ${\textit {Ha}}_z=100$ and
 ${\textit {Ha}}_z=200$. For these Hartmann numbers, the corresponding critical Rayleigh numbers (
 ${\textit {Ra}}_c$) for the case without horizontal walls obtained using the linear stability analysis of Chandrasekhar (Reference Chandrasekhar1981) are
 \begin{equation} {\textit{Ra}}_{c,\infty} = \begin{cases} 1.245 \times 10^5, & {\textit{Ha}}_z=100, \\ 4.48 \times 10^5, & {\textit{Ha}}_z=200. \end{cases} \end{equation}
Since we are interested in the wall-attached convection regime, we choose the Rayleigh number to be slightly below the critical Rayleigh numbers given by (2.33). Thus, the chosen Rayleigh numbers are  ${\textit {Ra}}=10^5$ for the case of
 ${\textit {Ha}}_z=100$ and
 ${\textit {Ra}}=4\times 10^5$ for the case of
 ${\textit {Ha}}_z=200$. For each
 ${\textit {Ha}}_z$, we choose
 $R=0$, 0.3, 1, 2 and 3. We employ a grid resolution ranging from
 $1200 \times 1200 \times 300$ points to
 $1800 \times 1800 \times 400$ points, ensuring that a minimum of 10 points are present in the velocity boundary layers. A total of 10 million CPU core-hours were employed for our simulations. Table 1 lists the important parameters of our simulation runs, in which we also report the number of points in the different velocity boundary layers. In the next section, we discuss the results obtained from our stability analysis and numerical simulations.
Parameters of the simulations: the Hartmann number ( ${\textit {Ha}}_z$) based on the vertical magnetic field, the Rayleigh number (
 ${\textit {Ra}}$), the ratio
 $R$ of the magnetic field strength along the horizontal to the vertical directions, the grid size and the number of points in the velocity boundary layers along the horizontal walls (
 $n_{z}$), the
 $y=\pm \varGamma /2$ sidewalls (
 $n_{y}$) and the
 $x=\pm \varGamma /2$ sidewalls (
 $n_{x}$). The Prandtl number is constant in all cases at a value of
 ${\textit {Pr}}=0.025$.

3. Results
In this section, we make a detailed analysis of the structure of the wall modes and their impact on the heat and momentum transport. We first present the linear stability analysis which is followed by a discussion of the results obtained from our direct numerical simulations.
3.1. Linear stability analysis
In this subsection, we discuss the results from our linear stability model. We assume that the set of finite positive eigenvalues of problem (2.26) is sorted in ascending order, i.e. the smallest one will be referred to as the first eigenvalue, etc.
In figure 2, we plot the first eigenvalue, denoted as Rayleigh number  ${\textit {Ra}}$, at which the instability sets in due to disturbances at wavenumber
 $\beta$ for different values of
 $R$. The minimum value of
 ${\textit {Ra}}$ is the critical Rayleigh number
 ${\textit {Ra}}_c$, and the wavenumber corresponding to
 ${\textit {Ra}}_c$ is the most unstable wavenumber. We also plot
 ${\textit {Ra}}$ for the infinite plane layer for the corresponding
 ${\textit {Ha}}_z$, where the flow is assumed to be uniform in the
 $y$ direction. The figure shows that
 ${\textit {Ra}}_c$ is smaller than that corresponding to the plane infinite layer (
 ${\textit {Ra}}_{c,\infty }$) for all
 $R$,
 ${\textit {Ha}}_z$ and aspect ratios considered in this study. This clearly implies that sidewalls destabilize the magnetoconvection system. Figure 3(a) exhibits the dependence of
 ${\textit {Ra}}_c$ on
 $R$ for different aspect ratios and strengths of the vertical magnetic field. It is evident from this figure that for
 $R<1$, the critical Rayleigh number increases for all aspect ratios. For the larger-aspect-ratio box (
 $\varGamma =4$),
 ${\textit {Ra}}_c$ continues to increase with
 $R$ beyond
 $R=1$ and saturates at
 $R=2$. On the other hand, for the smaller-aspect-ratio box, the critical Rayleigh number starts to decrease with
 $R$ for
 $R>1$, a trend that does not seem to depend on
 ${\textit {Ha}}_z$.
Neutral stability curves for magnetoconvection with different values of  $R$ for (a)
 $\varGamma =2$,
 ${\textit {Ha}}_z=50$; (b)
 $\varGamma =4$,
 ${\textit {Ha}}_z=50$; and (c)
 $\varGamma =2$,
 ${\textit {Ha}}_z=100$.

For  ${\textit {Ha}}_z=50$,
 $\varGamma =2$ (red squares);
 ${\textit {Ha}}_z=50$,
 $\varGamma =4$ (blue circles); and
 ${\textit {Ha}}_z=100$,
 $\varGamma =2$ (black triangles): (a) critical Rayleigh number
 ${\textit {Ra}}_c$, normalized with the same for infinite horizontal layer, and (b) the wavelength of the most unstable mode at
 ${\textit {Ra}}_c$.

In figure 3(b), we exhibit the plots of the most unstable wavelength  $\lambda$ versus
 $R$. The most unstable wavelength is calculated as
 \begin{equation} \lambda= \frac{2{\rm \pi}}{\beta_c}, \end{equation}
where  $\beta _c$ is the most unstable wavenumber. The figure shows that
 $\lambda$, like
 ${\textit {Ra}}_c$, exhibits a non-monotonic variation with
 $R$ and lies between 1.1 and 1.6 for the entire range of parameters considered in our study. For small values of
 $R$,
 $\lambda$ decreases with
 $R$ and for the larger-aspect-ratio box, it saturates at
 $R=2$. For the smaller-aspect-ratio box,
 $\lambda$ increases with increasing
 $R$ beyond
 $R=2$.
We now examine the behaviour of the first three eigenvalues ( ${\textit {Ra}}$) for our cases. In figure 4, we plot the variations of these eigenvalues with
 $\beta$. The neutral stability curves for the infinite plane convection layer for the corresponding
 ${\textit {Ha}}_z$ are also shown as dashed curves. For
 $R=0$, it can be seen in figure 4(a,e,i) that the minimum of the third eigenvalue (represented by green triangles) overlaps with that of the neutral stability curve for the plane convection layer. This indicates that the third eigenvalue corresponds to the onset of bulk convection for different wavenumbers. The figure also indicates that minimum of the third eigenvalue, which corresponds to the critical Rayleigh number for convection in the bulk, increases with
 $R$. This indicates that the bulk convection is further suppressed as the horizontal magnetic field increases.
Dependence of the first three eigenvalues on the wavenumber  $\beta$ for
 $\varGamma =2$ and
 ${\textit {Ha}}_z=50$ with (a)
 $R=0$, (b)
 $R=1$, (c)
 $R=2$ and (d)
 $R=3$; for
 $\varGamma =4$ and
 ${\textit {Ha}}_z=50$ with (e)
 $R=0$, (f)
 $R=1$, (g)
 $R=2$ and (h)
 $R=3$; and for
 $\varGamma =2$ and
 ${\textit {Ha}}_z=100$ with (i)
 $R=0$, (j)
 $R=1$, (k)
 $R=2$ and (l)
 $R=3$. Also shown are the neutral stability curves (dashed blue lines) for the corresponding infinite horizontal convection layer (
 $\varGamma =\infty$) with a purely vertical magnetic field (
 $R=0$). For the infinite plane layer, the flow is assumed to be uniform in the
 $y$ direction.

The first and second eigenvalues (denoted by black squares and red circles, respectively) correspond to wall-attached convection, and their minima are less than that for the third eigenvalue (corresponding to bulk convection). These eigenvalues nearly overlap for small horizontal magnetic fields but begin to diverge at large horizontal magnetic fields. These variations are shown more explicitly in figure 5 in which we exhibit the variations of the first two eigenvalues with  $R$ for
 $\beta =4$ (near the most unstable wavenumber). It is evident from the figure that the eigenvalues diverge visibly for
 $R>R_c\approx 1.5$ for
 $\varGamma =2$ and for
 $R>R_c \approx 2.5$ for
 $\varGamma =4$. It is interesting to note that the value of
 $R$ for which the eigenvalues begin to diverge does not seem to depend on
 ${\textit {Ha}}_z$.
Influence of (a) aspect ratio and (b) vertical Hartmann number on the stability curves for the first and second eigenvalues as a function of the ratio of the horizontal to vertical magnetic fields at fixed wavenumber  $\beta =4$.

We now examine the spatial structure of the wall modes, i.e. the eigenfunctions that correspond to the first and second eigenvalues. The eigenfunctions are normalized such that the maximum of the vertical velocity becomes equal to unity.
In figure 6, we exhibit the contour plots of the temperature perturbation  $\theta$ on the vertical
 $y$–
 $z$ plane corresponding to the first and second eigenvalues for
 $\beta =4$,
 $\varGamma =2$ and different
 ${\textit {Ha}}_z$ and
 $R$. Figures 6(a–d) and 6(i–l) correspond to the first eigensolutions for
 ${\textit {Ha}}_z=50$ and
 ${\textit {Ha}}_z=100$, respectively, whereas figures 6(e–h) and 6(m–p) correspond to the second eigensolutions. The figure shows that as the horizontal magnetic field strength is increased, the wall modes get elongated and tilt along the direction of the resultant magnetic field. In fact, for
 $R\geq 2$, the wall modes are no longer confined adjacent to the sidewalls; instead, they occupy almost the entire bulk and interact with each other as explained later in this section.
Eigenvector field from the linear stability analysis. Contours of the temperature deviation  $\theta$ are shown. For
 $\beta =4$,
 $\varGamma =2$ and
 ${\textit {Ha}}_z=50$: isocontours of
 $\theta$ corresponding to the first solution for (a)
 $R=0$, (b)
 $R=1$, (c)
 $R=2$ and (d)
 $R=3$. For
 $\beta =4$,
 $\varGamma =2$ and
 ${\textit {Ha}}_z=50$: isocontours of
 $\theta$ corresponding to the second solution for (e)
 $R=0$, (f)
 $R=1$, (g)
 $R=2$ and (h)
 $R=3$. For
 $\beta =4$,
 $\varGamma =2$ and
 ${\textit {Ha}}_z=100$: isocontours of
 $\theta$ corresponding to the first solution for (i)
 $R=0$, (j)
 $R=1$, (k)
 $R=2$ and (l)
 $R=3$. For
 $\beta =4$,
 $\varGamma =2$ and
 ${\textit {Ha}}_z=100$: isocontours of
 $\theta$ corresponding to the second solution for (m)
 $R=0$, (n)
 $R=1$, (o)
 $R=2$ and (p)
 $R=3$.

Figure 6 also shows that there are two types of spatial structures corresponding to the first two eigensolutions. The first type consists of a hot plume ( $\theta >0$) adjacent to the
 $y=-\varGamma /2$ sidewall and a cold plume (
 $\theta <0$) adjacent to
 $y=\varGamma /2$ sidewall; the corresponding eigensolution is referred to as antisymmetric solution (see figure 6a). The second type consists of cold (or hot) plumes adjacent to both the sidewalls; the corresponding eigensolution is referred to as symmetric solution (see figure 6e). For
 $R<1.5$, there is only a marginal difference between the symmetric (
 ${\textit {Ra}}_s$) and antisymmetric (
 ${\textit {Ra}}_a$) eigenvalues. As exhibited in figure 7, this difference is less than 0.5 % for
 $R<0.8$ and is approximately
 $10\,\%$ at
 $R=1.5$ for the case of
 ${\textit {Ha}}_z=50$ and
 $\varGamma =2$. Thus, for
 $R<1.5$, there is nearly an equal preference for symmetric and antisymmetric structures to develop at the onset of convection. However, these eigenvalues deviate significantly once
 $R$ exceeds the threshold
 $R_c \approx 1.5$, above which the eigenvalue corresponding to the symmetric solution becomes significantly smaller. This implies that there is a stronger preference for the symmetric structures to develop at the onset of convection for
 $R>R_c$. In this regime of
 $R$, the symmetric eigensolution comprises a large plume developed by the merging of two cold (or hot) plumes adjacent to the opposite walls as visible in figure 6(c,d,k,l). On the other hand, as seen in figure 6(g,h,o,p), the antisymmetric eigensolutions for
 $R > R_c$ comprise a cold plume extending on the top of a hot plume (or vice versa) extended from the opposite wall, resulting in two convection rolls on top of each other. Our observations imply that a clear separation of the symmetric and antisymmetric solutions occurs when the wall modes adjacent to the opposite walls for symmetric solutions start interacting with each other. The merging of the plumes and the resultant formation of a merged roll result in increased heat and momentum transport and hence in a decrease of the critical Rayleigh number.
Ratio of the difference between the critical Rayleigh numbers for antisymmetric solution ( ${\textit {Ra}}_a$) and the symmetric solution (
 ${\textit {Ra}}_s$) to the critical Rayleigh number of the symmetric solution. The inset exhibits a magnified version of the plot with
 $R$ ranging from 0 to 0.8. Parameters are
 $Ha_z=50$,
 $\varGamma =2$ and
 $\beta =4$.

Figure 8 exhibits the contour plots of  $\theta$ on vertical
 $y$–
 $z$ midplane corresponding to the first and second eigensolutions for
 $\varGamma =4$,
 $\beta =4$ and
 ${\textit {Ha}}_z=50$. This figure again shows that the wall modes tend to elongate along the direction of the resultant magnetic field. Similar to the
 $\varGamma =2$ cases, the two eigenvalues correspond to symmetric and antisymmetric solutions, respectively. The wall modes are symmetric for the first eigensolution and antisymmetric for the second. It can be recalled from figure 5(a) that the first and second eigenvalues for the
 $\varGamma =4$ box begin to diverge at a higher value of
 $R$ compared with the
 $\varGamma =2$ box. A clear separation occurs near
 $R_c \approx 2.5$; this is because, owing to the larger aspect ratio of the box, the plumes adjacent to opposite walls are able to interact and merge only at higher tilts, and hence at larger
 $R$. The merged plume is exhibited in figure 8(g) which displays the contours of
 $\theta$ corresponding to the symmetric solution for
 $R=3$.
Eigenvector field from the linear stability analysis. Contours of the temperature deviation  $\theta$ are shown. For
 ${\textit {Ha}}_z=50$,
 $\beta =4$ and
 $\varGamma =4$: isocontours of
 $\theta$ corresponding to the first eigensolutions for (a)
 $R=0$, (c)
 $R=1$, (e)
 $R=2$ and (g)
 $R=3$, and corresponding to second eigensolutions for (b)
 $R=0$, (d)
 $R=1$, (f)
 $R=2$ and (h)
 $R=3$.

Our analysis suggests that the non-monotonic behaviour of  ${\textit {Ra}}_c$ and wavelength
 $\lambda$ with respect to
 $R$ is due to the increasing interaction of the plumes on opposite sidewalls. As long as the opposite plumes do not merge, an increase in the horizontal magnetic field component further stabilizes the magnetoconvection system with
 ${\textit {Ra}}_c$ increasing and the wavelength
 $\lambda$ decreasing with
 $R$. The system gets destabilized due to the merging of the opposite plumes and the variations of
 ${\textit {Ra}}_c$ and
 $\lambda$ with
 $R$ get reversed. In the next subsection, we discuss the results of direct numerical simulations of the nonlinear evolution of magnetoconvection.
3.2. Results of direct numerical simulations
In this subsection, we analyse our steady-state direct numerical simulation results and examine the structures of the wall modes, their role in heat and momentum transport and the effects of initial conditions on the formation of the wall modes.
3.2.1. Structure of the wall modes
We use our numerical data to study the spatial convection structures for  ${\textit {Ha}}_z=100$ and
 ${\textit {Ha}}_z=200$ with
 $R$ ranging from 0 to 3.
In figure 9, we exhibit the isosurfaces of  $u_z = \pm 0.01$ for all our runs. In figure 10, we display the contours of
 $u_z \geq 0.01$ (red) and
 $u_z \leq -0.01$ (blue); these contours give a visualization of the upwelling and downwelling plumes, respectively. These figures show the presence of wall-attached convection with suppressed fluid flow in the bulk. The structure of the wall modes for
 $R=0$ is consistent with that observed in recent numerical simulations (Liu et al. Reference Liu, Krasnov and Schumacher2018; Akhmedagaev et al. Reference Akhmedagaev, Zikanov, Krasnov and Schumacher2020b; McCormack et al. Reference McCormack, Teimurazov, Shishkina and Linkmann2023) and experiments (Zürner et al. Reference Zürner, Schindler, Vogt, Eckert and Schumacher2020; Grannan et al. Reference Grannan, Cheng, Aggarwal, Hawkins, Xu, Horn, Sánchez-Álvarez and Aurnou2022) of thermal convection with strong vertical magnetic fields. However, the wall modes do not appear to oscillate or move along the sidewalls unlike those observed in rotating convection (see e.g. Horn & Schmid Reference Horn and Schmid2017; Zhang et al. Reference Zhang, van Gils, Horn, Wedi, Zwirner, Ahlers, Ecke, Weiss, Bodenschatz and Shishkina2020; Schumacher Reference Schumacher2022). Consistent with the results of the stability analysis in the previous subsection, these wall modes become elongated and align themselves along the direction of the resultant magnetic field as the horizontal magnetic field is increased. Figures 9 and 10 also show that with the exception of the case with
 ${\textit {Ha}}_z=100$ and
 $R=3$, the wall modes are antisymmetric, that is, the plumes are upwelling (or downwelling) adjacent to
 $y=-\varGamma /2$ wall and downwelling (or upwelling) adjacent to
 $y=\varGamma /2$ wall. The wall modes occupy the entire bulk for
 $R=3$, consistent with the stability analysis of the
 $\varGamma =4$ box. For the aforementioned field ratio, the wall modes for the
 ${\textit {Ha}}_z=100$ case are symmetric and the plumes adjacent to the opposite walls merge to form a large plume as displayed in figures 9(e) and 10(d).
Results of direct numerical simulations for the vertical velocity component. Isosurfaces of  $u_z=0.01$ (red) and
 $u_z=-0.01$ (blue) for
 $Ha_z=100$ with (a)
 $R=0$, (b)
 $R=0.3$, (c)
 $R=1$, (d)
 $R=2$ and (e)
 $R=3$, and for
 ${\textit {Ha}}_z=200$ with (f)
 $R=0$, (g)
 $R=0.3$, (h)
 $R=1$, (i)
 $R=2$ and (j)
 $R=3$.

Results of direct numerical simulations for the wall modes. Contours of  $u_z \geq 0.01$ (red) and
 $u_z \leq -0.01$ (blue) along with the vector plots of
 $\boldsymbol {B}$ on
 $x=0$ midplane for
 $Ha_z=100$ with (a)
 $R=0$, (b)
 $R=1$, (c)
 $R=2$ and (d)
 $R=3$, and for
 ${\textit {Ha}}_z=200$ with (e)
 $R=0$, (f)
 $R=1$, (g)
 $R=2$ and (h)
 $R=3$. The wall modes align themselves along the direction of
 $\boldsymbol {B}$.

It can also be observed in figure 9 that there are slight irregularities in the wall-mode structures. These irregularities seem to be associated with small temporal fluctuations ( ${\sim }1\,\%$) in integral quantities that remain after our simulations reach an apparently stationary state. These fluctuations indicate that the wall modes are still evolving, albeit slowly. However, it is important to note that we could not observe any noticeable change in the structures of the wall modes over the time span of our simulations. Any change in the spatial arrangement of the modes is likely to be visible only after the simulations are run for several times the diffusion time scale, which is
 ${\sim }10^3$ free-fall time units. Hence, our solutions can be considered to be effectively steady.
We estimate the wavelength of the wall modes by visual inspection of the vertical velocity isosurfaces in figure 9. We consider only those wall modes that are adjacent to  $y=\pm \varGamma /2$ sidewalls; these walls are not parallel to the resultant magnetic field. The estimation of the wavelength is done as follows. We count the number of upwelling (or downwelling) plumes adjacent to both
 $y=-\varGamma /2$ and
 $y=\varGamma /2$ sidewalls and calculate their average as
 $N_{p}$. The wavelength
 $\lambda _{wm}$ of the wall modes is given by
 \begin{equation} \lambda_{wm} = \frac{\varGamma}{N_p}. \end{equation}
We plot the estimated  $\lambda _{wm}$ versus
 $R$ in figure 11. The figure shows that
 $\lambda _{wm}$ tends to decrease as the horizontal magnetic field increases and saturates at large
 $R$. It can be recalled that a similar trend was observed in the variation of the most unstable wavelength with
 $R$ in our stability analysis in § 3.1. Further, the wavelength corresponding to
 ${\textit {Ha}}_z=200$ is smaller than that for
 ${\textit {Ha}}_z=100$ except for
 $R=3$. This trend is similar to that of the threshold wavelength in the bulk which decreases with increasing vertical magnetic field strength (Chandrasekhar Reference Chandrasekhar1981). However, it must be kept in mind that since the Rayleigh numbers considered in our direct numerical simulations are higher than the threshold Rayleigh number above which the wall modes appear, there is always a chance for secondary modes with smaller wavenumbers to develop.
Variations of the wavelength  $\lambda _{wm}$ of the wall modes with
 $R$. The wavelength tends to decrease with an increase in the horizontal magnetic field.

3.2.2. Heat and momentum transport
We now explore the influence of the wall modes on heat and momentum transport. We compute the Nusselt number ( ${\textit {Nu}}$) and the Reynolds number (
 ${\textit {Re}}$) using our numerical data as follows:
 $$\begin{gather} {\textit{Nu}} = 1 + \sqrt{{\textit{Ra}} {\textit{Pr}}}\langle u_zT \rangle_V, \end{gather}$$
 $$\begin{gather}{\textit{Re}} = \sqrt{\frac{{\textit{Ra}}}{{\textit{Pr}}}}U_{rms}, \end{gather}$$
where  $U_{rms} = \sqrt {\langle u_x^2 + u_y^2 + u_z^2 \rangle _V}$ is the root-mean-square velocity and
 $\langle {\cdot} \rangle _V$ denotes volume averaging. The second term on the right-hand side of (3.3) is the normalized convective heat flux. We plot the normalized heat flux and the Reynolds number versus
 $R$ for all our runs in figures 12(a) and 12(b), respectively. The figures show that for
 $R<1$, both
 ${\textit {Nu}}$ and
 ${\textit {Re}}$ decrease with
 $R$. This is consistent with our conclusion from the stability analysis in § 3.1 that for small values of
 $R$, an increase in the horizontal magnetic field results in the stabilization of the magnetoconvection system. There is, however, no clear trend in the variations of
 ${\textit {Nu}}$ and
 ${\textit {Re}}$ for
 $R>1$.
Plots of (a) the non-dimensional convective heat flux  ${\textit {Nu}}-1$ and (b) the Reynolds number
 ${\textit {Re}}$ versus
 $R$. For
 $R \leq 1$, the heat and momentum transport decreases as
 $R$ is increased.

Having studied the trends of the global heat and momentum transport with  $R$, we now explore the spatial variation of heat and momentum transport for different regimes of
 $R$. In figure 13(a–e), we plot twice the kinetic energy
 $E=(u_x^2 + u_y^2 + u_z^2)/2$, averaged over the
 $x$–
 $z$ plane, versus
 $y$, which is the direction parallel to the horizontal magnetic field. For
 $R=0$, there are two sharp peaks close to
 $y=-2$ and
 $y=2$ for both
 ${\textit {Ha}}_z=100$ and
 ${\textit {Ha}}_z=200$; these peaks correspond to the wall modes. The bulk region lies between these two peaks. The bulk consists of several smaller peaks and the kinetic energy in this region is much less compared with the near-wall regions. As
 $R$ is increased, the heights of the near-wall peaks decrease and of those in the bulk increase. Thus, the distribution of kinetic energy along
 $y$ becomes more uniform as
 $R$ is increased. It is a known fact that in magnetohydrodynamic flows, the Lorentz force tends to modify the flow field so as to minimize the gradients of velocity along the direction of the magnetic field (Davidson Reference Davidson2017). Thus, in our case, as
 $R$ is increased, the Lorentz force generated due to the
 $y$ component of the magnetic field becomes strong and suppresses the gradients of velocity along
 $y$.
Spatial distribution of kinetic energy  $E$ and the convective heat flux
 $u_zT$. Plots of
 $2\langle E \rangle _{x,z}=\langle u_x^2 + u_y^2 + u_z^2 \rangle _{x,z}$ for (a)
 $R=0$, (b)
 $R=0.3$, (c)
 $R=1$, (d)
 $R=2$ and (e)
 $R=3$. Plots of
 $\langle u_zT \rangle _{x,z}$ for (f)
 $R=0$, (g)
 $R=0.3$, (h)
 $R=1$, (i)
 $R=2$ and (j)
 $R=3$. Here,
 $\langle \cdot \rangle _{x,z}$ represents averaging over the
 $x$–
 $z$ plane.

In figure 13(f–j), we plot the local convective heat flux  $u_zT$, averaged over the
 $x$–
 $z$ plane, along
 $y$. Although the volume-averaged heat flux is positive in thermal convection, the local heat flux for
 $R=0$ fluctuates between positive and negative values as one proceeds along
 $y$. These fluctuations even out as
 $R$ is increased, and for
 $R=3$, the local heat flux remains positive throughout with very small gradients along
 $y$. Again, this is due to the strong Lorentz forces generated by the horizontal component of the magnetic field which suppresses the gradients of velocity along the magnetic field's direction.
In figure 14(a–e), we plot twice the kinetic energy, averaged over the  $y$–
 $z$ plane, versus
 $x$, which is the direction perpendicular to the horizontal magnetic field. In the absence of horizontal magnetic field (
 $R=0$), the variation of
 $2\langle E \rangle _{y,z}$ versus
 $x$ is similar to that of
 $2\langle E \rangle _{x,z}$ versus
 $y$ due to the symmetry of the problem. Again, there are two sharp peaks corresponding to the wall modes close to
 $x=-2$ and
 $x=2$ for both
 ${\textit {Ha}}_z=100$ and
 ${\textit {Ha}}_z=200$. However, unlike
 $\langle E \rangle _{x,z}$, the values of
 $\langle E \rangle _{y,z}$ at the peaks recede only marginally as
 $R$ is increased from 0 to 2. As the wall modes extend fully into the bulk at
 $R=3$, the aforementioned peaks recede sharply with the value of
 $2\langle E \rangle _{y,z}$ at these peaks being close to the values at the peaks in the bulk. It must be noted that
 $\langle E \rangle _{y,z}$ continues to fluctuate as it is varied with
 $x$ at
 $R=3$ and does not smoothen out unlike
 $\langle E \rangle _{x,z}$.
Spatial distribution of kinetic energy  $E$ and the convective heat flux
 $u_zT$. Plots of 2
 $\langle E \rangle _{y,z}=\langle u_x^2 + u_y^2 + u_z^2 \rangle _{y,z}$ for (a)
 $R=0$, (b)
 $R=0.3$, (c)
 $R=1$, (d)
 $R=2$ and (e)
 $R=3$. Plots of
 $\langle u_zT \rangle _{y,z}$ for (f)
 $R=0$, (g)
 $R=0.3$, (h)
 $R=1$, (i)
 $R=2$ and (j)
 $R=3$. Here,
 $\langle \cdot \rangle _{y,z}$ represents averaging over the
 $y$–
 $z$ plane.

Figure 14(f–j) exhibits the variations of the local convective heat flux  $u_zT$, averaged over the
 $y$–
 $z$ plane, along
 $x$. The figure shows that
 $\langle u_zT \rangle _{y,z}$ fluctuates between positive and negative values. It is clear from the figure that for the
 ${\textit {Ha}}_z=100$ case, the spatial fluctuations increase with increasing
 $R$. This is because, as discussed before, the gradients along the
 $y$ direction are reduced as
 $R$ is increased. Therefore, for large
 $R$, if the gradients along
 $z$ are also small, any quantity averaged over the
 $y$–
 $z$ plane will fluctuate between the quantity's two extremes. The case of
 $R=3$ for
 ${\textit {Ha}}_z=100$ consists of plumes from the opposite
 $y=\pm \varGamma$ walls merged with each other; therefore, the gradients of the velocity, temperature and heat flux along the
 $z$ direction are small. Thus,
 $\langle u_zT \rangle _{y,z}$ exhibits strong fluctuations along the
 $x$ direction at
 $R=3$.
For  ${\textit {Ha}}_z=200$ and
 $R \leq 2$,
 $\langle u_zT \rangle _{y,z}$ follows a similar trend in that its fluctuations increase with increasing
 $R$. However, for
 $R=3$, its fluctuations get suppressed and
 $\langle u_zT \rangle _{y,z}$ is mostly positive. Now, let us recall that unlike in the case of
 ${\textit {Ha}}_z=100$, the structures for the case of
 ${\textit {Ha}}_z=200$ are antisymmetric. Thus, although the gradients along the
 $y$ direction are small, there are fluctuations along the
 $z$ direction for
 ${\textit {Ha}}_z=200$ due to the presence of upwelling and downwelling plumes on top of each other. An averaging over the
 $y$–
 $z$ plane cancels out the opposing effects of the upwelling and downwelling plumes, thus resulting in the suppression of fluctuations of
 $\langle u_zT \rangle _{y,z}$.
Finally, we analyse the contributions of the bulk and near-wall regions to the total kinetic energy and heat flux of the system. Towards this objective, we define the near-wall region as follows. For  $R=0$ and for both Hartmann numbers, we determine
 ${\textit {Nu}}_S$, which is the Nusselt number averaged over successively smaller concentric volumes
 $S=\varGamma \times [r_y, \varGamma -r_y] \times 1$. In this definition,
 $r_y$ is the normal distance from the
 $y=\pm \varGamma /2$ sidewalls, c.f. (3.3). We plot
 ${\textit {Nu}}_S$ versus
 $r_y$ in figure 15. The figure shows that
 ${\textit {Nu}}_S$ initially decreases with
 $r_y$ up to a point of local minima and then begins to increase with
 $r_y$. The distance between the point of the local minima and the sidewall is taken as the width
 $\delta _w$ of the near-wall region. These widths are computed to be
 $\delta _w=0.37$ for
 ${\textit {Ha}}_z=100$ and
 $\delta _w=0.33$ for
 ${\textit {Ha}}_z=200$. It is to be noted that
 $\delta _w=3.7 \delta$ for
 ${\textit {Ha}}_z=100$ and
 $\delta _w=4.7 \delta$ for
 ${\textit {Ha}}_z=200$, where
 $\delta$, computed using (2.32), is the thickness of the boundary layers formed near the sidewalls. The aforementioned relationship of the thickness of the near-wall region with the boundary-layer thickness is close to that observed by Liu et al. (Reference Liu, Krasnov and Schumacher2018), who reported
 $\delta _w=3.47 \delta$. Finally, we point out that although we compute the values of
 $\delta _w$ for
 $R=0$, these values are assumed to hold for all
 $R$.
Determination of the near-wall region for our analysis from the results of our direct numerical simulations for  $R=0$. Variation of the Nusselt number
 ${\textit {Nu}}_S$ averaged over successively smaller concentric volumes with the sidewall-normal distance
 $r_y$. The width of the near-wall region is given by the point of the first minimum (represented as black dashed vertical line for
 ${\textit {Ha}}_z=100$ and blue dashed vertical line for
 ${\textit {Ha}}_z=200$) in the
 ${\textit {Nu}}_S$ profile.

The total kinetic energy  $\mathcal {E}$ and the convective heat flux
 $\mathcal {H}$ can be expressed as the sum of their bulk and near-wall contributions. Therefore,
 $$\begin{gather} \mathcal{E} = \mathcal{E}_{bulk} + \mathcal{E}_{nw}, \end{gather}$$
 $$\begin{gather}\mathcal{H} = \mathcal{H}_{bulk} + \mathcal{H}_{nw}, \end{gather}$$
where  $\mathcal {E}_{bulk}$ and
 $\mathcal {E}_{nw}$ are, respectively, the bulk and near-wall contributions to the total kinetic energy and
 $\mathcal {H}_{bulk}$ and
 $\mathcal {H}_{nw}$ are, respectively, the bulk and near-wall contributions to the total heat flux. The total and bulk contributions to these quantities are defined as
 $$\begin{gather} \mathcal{E} = \frac{1}{2} \int_{-\varGamma/2}^{\varGamma/2} \int_{-\varGamma/2}^{\varGamma/2} \int_{-1/2}^{1/2} (u_x^2 + u_y^2 + u_z^2)\,\mathrm{d}z \, \mathrm{d}y \, \mathrm{d}\kern0.06em x, \end{gather}$$
 $$\begin{gather}\mathcal{E}_{bulk} = \frac{1}{2} \int_{-\varGamma/2+\delta_w}^{\varGamma/2-\delta_w} \int_{-\varGamma/2+\delta_w}^{\varGamma/2-\delta_w} \int_{-1/2}^{1/2} (u_x^2 + u_y^2 + u_z^2)\, \mathrm{d}z \, \mathrm{d} y \, \mathrm{d}\kern0.06em x, \end{gather}$$
 $$\begin{gather}\mathcal{H} = \int_{-\varGamma/2}^{\varGamma/2} \int_{-\varGamma/2}^{\varGamma/2} \int_{-1/2}^{1/2} u_zT \, \mathrm{d}z \, \mathrm{d} y \, \mathrm{d}\kern0.06em x, \end{gather}$$
 $$\begin{gather}\mathcal{H}_{bulk} = \int_{-\varGamma/2+\delta_w}^{\varGamma/2-\delta_w} \int_{-\varGamma/2+\delta_w}^{\varGamma/2-\delta_w} \int_{-1/2}^{1/2} u_zT \, \mathrm{d}z \, \mathrm{d} y \, \mathrm{d}\kern0.06em x. \end{gather}$$
We compute the relative strengths of the bulk and near-wall kinetic energies and heat fluxes using our numerical data and plot them versus  $R$ in figure 16. For small values of
 $R$, the bulk contribution to the total kinetic energy and heat flux is very small (less than 10 %). This is expected because convection is completely suppressed in the bulk at small
 $R$. It is clear from the figure that as
 $R$ increases, the bulk contributions to the total kinetic energy and heat flux increase. This is due to the fact that the wall modes extend further into bulk as
 $R$ increases. In fact, for
 $R>2$, the bulk and sidewall contributions become comparable to each other because the wall modes at such high values of
 $R$ extend fully into the bulk. It is also interesting to note that for
 ${\textit {Ha}}_z=100$, the bulk contribution to the heat flux decreases as
 $R$ is increased from 2 to 3. To explain this anomalous behaviour, let us re-examine figure 14(j) which exhibits the plots of
 $\langle u_zT \rangle _{y,z}$ versus
 $x$ for both
 ${\textit {Ha}}_z=100$ and
 ${\textit {Ha}}_z=200$ with
 $R=3$. As discussed earlier, the plot for
 ${\textit {Ha}}_z=100$ fluctuates strongly between positive and negative values in the bulk; however, for
 ${\textit {Ha}}_z=200$,
 $\langle u_zT \rangle _{y,z}$ is mostly positive with reduced fluctuations. Recall that this difference in the plots’ characteristics has been attributed to the merging of the plumes along the opposite walls for
 ${\textit {Ha}}_z=100$, which was not observed for
 ${\textit {Ha}}_z=200$. Thus, for
 ${\textit {Ha}}_z=100$, the net heat flux in the bulk gets reduced because the positive and negative fluctuations of
 $\langle u_zT \rangle _{y,z}$ tend to cancel each other out. On the other hand, for
 ${\textit {Ha}}_z=200$,
 $\langle u_zT \rangle _{y,z}$ remains mostly positive and hence adds up to a larger net heat flux in the bulk.
Results of direct numerical simulations. Relative strengths of the bulk and boundary-layer contributions to the total kinetic energy  $\mathcal {E}$ for (a)
 ${\textit {Ha}}_z=100$ and (b)
 ${\textit {Ha}}_z=200$ and to the total heat flux
 $\mathcal {H}$ for (c)
 ${\textit {Ha}}_z=100$ and (d)
 ${\textit {Ha}}_z=200$. The bulk contributions to kinetic energy and heat flux increase with increasing
 $R$.

3.2.3. Effects of initial conditions
The direct numerical simulations of magnetoconvection for  $R=3$ resulted in different structural arrangements of the convection plumes for
 ${\textit {Ha}}_z=100$ and
 ${\textit {Ha}}_z=200$. On the one hand, we obtained a symmetric arrangement of the plumes adjacent to the opposite walls merging with each other for
 ${\textit {Ha}}_z=100$. On the other hand, an antisymmetric arrangement of the plumes was obtained for
 ${\textit {Ha}}_z=200$ with the upwelling and downwelling plumes on top of each other. In this subsection, we explore the sensitivity of these results to initial conditions.
We conduct two more direct numerical simulations of magnetoconvection for  $R=3$; one with
 ${\textit {Ha}}_z=100$,
 ${\textit {Ra}}=10^5$, and the other with
 ${\textit {Ha}}_z=200$,
 ${\textit {Ra}} = 4 \times 10^5$. However, we change the initial conditions in this set of simulations as follows. The results of the previous simulation of
 ${\textit {Ha}}_z=200$ are taken as the initial condition for the new simulation of
 ${\textit {Ha}}_z=100$. In the same way, the results of the previous simulation of
 ${\textit {Ha}}_z=100$ are taken as the initial condition for the new simulation of
 ${\textit {Ha}}_z=200$. Both these simulations were allowed to run for 20 free-fall time units after reaching the steady state. Henceforth, we refer to the previous set of simulations as IC1 and the new set of simulations of
 $R=3$ as IC2.
We examine the structure of the wall modes for the new set of simulations by plotting the vertical velocity isosurfaces for  $u_z = \pm 0.01$ in figure 17(a,c). The figure shows that the simulation of
 ${\textit {Ha}}_z=100$ with the new initial conditions yields an antisymmetric arrangement of structures with upwelling and downwelling plumes on top of each other. This is unlike the result of the simulation with previous initial conditions which resulted in a symmetric arrangement of structures with merged plumes. Similarly, the simulation of
 ${\textit {Ha}}_z=200$ with the new initial conditions yields symmetric structures with merged plumes, unlike the case with previous initial conditions which resulted in an antisymmetric arrangement of structures. Our results indicate that that the solution of magnetoconvection with
 $R=3$ for
 ${\textit {Ha}}_z=100$ and 200 is non-unique, and the arrangement of the wall modes depends on the initial conditions.
Results of direct numerical simulations with initial conditions IC2. Isosurfaces of  $u_z=0.01$ (red) and
 $u_z=-0.01$ (blue) for
 $R=3$ and (a)
 $Ha_z=100$ and (c)
 ${\textit {Ha}}_z=200$. For comparison, the vertical velocity isosurfaces using results of the simulations of
 $R=3$ with initial conditions IC1 are shown for (b)
 ${\textit {Ha}}_z=100$ and (d)
 ${\textit {Ha}}_z=200$.

We now explore the impact of the arrangement of the plumes on the global heat and momentum transport. In figure 18, we replot the computed values of  ${\textit {Nu}}-1$ and
 ${\textit {Re}}$ for our runs with the previous initial conditions and also add the plots of these quantities computed using the results of our simulations with new initial conditions. The figure shows that for
 ${\textit {Ha}}_z=200$, the Reynolds and Nusselt numbers computed using the solutions of simulations with new initial conditions are significantly higher than those corresponding to the previous initial conditions. On the other hand, for
 ${\textit {Ha}}_z=100$, the Reynolds and Nusselt numbers computed using the solutions of simulations with new initial conditions are lower, albeit marginally, than those corresponding to the previous initial conditions. The aforementioned observations clearly indicate that the solutions that are symmetric consisting of merged plumes have higher heat and momentum transport. This is because merged plumes give rise to larger convection rolls which, in turn, result in more efficient transport of heat and momentum. It is worth noting that for
 ${\textit {Ha}}_z=200$, the increase of Reynolds number at
 $R=3$ due to the merged plumes is so significant that its value is larger than that for
 $R=0$.
Results of direct numerical simulations including those using the new initial conditions (filled markers) along with those using the previous initial conditions (open markers). Plots of (a) the non-dimensional convective heat flux  ${\textit {Nu}}-1$ and (b) the Reynolds number
 ${\textit {Re}}$ versus
 $R$. The heat and momentum transport for the case of
 ${\textit {Ha}}_z=200$,
 $R=3$ is significantly more for IC2 compared with IC1.

Our results indicate that the non-unique nature of the solutions for  $R=3$ has a profound effect on the heat and momentum transport, especially for
 ${\textit {Ha}}_z=200$. However, we must remember that as mentioned in § 3.2.1, the wall modes are still evolving albeit at a very slow rate. Therefore, we may still observe a discernable change in the wall-mode structure if the simulations are made to run for several diffusive time units (
 ${\sim }10^3$ free-fall time units), which brings up the possibility of our solutions ultimately becoming independent of initial conditions. Unfortunately, we were unable to run our simulations for such a long time due to limited computational resources. We conclude in the next section.
4. Summary and conclusions
In this paper, we systematically examined the effects of strong inclined magnetic fields on wall-attached magnetoconvection using a combination of linear stability analysis and direct numerical simulations. The linear stability analysis was conducted for lower Hartmann numbers whereas the direct numerical simulations were performed for higher Hartmann numbers, both at aspect ratios  $2\le \varGamma \le 4$. The ratio
 $R=B_y/B_z$ of the outer imposed horizontal to vertical magnetic field was varied from 0 to 3.
The linear stability analysis revealed that the critical Rayleigh number varies non-monotonically with the relative strength of the horizontal magnetic field. The plumes at the onset of instability get elongated along the direction of the resultant magnetic field and extend more into the bulk as  $R$ is increased. At sufficiently high
 $R$, the plumes extend fully into the bulk. The linear stability analysis further revealed the existence of non-unique solutions at the onset of convection at low
 $R$. One eigensolution corresponds to a symmetric arrangement of hot or cold plumes adjacent to the opposite sidewalls, whereas the other eigensolution corresponds to an antisymmetric arrangement of hot or cold plumes. For the symmetric solution, when the opposite plumes extend sufficiently into the bulk at a large
 $R$, they merge into a single large plume. Below this critical value of
 $R=R_c$, the symmetric and antisymmetric eigensolutions overlap; however, at
 $R>R_c$, these solutions start to diverge with the symmetric eigensolution being more unstable than the antisymmetric solution. The critical Rayleigh number increases with
 $R$ for
 $R< R_c$ and decreases with
 $R$ for
 $R>R_c$.
The direct numerical simulations of the fully nonlinear regime reinforced the observation from the linear stability analysis that the wall modes get elongated along the direction of the resultant magnetic field and extend further into the bulk as  $R$ is increased. The heat and momentum transport was observed to decrease with
 $R$ for
 $R<1$ but did not show any visible trend for
 $R>1$. The fluctuations of the local heat flux and kinetic energy along the direction of the horizontal magnetic field get suppressed as
 $R$ is increased. Since the wall modes extend more into the bulk as
 $R$ is increased, the relative contributions to the total heat transport and kinetic energy by the near-wall regions decrease with an increase of
 $R$.
The analysis from direct numerical simulations further revealed that at least for  $R=3$, the solutions are dependent on the initial conditions. The solutions for
 $R=3$ can consist of either an antisymmetric arrangement of upwelling and downwelling plumes on top of each other, or a symmetric arrangement of merged upwelling or downwelling plumes. The solution with merged plumes corresponds to higher heat and momentum transport because the merged plumes give rise to larger convection rolls and hence more efficient heat transfer.
Our present work provides important insights into the dynamics of wall-attached convection under inclined magnetic fields which will be a typical situation in most applications. Our work may find applications in several industrial flows such as cooling blankets in fusion reactors. Although we worked on a small set of parameters, we expect our results to hold for higher Rayleigh numbers as well. In the future, we plan to conduct a similar analysis for fluids at different Prandtl numbers.
Acknowledgements
The authors thank M.K. Verma and M. Brynjell-Rahkola for useful discussions. The authors acknowledge the computing time provided by Leibniz Supercomputing Center, Garching, Germany, under the project ‘pn49ma’. The authors further acknowledge the Computing Center of Technische Universität Ilmenau for the resources provided to them for the linear stability computations as well as for the postprocessing and visualization of the simulation data.
Funding
The work of S.B. is sponsored by a Postdoctoral Fellowship of the Alexander von Humboldt Foundation, Germany.
Declaration of interests
The authors report no conflict of interest.


 Open access

