1. Introduction
Turbulent/turbulent interfaces (TTIs) arise when adjacent regions with different turbulent properties interact. For instance, jets, wakes or boundary layers under free stream turbulence exhibit TTIs at the interface between the turbulent environment and the internal turbulent structure of the flow. These are thought to be extremely relevant to the processes of mass, momentum and scalar exchanges between the adjacent turbulent regions (da Silva et al. Reference da Silva, Hunt, Eames and Westerweel2014a ). Their study stems from developments in understanding of the so-called turbulent/non-turbulent interfaces (TNTIs), where a turbulent region is surrounded by irrotational flow (da Silva et al. Reference da Silva, Hunt, Eames and Westerweel2014a ).
Recently, TTIs were shown to exist by Kankanwadi & Buxton (Reference Kankanwadi and Buxton2020) and, since then, experimental studies (Kankanwadi & Buxton Reference Kankanwadi and Buxton2022; Kohan & Gaskin Reference Kohan and Gaskin2022; Chen & Buxton Reference Chen and Buxton2023; Chen & Buxton Reference Chen and Buxton2024; Kohan & Gaskin Reference Kohan and Gaskin2024) and direct numerical simulation (DNS) (Nakamura, Watanabe & Nagata Reference Nakamura, Watanabe and Nagata2023) have focused on unveiling some of their characteristics. It was revealed that, in the context of turbulent entrainment, turbulence intensity has a paramount role in imposing the dynamics of entrainment in the far-field of cylinder wakes (Kankanwadi & Buxton Reference Kankanwadi and Buxton2020) and of axisymmetric jets (Kohan & Gaskin Reference Kohan and Gaskin2022), while the integral length scale is more relevant in dictating the entrainment characteristics in the near-field (Chen & Buxton Reference Chen and Buxton2023). When analysing the dynamics of enstrophy,
 $\omega _i\omega _i/2$
(where
 $\omega _i\equiv {\epsilon _{ijk}}\partial u_k/\partial x_j$
is the vorticity vector and
 $u_i$
is the velocity vector), a diminished role of the viscous diffusion mechanism is reported (Kankanwadi & Buxton Reference Kankanwadi and Buxton2022), in stark contrast with the behaviour typically found in TNTIs, where this term is dominant at the outermost region of the interface (Zecchetto & da Silva Reference Zecchetto and da Silva2021). Moreover, profiles of enstrophy conditioned to the interface present a double-peaked shape (Nakamura et al. Reference Nakamura, Watanabe and Nagata2023; Chen & Buxton Reference Chen and Buxton2024), such that the internal structure of TTIs is proposed to consist of a vortex sheet surrounded by vortex tubes (Nakamura et al. Reference Nakamura, Watanabe and Nagata2023). Recently, Chen & Buxton (Reference Chen and Buxton2024) proposed the division of the TTIs into two layers, defined by the local dynamics of the turbulent kinetic energy dissipation. Furthermore, Kohan & Gaskin (Reference Kohan and Gaskin2024) report that the thickness of TTIs is a function of the background turbulence intensity, in addition to being systematically larger than that of TNTIs. Chen & Buxton (Reference Chen and Buxton2024) further raise a question as to whether the presence of a mean shear alters the distance between the two locally normalised conditional enstrophy peaks.
Some recent works have been assessing the impact of these inhomogeneous structures on the dynamics of other bodies. Ferran, Obligado & Aliseda (Reference Ferran, Obligado and Aliseda2024) shows that TTIs alter the velocity distribution of inertial particles, when compared with an homogeneous isotropic turbulence (HIT) environment. Huang, Burridge & van Reeuwijk (Reference Huang, Burridge and van Reeuwijk2023) found, when studying forced fountains, that whereas for the TNTI, only volume entrainment is possible, across the TTI, both entrainment and detrainment of volume, buoyancy and momentum occur. Additionally, Buxton & Chen (Reference Buxton and Chen2023) further showed the existence of turbulent kinetic energy entrainment. In general, this different behaviour between entrainment across TNTIs and TTIs is highlighted by van Reeuwijk, Vassilicos & Craske (Reference van Reeuwijk, Vassilicos and Craske2021)’s analytical description, where it is understood that the existence of fluctuating velocity in the environment leads to an additional contribution in the governing equations.
In spite of recent advances, there are still fundamental questions that need answers. A structural description of TTIs in flows developing without mean shear is required. Apart from Nakamura et al. (Reference Nakamura, Watanabe and Nagata2023), there has not been, to the best of the authors’ knowledge, other works on these flows with zero production of turbulent kinetic energy. In those cases, it is of the utmost importance to understand which parameters dominate the spreading. An assessment of the possible existence of universality of the small-scale statistics is also required. Recalling the work of Zecchetto & da Silva (Reference Zecchetto and da Silva2021) on TNTIs, which showed that the enstrophy normalised by the local Kolmogorov microscales yields a universal curve regardless of the flow type, we need to understand if this is also the case for TTIs and in what conditions. If that occurs, we should be able to phenomenologically explain the relevance of Kolmogorov microscales in situations where the diffusive terms do not prevail, which is in line with the phenomenology reported by Kankanwadi & Buxton (Reference Kankanwadi and Buxton2022). We also need to comprehend the main differences between TTIs and TNTIs. After all, these two types of interfacial layers are conceptually linked (the latter being a particular case of the former, when the environment is irrotational), and therefore a clear global picture of TTIs needs to emerge.
This work is structured as follows. In § 2, the specifications of the massive direct numerical simulations are discussed, with a particular emphasis on the novel approach especially developed for simulating spatially evolving TTIs (§ 2.1), as well as the presentation of the rationale behind the parametric study (§ 2.2). Subsequently, the physical relevance and consistency of the proposed TTI identification method is discussed (§ 3). Then, in § 4, classical statistics of turbulence intensity, vorticity root-mean-square (r.m.s.), longitudinal integral length scale and of passive scalar-related quantities are analysed with the purpose of physically verifying the approach, as well as understanding the overall spreading behaviour. Next, in § 5, conditional statistics of quantities with respect to the interface-normal distance are assessed. Emphasis is given to the enstrophy and rate-of-strain magnitude fields, where quasi-universality is observed (§ 5.1), as well as a particular focus on the spatial evolution of their budget equation terms (§ 5.2). Conditional analysis of large-scale parameters is addressed in § 5.3. Finally, some concluding remarks are presented in § 6, highlighting the most important takeaways, as well as future work.
2. Direct numerical simulation
In the present work, spatially evolving TTIs are simulated through a novel approach that couples two different DNS codes: one temporal and another spatially developing, that run simultaneously. Regarding the former, from now on referred to as Temp-DNS, it employs an in-house Navier–Stokes solver using classical pseudo-spectral methods for spatial discretisation (Canuto et al. Reference Canuto, Hussaini, Quarteroni and Zang1987) and a three-step third-order explicit Runge–Kutta scheme for the temporal advancement (RK3) (Williamson Reference Williamson1980). The simulations are fully de-aliased using the
 $2/3$
rule, and use a uniform and isotropic grid (
 $\varDelta x=\varDelta y = \varDelta z$
). Statistical stationarity is attained by imposing a power input through a forcing function,
 $f_i$
, which is added to the Navier–Stokes equations (NSEs) and balances the viscous dissipation rate,
 $P=\varepsilon$
, where
 $P = \overline {f_i u_i}$
is the power of the input forcing and
 $\varepsilon = 2 \nu \overline { {s_{ij}} {s_{ij}} }$
is the viscous dissipation rate, while
 ${s_{ij}} = (\partial u_i / \partial x_j + \partial u_j / \partial x_i) / 2$
is the rate-of-strain tensor. The overline,
 $\overline {(\boldsymbol{\cdot })}$
, represents an average. This code is described in detail by Silva, Zecchetto & da Silva (Reference Silva, Zecchetto and da Silva2018) and references therein.
With respect to the spatially developing code, Spat-DNS, it uses for spatial discretisation a highly accurate pseudo-spectral method (Canuto et al. Reference Canuto, Hussaini, Quarteroni and Zang1987) in the normal and spanwise directions,
 $y$
and
 $z$
, respectively, and a sixth-order compact finite differences scheme (Lele Reference Lele1992) in the streamwise direction,
 $x$
. For time-advancement, the RK3 scheme of Williamson (Reference Williamson1980) is also employed, while the pressure–velocity coupling is treated with the fractional step method of Kim & Moin (Reference Kim and Moin1985). Inflow and outflow boundary conditions (BCs) are added at the boundaries in the streamwise direction (
 $x$
), while periodic BCs are used in the remaining boundaries, i.e. at the sides (
 $z$
) and top/bottom (
 $y$
) of the domain. In particular, the velocity inlet is imposed as detailed in § 2.1, while the outlet uses a non-reflective condition (Orlanski Reference Orlanski1976), which has been observed to produce a minimum distortion on the structures leaving the simulation domain (da Silva & Métais Reference da Silva and Métais2002; Guimarães et al. Reference Guimarães, Pimentel, Pinho and da Silva2020). For reasons further developed in § 3, a passive scalar is also numerically simulated and its computation requires solving an advection–diffusion equation. All terms are discretisated in a similar fashion to the momentum equation, i.e. with pseudo-spectral/compact finite differences, except for the convective term, which uses the QUICK scheme of Leonard (Reference Leonard1979). This renders a conservation of the total mass of passive scalar with the streamwise direction (not shown). The computational code and numerical methods have been described in detail by da Silva, Lopes & Raman (Reference da Silva, Lopes and Raman2015) and Guimarães et al. (Reference Guimarães, Pimentel, Pinho and da Silva2020, Reference Guimarães, Pinho and da Silva2022).
Schematic of the procedure used to generate spatially evolving TTIs. First, (a) two independent simulations, HIT
 $i$
and HIT
 $j$
, are used to generate the initial conditions (a plane of velocity per iteration). Then, (b) a new plane composed of the previous two (the composition is carried out considering the separation illustrated by the dashed dark red lines) is imposed at the inlet of the spatially developing code, alongside a convection velocity,
 $U_{\infty }$
(light grey), and a passive scalar profile,
 $\phi$
(dark red). Finally, (c) TTI
 $ij$
is created and develops in the streamwise direction. The last figure shows an instant from the transient phase of the simulation, only for illustrative purposes.

2.1. Philosophy of the inlet condition
The key idea for the coupling between Temp-DNS and Spat-DNS is to use the former to generate planes of three-dimensional velocity fluctuations of HIT,
 $u_i^{(\textit{HIT})}$
, which are to be advected into the inlet of Spat-DNS at a constant convection velocity,
 $U_{\infty }$
. The relevance of considering these velocity fluctuations instead of numerical noise is threefold: (i) it allows for accurately controlling several properties of the inlet condition, such as the magnitude of turbulent kinetic energy,
 $k=\overline {u_i^{\prime}u_i^{\prime}}/2$
, the integral length scale,
 $L$
, or the r.m.s. of vorticity,
 $\omega '=({\overline {\omega _i^{\prime}\omega _i^{\prime}}})^{1/2}$
; (ii) the fluctuations imposed are a solution of the NSEs, and (iii) there is a temporal-correlation between different time instants of the inlet condition. Moreover, the inlet flow fluctuations are isotropic. The prime,
 $(\boldsymbol{\cdot })'$
, represents the fluctuating part of the variable, according to the Reynolds decomposition, e.g.
 $u_i = \overline {u_i} + u_i^{\prime}$
. To maximise the potential of this approach, the time per iteration,
 $\varDelta t$
, as well as the grid cell size are kept equal on both Temp-DNS and Spat-DNS, such that no interpolation between fields of different codes is required.
In general, for the sake of creating spatially evolving TTIs, two simulations with different turbulent properties are run using Temp-DNS, HIT
 $i$
and HIT
 $j$
. At every time instant, the central velocity fields are imposed at the inlet of the Spat-DNS, alongside a convection velocity,
 $U_{\infty }$
, as depicted schematically in figure 1. Specifically, the inlet plane of Spat-DNS consists of an outer part of HIT
 $i$
and an inner region of HIT
 $j$
. Therefore, this plane has the same dimension as any of the central planes provided by the Temp-DNS code. Notice that the naming inner/outer, which shall be used throughout this work, is only a convention to differentiate between the two layers, and has no implicit physical mechanism of one layer confining the other, since the boundary condition in the normalwise direction is periodic. Finally, a passive scalar profile,
 $\phi$
, is added, which is used for identifying the TTI (as discussed in § 3).
2.2. Parametric study
In essence, the idea behind the parametric study is to modify independently both small- and large-scale parameters that we can accurately control/impose. Ultimately, we will be able to assess their influence on the overall flow development. In practice, we consider, initially, the integral length scale,
 $L$
, and vorticity fluctuations,
 $\omega '$
, for representing the large and small scales, respectively. With these two parameters, the minimum number of different homogeneous isotropic turbulence combinations we can create is 4 (large and low
 $L$
, each with large and low
 $\omega '$
, respectively). Concerning the details of these temporal simulations, all used a total number of
 $N^3 = 1024^3$
collocation points, with a kinematic viscosity value of
 $\nu = 0.0013$
. As aforementioned, the goal of these HIT simulations is to provide a range of different parameters, such as the velocity r.m.s.,
 $u' = (\overline {u'^2})^{1/2}$
, the longitudinal integral length scale
 $L_{11}$
, vorticity r.m.s.,
 $\omega '$
, and the Taylor-based Reynolds number,
 ${Re}_{\lambda } = u' \lambda / \nu$
, where
 $\lambda = ( 15 \nu \overline {u'^2} /\varepsilon )^{1/2}$
is the Taylor microscale. Table 1 describes the main physical parameters of the four HIT simulations, where the following notation was employed:
 $H$
represents a DNS of HIT, and the subscripts
 $L$
or
 $l$
,
 $\unicode{x1D6FA}$
or
 $\omega$
and
 $U$
or
 $u$
denote a (relatively) large or small magnitude of the integral length scale, vorticity fluctuations and velocity fluctuations, respectively. For example,
 ${H}_{L\omega u}$
refers to a HIT simulation with large integral length scale, and small vorticity and velocity fluctuations.
Parameters of each HIT simulation: wavenumber of maximum forcing,
 ${k}_p$
, longitudinal integral length scale,
 $L_{11}$
, resolution
 ${k}_{\textit{max}}\eta$
, Taylor-based Reynolds number,
 ${Re}_{\lambda }$
, root-mean-square vorticity
 $\omega '\equiv ({\varepsilon /\nu })^{1/2}$
and root-mean-square velocity
 $u'\equiv ({\overline {u'^2}})^{1/2}$
.

Essentially, we can pair the HIT simulations by magnitude of integral length scale, or r.m.s. of vorticity. Here,
 ${H}_{L\omega u}$
and
 ${H}_{L\unicode{x1D6FA} U}$
have similar (large) integral length scale, but varying vorticity fluctuations, while
 ${H}_{L\unicode{x1D6FA} U}$
and
 ${H}_{l\unicode{x1D6FA} U}$
have similar
 $\omega '$
, but different values of
 $L_{11}$
. The resolution is always
 ${k}_{\textit{max}}\eta \gtrsim 1$
and the Taylor-based Reynolds number is
 $146\lesssim {Re}_{\lambda }\lesssim 296$
, which is sufficiently high to assess the possible existence of universality results. Noticeably, there is some dependence of
 $u'$
and
 ${Re}_{\lambda }$
on the aforementioned parameters. Indeed, since the number of collocation points and the value of the kinematic viscosity need to be the same in all simulations, we have manipulated the magnitude of the input forcing power
 $P$
, the peak location of this forcing
 ${k}_p$
, as well as the resolution
 ${k}_{\textit{max}} \eta$
(however, making sure it is at least
 ${k}_{\textit{max}} \eta = 1$
) to change physically relevant parameters. The selection of these is based on a few simple equations. By using the fact that in statistically stationary conditions, the power input of the forcing is equal to the viscous dissipation rate,
 $P = \varepsilon$
, and using the definition of the non-dimensional dissipation,
 $C_{\varepsilon }$
,
 \begin{align} \varepsilon = C_{\varepsilon } \frac {u^{\prime 3}}{L_{11}}, \end{align}
together with the definition of the Taylor-based Reynolds number, and the Kolmogorov microscale
 $\eta = ( \nu ^3 /\varepsilon )^{1/4}$
, one arrives at expressions for the maximum attainable Reynolds number (for given integral length scale
 $L_{11}$
and resolution
 ${k}_{\textit{max}} \eta$
)
 \begin{equation} {Re}_{\lambda } = \sqrt {15} \left ( \frac {L_{11}}{C_{\varepsilon }} \right )^{2/3} \left ( \frac {N}{2} \right )^{2/3} \left ( \frac {A}{{k}_{\textit{max}} \eta } \right )^{2/3}, \end{equation}
where
 $A = 2/3$
(fully de-aliased simulations). In the estimation, we have used
 $C_{\varepsilon } = 0.44$
for forced HIT (Pope Reference Pope2000). The kinematic viscosity
 $\nu$
and forcing power
 $P$
that correspond to this condition are related by
 \begin{equation} P = \nu ^3 \left ( \frac {A}{{k}_{\textit{max}}\eta } \frac {N}{2} \right )^{4}, \end{equation}
and the corresponding resolution is
 \begin{equation} {k}_{\textit{max}} \eta = A \left ( \frac {N}{2} \right ) \left ( \frac {\nu ^3}{P} \right )^{1/4}. \end{equation}
Noticeably, (2.2) can also be written as a function of
 $\nu$
and
 $P$
,
 \begin{equation} {Re}_{\lambda } = \sqrt {15} \left ( \frac {L_{11}}{C_{\varepsilon }} \right )^{2/3} \left ( \frac {P^{1/3}}{\nu } \right )^{1/2}. \end{equation}
These relations are remarkably accurate in predicting the flow properties, given a certain input list of parameters, and allow for an unprecedented level of control over the turbulent properties of spatially evolving TTIs without mean shear.
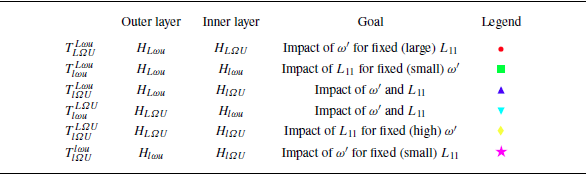
The resultant six different spatially evolving TTI simulations use the possible combinations of the aforementioned types of HIT. The domain size is
 $(L_x,L_y,L_z)=(4\pi ,2\pi ,2\pi )$
and the corresponding grid is
 $N_x\times N_y\times N_z=2048\times 1024\times 1024$
. This novel approach allows for varying
 $N_x$
, but it restricts
 $N_y$
and
 $N_z$
(as these shall be consistent with the grid of Temp-DNS simulations). A convection velocity of
 $U_{\infty }=5$
was selected, which ensured that the turbulence intensity,
 $T_u=u'/U_{\infty }$
, would not exceed unity. Therefore, it also ensures that there is, on average, no backflow at the inlet, since one has
 $\min (u)=U_{\infty }-u'\gt 0$
. Moreover, before imposing inlet velocity fluctuations, we ensure a constant
 $U_{\infty }$
velocity in the streamwise direction at all grid points. Also, the statistics are not accumulated until the flow has crossed one full box length.
A summary is presented in table 2. In this case,
 ${T}$
represents a DNS of TTIs and the subscripts (superscripts) refer to the inner (outer) layer. Specifically, as before,
 $L$
or
 $l$
,
 $\unicode{x1D6FA}$
or
 $\omega$
and
 $U$
or
 $u$
denote a (relatively) large or small magnitude of the integral length scale, vorticity fluctuations and velocity fluctuations, respectively. For instance,
 ${T}_{L\unicode{x1D6FA} U}^{L\omega u}$
indicates a TTI simulation with fixed large integral length scale, and small (large) vorticity and velocity fluctuations in the outer (inner) layer. Notice, however, that whereas for the integral length scale and vorticity fluctuations one has only two possible quantitative values, i.e.
 ${\sim} 0.9$
and
 ${\sim} 0.5$
for
 $L_{11}$
, and
 ${\sim} 150$
and
 ${\sim} 65$
for
 $\omega '$
(cf. table 1), the velocity fluctuations can have slightly different values within the same low/high magnitude states, e.g.
 ${\sim} 1.8$
and
 $ {\sim} 2.3$
shall be considered as low magnitude, but they differ by approximately
 $25\,\%$
. Whenever pertinent to explain the dynamics, the small difference that exists shall be pointed out.
Combinations of HIT simulations to produce spatially-evolving TTIs. The legend refers to the colour of the curves.

Simulations
 ${T}_{L\unicode{x1D6FA} U}^{L\omega u}$
and
 ${T}_{l\unicode{x1D6FA} U}^{l\omega u}$
keep the integral length scale across layers constant (being large and small, respectively), and change
 $\omega '$
, while
 ${T}_{l\omega u}^{L\omega u}$
and
 ${T}_{l\unicode{x1D6FA} U}^{L\unicode{x1D6FA} U}$
assess the contrary scenario. In contrast,
 ${T}_{l\unicode{x1D6FA} U}^{L\omega u}$
and
 ${T}_{l\omega u}^{L\unicode{x1D6FA} U}$
do not have fixed parameters, but shall be relevant for comparison with the previous cases. We can summarise the main parameters of the simulations in the three-dimensional
 $L_{11}-T_u-\omega '$
parametric space, where it is insightful to consider the ratios of these quantities from outer to inner layers, e.g.
 $T_u^{({\textit{Outer}})}/T_u^{({\textit{Inner}})}$
as the variables. Naturally, we can project it into the two-dimensional
 $L_{11}{-}T_u$
and
 $\omega '{-}T_u$
maps, which allows for simplifying the analysis. All three spaces are depicted in figure 2.
Parametric space (a)
 $L_{11}{-}T_u{-}\omega '$
and respective two-dimensional projections (b)
 $L_{11}{-}T_u$
, and (c)
 $\omega '{-}T_u$
. The grey regions correspond to regions with the ratios
 $L_{11}^{({\textit{Outer}})}/L_{11}^{({\textit{Inner}})}$
,
 $T_u^{({\textit{Outer}})}/T_u^{({\textit{Inner}})}$
or
 $\omega '^{({\textit{Outer}})}/\omega '^{({\textit{Inner}})}$
equal to
 $1\pm 0.1$
, and hence are considered as roughly constant. Notice that the Taylor-based Reynolds number also varies, as shown in table 1, but it encompasses effects of both large and small scales, being completely dependent of the other parameters.

First, the
 $L_{11}{-}T_u{-}\omega '$
space (figure 2
a) shows that we cover a large portion of the available parametric space. More precisely, in the
 $L_{11}{-}T_u$
map (figure 2
b), the existence of simulations representing almost three of the four possible quadrants, for an origin located at
 $(1,1)$
, is highlighted. Namely,
 ${T}_{l\omega u}^{L\omega u}$
,
 ${T}_{l\omega u}^{L\unicode{x1D6FA} U}$
and
 ${T}_{l\unicode{x1D6FA} U}^{L\unicode{x1D6FA} U}$
present
 ${L_{11}^{({\textit{Outer}})}}/{L_{11}^{({\textit{Inner}})}}\!\gt \!1$
and
 $T_u^{({\textit{Outer}})}/T_u^{({\textit{Inner}})}\!\gt \!1$
(first quadrant),
 ${T}_{l\unicode{x1D6FA} U}^{L\omega u}$
has
 $L_{11}^{({\textit{Outer}})}/L_{11}^{({\textit{Inner}})}\!\gt \!1$
and
 $T_u^{({\textit{Outer}})}/T_u^{({\textit{Inner}})}\!\lt \!1$
(second quadrant), while
 ${T}_{L\unicode{x1D6FA} U}^{L\omega u}$
and
 ${T}_{l\unicode{x1D6FA} U}^{l\omega u}$
showcase
 $L_{11}^{({\textit{Outer}})}/L_{11}^{({\textit{Inner}})}\!\sim \! 1$
and
 $T_u^{({\textit{Outer}})}/ T_u^{({\textit{Inner}})}\!\lt \!1$
(at the border between second and third quadrants). It is worth remarking that
 ${T}_{L\unicode{x1D6FA} U}^{L\omega u}$
and
 ${T}_{l\unicode{x1D6FA} U}^{l\omega u}$
, as well as
 ${T}_{l\omega u}^{L\omega u}$
and
 ${T}_{l\unicode{x1D6FA} U}^{L\unicode{x1D6FA} U}$
are almost superimposed, despite the different magnitude of integral length scales or
 $T_u$
. Notice that the portion of the
 $L_{11}{-}T_u$
map with
 $L_{11}^{({\textit{Outer}})}/L_{11}^{({\textit{Inner}})}\!\lt \!1$
was omitted for the sake of simplification. Regarding the
 $\omega '{-}T_u$
parametric space (figure 2
c), we can distinguish between
 ${T}_{l\omega u}^{L\unicode{x1D6FA} U}$
, with
 $\omega '^{({\textit{Outer}})}/\omega '^{({\textit{Inner}})}\!\gt \!1$
and
 $T_u^{({\textit{Outer}})}/T_u^{({\textit{Inner}})}\!\gt \!1$
(first quadrant), the group
 ${T}_{L\unicode{x1D6FA} U}^{L\omega u}$
,
 ${T}_{l\unicode{x1D6FA} U}^{L\omega u}$
and
 ${T}_{l\unicode{x1D6FA} U}^{l\omega u}$
showcasing
 $\omega '^{({\textit{Outer}})}/\omega '^{({\textit{Inner}})}\!\lt \!1$
and
 $T_u^{({\textit{Outer}})}/T_u^{({\textit{Inner}})}\!\lt \!1$
(third quadrant), and finally
 ${T}_{l\omega u}^{L\omega u}$
and
 ${T}_{l\unicode{x1D6FA} U}^{L\unicode{x1D6FA} U}$
with
 $\omega '^{({\textit{Outer}})}/\omega '^{({\textit{Inner}})}\!\sim \! 1$
and
 $T_u^{({\textit{Outer}})}/T_u^{({\textit{Inner}})}\!\gt \!1$
(at the border between fourth and first quadrants). These positions shall be important when characterising the dynamics of the flow evolution in § 4.1.
3. Interface identification
To analyse TTIs, a criterion to identify the boundary between the two regions is required. For TNTIs, several different methods have been proposed over the last years. For instance, authors have been using a threshold on the vorticity magnitude (Bisset, Hunt & Rogers Reference Bisset, Hunt and Rogers2002) or on the turbulent kinetic energy (Chauhan et al. Reference Chauhan, Philip, De Silva, Hutchins and Marusic2014). This is not feasible for application in the context of TTIs, since we can have similar levels of
 $\omega '$
or
 $u'$
on both turbulent sides, with other varying parameters (e.g. integral length scale). This requires the use of a criterion that does not depend directly on the vorticity or velocity variables, which motivates the use of a passive scalar, since its defining parameters can be kept constant regardless of the turbulent properties. The concentration of a dye has been used for identifying TNTIs (Westerweel et al. Reference Westerweel, Fukushima, Pedersen and Hunt2005), but it is a method in line with recent work on TTIs. To the best of the authors’ knowledge, most of the previous studies on the topic have based their identification method on a passive scalar. In particular, the experimental works of Kankanwadi & Buxton (Reference Kankanwadi and Buxton2020, Reference Kankanwadi and Buxton2022) and Chen & Buxton (Reference Chen and Buxton2024) use the light intensity gradient magnitude (with, indirectly, a passive scalar). Kohan & Gaskin (Reference Kohan and Gaskin2022, Reference Kohan and Gaskin2024) consider a threshold (defined by the inflection point of a pixel-averaged concentration) on the centreline-averaged passive scalar,
 $\phi /\phi _c$
, where
 $\phi _c$
is the centreline passive scalar value, in between
 $0.11$
and
 $0.14$
. The simulations of Nakamura et al. (Reference Nakamura, Watanabe and Nagata2023) use a value for the normalised passive scalar,
 $\phi /\phi _0$
, of either
 $0.03$
or
 $0.97$
, where
 $\phi _0$
is a constant that ensures
 $\phi /\phi _0\in [0.0;1.0]$
. For the sake of brevity, we will use
 $\phi$
to refer to the normalised passive scalar. In contrast, Huang et al. (Reference Huang, Burridge and van Reeuwijk2023), who analyse a forced fountain, use a threshold on a small upward velocity. In the present work, all spatially evolving TTI simulations use the same inlet passive scalar distribution, consisting of an initial hyperbolic tangent profile (Stanley & Sarkar Reference Stanley and Sarkar1997),
 \begin{equation} \phi (x,y,z)=\dfrac {1}{2}+\dfrac {1}{2}\tanh \left [\dfrac {25}{2}\left (1-\dfrac {2|y|}{H}\right )\right ], \end{equation}
where
 $H\equiv \pi$
is a reference length. It is trivial to check that a sharp gradient is imposed at
 $y/H=\pm 0.5$
, as observed in figure 3(a). Since
 $\phi \in [0.0;1.0]$
and given that the steepest gradient is located at the initial discontinuity by imposition (i.e.
 $y/H=\pm 0.5$
), a threshold value of
 $\phi _{{\rm th}}=0.5$
was selected. Although this criterion is conceptually sound, a more detailed analysis was carried out to demonstrate its relevance as shown here below.
Instantaneous passive scalar field two-dimensional visualisation at
 $z/H=0$
(a) with a superimposed hyperbolic tangent profile or (b) a set of slabs used for the volume fraction function and conditional statistics (§ 5) analyses. A corresponding (c) three-dimensional slab.

In fact, a passive scalar, in the absence of a forcing, follows a typical advection–diffusion equation, where the strength of the diffusive term is
 $\kappa$
, its molecular diffusivity. The relation between this parameter and the kinematic viscosity,
 $\nu$
, is given by the Schmidt number,
 $\textit {Sc}$
. Ideally, to diminish unwanted passive scalar molecular diffusion, one would require
 $\textit {Sc} \gg 1$
. Yet, this is unfeasible in numerical simulations since the relevant scale of motion would become much smaller than the Kolmogorov microscale, requiring a prohibitively high resolution. Therefore, a value of
 $\textit {Sc}=1$
was used. For comparison, in the work of Watanabe, Zhang & Nagata (Reference Watanabe, Zhang and Nagata2018), this unity Schmidt number enabled the identification of a TNTI using a passive scalar threshold, yielding statistics close to those obtained using a vorticity magnitude threshold. To further support this rationale, the volume fraction of the passive scalar field was studied. This function,
 $\textit{Vol}(\phi _*)$
, where
 $\phi _*$
is the passive scalar independent variable, can be defined as the fraction of the total domain volume that has
 $\phi \geqslant \phi _*$
(therefore, ranging from
 $0$
to
 $1$
). It is trivial to see that this is a monotonically decreasing function and it can be thought of as complementary to the cumulative probability density function. Ideally, one is looking for a region where there exists a weak dependence of
 $\textit{Vol}(\phi _*)$
on
 $\phi _*$
, since this would mean that the isosurface is almost insensitive to the selected threshold value. This is directly linked to the probability density function (p.d.f.) of the same quantity since, for a bimodal p.d.f., da Silva et al. (Reference da Silva, Taveira and Borrell2014b
) have shown that the minimum of the p.d.f. corresponds to an inflection point of the volume fraction function. In the present work, the threshold value shall be defined as the
 $\phi _{\textrm {th}}$
that satisfies this relation.
Without loss of generality, we take several time instants of three-dimensional instantaneous passive scalar fields, and divide them into slabs of thickness
 $0.1H$
, such as represented in figure 3(b). With this, for each three-dimensional slab (figure 3
c), it is possible to compute the time-averaged volume fraction function, as represented in figure 4(a), in this case for
 ${T}_{l\unicode{x1D6FA} U}^{l\omega u}$
. Overall, the volume fraction function is approximately odd, with the axis of antisymmetry at roughly
 $\phi =0.5$
. Indeed, when we calculate the value at which this function changes the least (ignoring spurious oscillations closer to the extrema), we obtain a range of points in the neighbourhood of
 $\phi =0.5$
(denoted by ‘Admissible Threshold’ in figure 4
a). Since there is not a clear tendency for these values to change monotonically with
 $x/H$
, we can state that, at least for these domain sizes, using a threshold value of
 $\phi _{{\rm th}}=0.5$
for all slabs is appropriate to detect the separating surface between the two adjacent turbulent regions. Regarding the (streamwise) spatial effect on the global shape of the curve, it shall be highlighted that the derivative magnitude close to the threshold value region becomes greater with
 $x/H$
, which is due to the diffusion of passive scalar. Nevertheless, it is still rather flat, so that a weak sensitivity to the threshold is obtained. To further support this, one can recall that there exists a correlation between the passive scalar value and the curvature of the corresponding isosurface for HIT (Dopazo, Martín & Hierro Reference Dopazo, Martín and Hierro2007) and the value that ensures an equal probability of either negative or positive curvatures is precisely
 $\phi =0.5$
. Other values would potentially bias the identification of the interface to a greater preponderance of either concave or convex geometries. Additionally, some preliminary numerical tests were conducted to assess the effect of the Schmidt number. The statistics for
 $\textit {Sc}\in [1;50]$
did not reveal any significant qualitative changes (not shown).
Spatial evolution of (a) the volume fraction function and the points where it changes the least (light/dark grey represents a slab closer to the inlet/outlet of the domain) and (b) two-dimensional visualisations of vorticity magnitude,
 $\sqrt {\omega _i\omega _i}$
, for slices with constant
 $x/H=0.05$
(top) and
 $x/H=0.25$
(bottom) for simulation
 ${T}_{l\unicode{x1D6FA} U}^{l\omega u}$
, superimposed by the (white) isoline of
 $\phi =0.5$
. The inset (bottom left) highlights the vorticity magnitude field in close proximity to the TTI.

Finally, one can inspect visually how well this threshold value performs in bounding layers of different levels of vorticity magnitude. Figure 4(b) shows two slices of the same time instant for simulation
 ${T}_{l\unicode{x1D6FA} U}^{l\omega u}$
, at
 $x/H=0.05$
and
 $x/H=0.25$
(close to the inlet). Recalling table 2, this simulation presents an inner layer with a magnitude of
 $\omega '$
much higher than the outer region. We essentially observe that, not only is the passive scalar rather quick in following the vorticity dynamics (since it is highly contorted when compared with the inlet condition), but it also differentiates notably a region with a higher value of
 $\sqrt {\omega _i\omega _i}$
. Notice that it has been verified that the enstrophy p.d.f. for one of our simulations (specifically,
 ${T}_{l\unicode{x1D6FA} U}^{l\omega u}$
) does not exhibit a sharp bimodal behaviour, which would enable an inflection point to be identified in the corresponding enstrophy volume fraction function (not shown). This absence becomes more apparent as the flow evolves and both layers begin to decay and homogenise.
This analysis supports the use of a (normalised) passive scalar threshold of
 $0.5$
for identifying the TTI, which results in the isosurfaces represented in figure 5. These are, even for a simulation with low levels of turbulent properties (e.g.
 ${T}_{l\omega u}^{L\omega u}$
), rather complex and convoluted, which is ultimately linked to their fractal nature (Kankanwadi & Buxton Reference Kankanwadi and Buxton2020; Kohan & Gaskin Reference Kohan and Gaskin2022).
Three-dimensional visualisation of instantaneous turbulent/turbulent interface coloured by passive scalar variance dissipation,
 $\varepsilon _{\phi }$
.

4. Effect of the turbulence parameters on the spreading of spatially evolving TTIs without mean shear
Classical statistics of the DNS were obtained using a spatio-temporal averaging ensemble. In general, for a four-dimensional discrete field
 $\psi (x_i/H,y_j/H,z_k/H,t_m)$
, with
 $N_x\times N_y\times N_z \times N_t$
points, where
 $N_t$
is the number of time instants, we computed a temporal mean, followed by a spatial average along the homogeneous direction,
 $z$
(see figure 1 for the reference system), and finally folded the statistics assuming symmetry with respect to the axis
 $y=0$
. This can be mathematically expressed by
 \begin{equation} \overline {\psi }^f(x_i/H,y_j/H)=\dfrac {\overline {\psi }(x_i/H,y_j/H)+\overline {\psi }(x_i/H,y_{N_y-j}/H)}{2}, \end{equation}
where
 \begin{equation} \overline {\psi }(x_i/H,y_j/H)\equiv \dfrac {1}{N_z N_t}\sum _{k=1}^{N_z}\sum _{m=1}^{N_t}\psi (x_i/H,y_j/H,z_k/H,t_m). \end{equation}
The analysis of these statistics allows for a physical verification of this new simulation approach, and enables us to understand the overall flow’s development. For the sake of comparison between different simulations, we applied a
 $\overline {(\boldsymbol{\cdot })}^f$
-average to the turbulence intensity,
 $T_u$
, and the fluctuating vorticity,
 $\omega '$
. The results are shown in figure 6 for
 ${T}_{L\unicode{x1D6FA} U}^{L\omega u}$
,
 ${T}_{l\omega u}^{L\omega u}$
,
 ${T}_{l\unicode{x1D6FA} U}^{L\omega u}$
,
 ${T}_{l\omega u}^{L\unicode{x1D6FA} U}$
,
 ${T}_{l\unicode{x1D6FA} U}^{L\unicode{x1D6FA} U}$
and
 ${T}_{l\unicode{x1D6FA} U}^{l\omega u}$
, respectively.
Contours of averaged turbulence intensity (upper),
 $T_u$
, and fluctuating vorticity (lower),
 $\omega '$
, for (a)
 ${T}_{L\unicode{x1D6FA} U}^{L\omega u}$
, (b)
 ${T}_{l\omega u}^{L\omega u}$
, (c)
 ${T}_{l\unicode{x1D6FA} U}^{L\omega u}$
, (d)
 ${T}_{l\omega u}^{L\unicode{x1D6FA} U}$
, (e)
 ${T}_{l\unicode{x1D6FA} U}^{L\unicode{x1D6FA} U}$
and ( f)
 ${T}_{l\unicode{x1D6FA} U}^{l\omega u}$
. The dashed lines highlight the initial separation between outer and inner turbulent regions. The line
 $y/H=0$
is an axis of symmetry for the statistics.

Closer to the inlet, the vorticity r.m.s. presents one of three scenarios: either: (i) the middle layer has an increased magnitude; (ii) the outer layer has a greater magnitude; or (iii) both layers present similar levels of
 $\omega '$
. These options are completely in line with the intended imposition at the inlet. That is,
 ${T}_{L\unicode{x1D6FA} U}^{L\omega u}$
,
 ${T}_{l\unicode{x1D6FA} U}^{L\omega u}$
and
 ${T}_{l\unicode{x1D6FA} U}^{l\omega u}$
exhibit the first case,
 ${T}_{l\omega u}^{L\unicode{x1D6FA} U}$
the second, and
 ${T}_{l\omega u}^{L\omega u}$
and
 ${T}_{l\unicode{x1D6FA} U}^{L\unicode{x1D6FA} U}$
the third. Quantitatively, we recall (cf. table 1) that there are generically two different states for the fluctuating vorticity: either
 $\omega '\sim 65$
or
 $\omega '\sim 150$
. The corresponding vorticity r.m.s. isolines show a magnitude well in agreement with these values. Therefore, one verifies, from the small-scale point of view, the developed approach. A similar observation can be made for the turbulence intensity. Indeed, for
 $T_u$
, we have mostly a layer with higher magnitude than the other, a difference that can be more (or less) pronounced, e.g.
 ${T}_{l\omega u}^{L\unicode{x1D6FA} U}$
and
 ${T}_{l\unicode{x1D6FA} U}^{l\omega u}$
(e.g.
 ${T}_{l\omega u}^{L\omega u}$
and
 ${T}_{l\unicode{x1D6FA} U}^{L\unicode{x1D6FA} U}$
). Once again, it is pertinent to evoke the theoretical values of
 $u'$
to compute the intended turbulence intensity:
 ${H}_{L\omega u}$
has
 $T_u\sim 2.26/5\approx 0.45$
,
 ${H}_{L\unicode{x1D6FA} U}$
presents
 $T_u\approx 0.78$
,
 ${H}_{l\omega u}$
shows
 $T_u\approx 0.36$
and
 ${H}_{l\unicode{x1D6FA} U}$
displays
 $T_u\approx 0.63$
. It is trivial to confirm that these values are indeed respected for
 $x/H\to 0$
, which means that the imposition of large scales in the inlet condition is also well implemented.
This novel approach also allows for studying the spatial development of the flow. First, the domain length in the streamwise direction is sufficiently large to observe an apparent homogenisation of
 $\omega '$
and
 $T_u$
by the end of the computational domain, even when the initial levels at each layer are quite different. This can be observed by the almost parallel isolines of each quantity, i.e.
 $\omega '$
and
 $T_u$
, as we approach the end of the computational box. This homogenisation is faster for
 $\omega '$
than for
 $T_u$
. Such a behaviour can be attributed to the different phenomenological nature of the two parameters:
 $\omega '$
is a small-scale quantity therefore adjusting faster to perturbations, whereas
 $T_u$
is more linked with the large structures of the flow and tends to be more anisotropic for longer times. In addition, when we have highly different levels of either
 $\omega '$
or
 $T_u$
, it seems that one of the layers is imposing itself on the other. Particularly, figures 6(d) and 6( f) (simulations
 ${T}_{l\omega u}^{L\unicode{x1D6FA} U}$
and
 ${T}_{l\unicode{x1D6FA} U}^{l\omega u}$
, respectively) show that the outer/inner region is affecting the inner/outer layer, eventually leading to the curvature of the isolines, respectively. This ought be important for the spreading of turbulent regions across TTIs, since the passive scalar reacts to these deformations. Noticeably,
 ${T}_{l\omega u}^{L\omega u}$
and
 ${T}_{l\unicode{x1D6FA} U}^{L\unicode{x1D6FA} U}$
have an increased
 $\omega '$
near
 $(x/H,y/H)=(0,\pm 0.5)$
, which is related to the location of the discontinuity in the inlet velocity field plane. Ultimately, this phenomenon, observed in all simulations, is accommodated by the flow within a range of a few cells, and a divergence-free condition is ensured in the entire domain. Notice, for instance, the first slice in figure 4(b), taken at
 $x/H=0.05$
for simulation
 ${T}_{l\unicode{x1D6FA} U}^{l\omega u}$
. In spite of the close proximity to the inlet, no spurious effects are observable, which would be highlighted by the logarithmic scale. Additionally, it has no impact on the large scales as it can be confirmed by the
 $T_u$
evolution.
The fact that, in some situations, one of the layers has a greater turbulent kinetic energy (i.e. turbulence intensity,
 $T_u$
), while there is not a relevant mean shear, might lead to the perception of this flow as being canonically similar to a spatially evolving shearless turbulence mixing layer, systematically proposed by Veeravalli & Warhaft (Reference Veeravalli and Warhaft1989). Conceptually, we might argue for that to be, at best, partially true. Indeed, in some cases, there is a large difference in the levels of
 $u'$
, e.g.
 ${T}_{l\omega u}^{L\unicode{x1D6FA} U}$
has
 $T_u^{({\textit{Outer}})}/T_u^{({\textit{Inner}})}=2.16$
, which corresponds to a ratio of turbulent kinetic energies of
 ${\sim} 4.7$
. This is one of the implicit pre-requisites for a shearless turbulence mixing layer to be observed in a self-similar state. In other cases, the greatest difference comes from the integral length scale, e.g.
 ${T}_{l\omega u}^{L\omega u}$
has
 $T_u^{({\textit{Outer}})}/T_u^{({\textit{Inner}})}=1.25$
, yielding a ratio of turbulent kinetic energies of
 ${\sim} 1.6$
, while
 $L_{11}^{({\textit{Outer}})}/L_{11}^{({\textit{Inner}})}=2.00$
. Therefore, we interpret the current proposed flow, and respective simulations, as a generalised version of the inlet conditions that ultimately develop into a shearless turbulence mixing layer. In this case, there is no restriction on the ratios of
 $T_u$
(or, in general, any turbulent property).
Nevertheless, we can take a closer look at the dynamics of (twice) the turbulent kinetic energy, i.e.
 $\overline {u_i^{\prime}u_i^{\prime}}$
, in an attempt to qualify the various stages of its spatial development. As such, the profiles of the
 $\overline {(\boldsymbol{\cdot })}^f$
-averaged turbulent kinetic energy were considered. Each quantity was normalised in a similar fashion as Tordella & Iovieno (Reference Tordella and Iovieno2006),
 \begin{equation} \dfrac {\overline {u_i^{\prime}u_i^{\prime}}-\overline {u_i^{\prime}u_i^{\prime}}^{{(\textit{Outer})}}}{\overline {u_i^{\prime}u_i^{\prime}}^{{(\textit{Inner})}}-\overline {u_i^{\prime}u_i^{\prime}}^{{(\textit{Outer})}}}, \end{equation}
where the superscripts ‘
 ${\textit{Outer}}$
’ and ‘
 ${\textit{Inner}}$
’ refer to the quantities evaluated at the turbulent core of the outer and inner regions, respectively. This ensures that, for example, when
 $\overline {u_i^{\prime}u_i^{\prime}}\to \overline {u_i^{\prime}u_i^{\prime}}^{{(\textit{Inner})}}$
, the ratio tends to
 $1$
, whereas if
 $\overline {u_i^{\prime}u_i^{\prime}}\to \overline {u_i^{\prime}u_i^{\prime}}^{{(\textit{Outer})}}$
, it tends to
 $0$
. The
 $y$
coordinates were re-centred, i.e.
 $y\to y-y_C$
, where
 $y_C$
is the value for which
 $\overline {u_i^{\prime}u_i^{\prime}}=0.5(\overline {u_i^{\prime}u_i^{\prime}}^{{(\textit{Outer})}}+\overline {u_i^{\prime}u_i^{\prime}}^{{(\textit{Inner})}})$
, and rescaled by
 $\varDelta$
, where this corresponds to the thickness between the
 $y$
coordinates at which the quantity defined by (4.3) takes values of 0.25 and 0.75. Figure 7 shows these terms taken at
 $x/H=[0.25;0.63;1.0;1.38]$
, for
 ${T}_{l\omega u}^{L\omega u}$
,
 ${T}_{l\omega u}^{L\unicode{x1D6FA} U}$
and
 ${T}_{l\unicode{x1D6FA} U}^{l\omega u}$
, alongside the profiles obtained by Veeravalli & Warhaft (Reference Veeravalli and Warhaft1989), Tordella & Iovieno (Reference Tordella and Iovieno2006) and Nakamura et al. (Reference Nakamura, Matsushima, Zheng, Nagata and Watanabe2022).
Transverse evolution of the normalised turbulent kinetic energy at four different streamwise stations (
 $x/H=[0.25;0.63;1.0;1.38]$
) for simulations
 ${T}_{l\omega u}^{L\omega u}$
(green),
 ${T}_{l\omega u}^{L\unicode{x1D6FA} U}$
(cyan) and
 ${T}_{l\unicode{x1D6FA} U}^{l\omega u}$
(magenta). The profiles of the shearless turbulence mixing layers of Veeravalli & Warhaft (Reference Veeravalli and Warhaft1989) (
 ), Tordella & Iovieno (Reference Tordella and Iovieno2006) (
 ) and Nakamura et al. (Reference Nakamura, Matsushima, Zheng, Nagata and Watanabe2022) (
 ) are superimposed. The arrows point in the downstream direction (the colours of the curves become darker).

We shall start by discussing
 ${T}_{l\omega u}^{L\unicode{x1D6FA} U}$
and
 ${T}_{l\unicode{x1D6FA} U}^{l\omega u}$
that present the greatest difference in the levels of
 $\overline {u_i^{\prime}u_i^{\prime}}^{{(\textit{Outer})}}$
and
 $\overline {u_i^{\prime}u_i^{\prime}}^{{(\textit{Inner})}}$
at the inlet. For
 $x/H=0.25$
,
 $\overline {u_i^{\prime}u_i^{\prime}}^{{(\textit{Outer})}}/\overline {u_i^{\prime}u_i^{\prime}}^{{(\textit{Inner})}}=3.44$
and
 $\overline {u_i^{\prime}u_i^{\prime}}^{{(\textit{Outer})}}/\overline {u_i^{\prime}u_i^{\prime}}^{{(\textit{Inner})}}=0.45$
, which makes the normalisation of (twice) the turbulent kinetic energy especially suitable and in complete agreement with the profiles observed in self-similar states of the shearless turbulence mixing layers of Veeravalli & Warhaft (Reference Veeravalli and Warhaft1989), Tordella & Iovieno (Reference Tordella and Iovieno2006) and Nakamura et al. (Reference Nakamura, Matsushima, Zheng, Nagata and Watanabe2022). As
 $x/H$
increases, the turbulent kinetic energy is homogeneised whenever there is an initial steep gradient across both regions. Ultimately, one attains, for
 $x/H=1.38$
(at
 ${\sim} 70\,\%$
of the domain), modest differences on the levels of
 $\overline {u_i^{\prime}u_i^{\prime}}$
,
 $23\,\%$
for
 ${T}_{l\omega u}^{L\unicode{x1D6FA} U}$
and
 $15\,\%$
for
 ${T}_{l\unicode{x1D6FA} U}^{l\omega u}$
. The error-function type of profiles ultimately vanish and the normalisation becomes a poor representation of the flow. This is natural: if
 $\overline {u_i^{\prime}u_i^{\prime}}^{{(\textit{Outer})}}$
and
 $\overline {u_i^{\prime}u_i^{\prime}}^{{(\textit{Inner})}}$
become closer, the denominator of (4.3) becomes increasingly smaller and more susceptible to amplifying oscillations. For
 ${T}_{l\omega u}^{L\omega u}$
, the value of
 $\overline {u_i^{\prime}u_i^{\prime}}^{{(\textit{Outer})}}/\overline {u_i^{\prime}u_i^{\prime}}^{{(\textit{Inner})}}$
is, straight from the beginning, small, as mentioned before. Therefore, even at
 $x/H=0.25$
, the profile exhibits deviations over the typical curves. For instance, it takes a longer distance to decay to both the
 $0$
and
 $1$
states. Additionally, it even falls below the former, to negative values. Distinctly,
 $\overline {u_i^{\prime}u_i^{\prime}}^{{(\textit{Outer})}}/\overline {u_i^{\prime}u_i^{\prime}}^{{(\textit{Inner})}}$
grows from
 $1.41$
to
 $1.56$
. Despite being solely a small increase, approximately
 $10\,\%$
, this further supports the poor efficacy of using such a normalisation. Finally,
 $\varDelta$
is observed to be of the order of the integral length scale,
 $L_{11}$
. This further supports the large-scale nature of these profiles. The good analytical agreement in the cases where the levels of
 $T_u$
differ significantly in the two layers suggests that this flow can behave as a shearless turbulence mixing layer, as proposed by Veeravalli & Warhaft (Reference Veeravalli and Warhaft1989). Whenever this is not met, i.e.
 $\overline {u_i^{\prime}u_i^{\prime}}^{{(\textit{Outer})}}/\overline {u_i^{\prime}u_i^{\prime}}^{{(\textit{Inner})}}\sim 1$
, this is not valid, sustaining the hypothesis of interpreting it as a generalisation of the canonical flow first proposed by Veeravalli & Warhaft (Reference Veeravalli and Warhaft1989).
So far, we have addressed two of the three quantities that mostly differentiate the six simulations, i.e.
 $\omega '$
and
 $T_u$
. Nonetheless, we need to also discuss the evolution of
 $L_{11}$
to understand the mechanics of these flows without mean shear, since in some cases the variation of
 $\omega '$
or
 $T_u$
is not the most important parameter (e.g.
 ${T}_{l\omega u}^{L\omega u}$
). As such, figure 8 depicts profiles of
 $\overline {(\boldsymbol{\cdot })}^f$
-averaged longitudinal integral length scale,
 $L_{11}$
, with the intent of (i) assessing if the inlet condition is consistent from the integral length scale point of view and (ii) providing a qualitative overview picture on the large-scale dynamics, as the flow evolves downstream. The profiles were taken at three different slabs,
 $x/H\in \{[0.1;0.2];[0.6;0.7];[1.1;1.2]\}$
, for all six simulations. Additionally, the curves were re-centred around
 $|y/H|=0.5$
.
Spatial evolution of longitudinal integral length scale profiles, at different
 $x/H$
stations for simulations (a)
 ${T}_{L\unicode{x1D6FA} U}^{L\omega u}$
, (b)
 ${T}_{l\omega u}^{L\omega u}$
, (c)
 ${T}_{l\unicode{x1D6FA} U}^{L\omega u}$
. (d)
 ${T}_{l\omega u}^{L\unicode{x1D6FA} U}$
, (e)
 ${T}_{l\unicode{x1D6FA} U}^{L\unicode{x1D6FA} U}$
and ( f)
 ${T}_{l\unicode{x1D6FA} U}^{l\omega u}$
. The
 $x/H$
station closer to the inlet has a lighter colour, whereas the one closer to the outlet is the darkest. The arrows point in the downstream direction.

First of all,
 $L_{11}$
generically increases with
 $x/H$
(that is, the curves shift vertically). This physically validates the simulation procedure since the integral length scale in freely decaying turbulence grows in the downstream direction (Sagaut & Cambon Reference Sagaut and Cambon2008). Moreover, the numerical values of the integral length scales for the slabs closest to the inlet are accurately in accordance with those of table 1 (which are summarised by the horizontal black dashed lines with ‘Small
 $L_{11}$
’ or ‘Large
 $L_{11}$
’). For example,
 ${T}_{l\unicode{x1D6FA} U}^{L\omega u}$
(figure 8
c) is closely following these dashed reference lines, presenting a steep gradient from one region to another. As for the dynamical aspects, even though the degree of convergence of the curves is not perfect, it is sufficient to draw some qualitative conclusions. Particularly, whenever we have a constant
 $L_{11}$
across layers (
 ${T}_{L\unicode{x1D6FA} U}^{L\omega u}$
and
 ${T}_{l\unicode{x1D6FA} U}^{l\omega u}$
), it is hard to separate two distinct regions, confirming that this quantity is not actively affecting the flow development. In contrast, when the two flow regions have dissimilar values of
 $L_{11}$
(
 ${T}_{l\omega u}^{L\omega u}$
,
 ${T}_{l\unicode{x1D6FA} U}^{L\omega u}$
,
 ${T}_{l\omega u}^{L\unicode{x1D6FA} U}$
and
 ${T}_{l\unicode{x1D6FA} U}^{L\unicode{x1D6FA} U}$
), not only is the shape of these profiles different, but it seems that there exists some interaction between scales. In Appendix A, simulations of freely decaying turbulence for each type of HIT presented in table 1 are shown. There, all DNS showcased a growing integral length scale with the streamwise direction, in some situations at a comparable rate. Here, however, the regions with the smallest integral length scale seem to grow more rapidly (cf. left semiplane of figures 8
b, 8
c and 8
d), which could be attributed to a different type of decay, but might be connected to the region with a higher
 $L_{11}$
exerting some influence on the other layer. This hypothesis could be backed up by considering the following rationale. There are two regions, one with bigger structures, typically more energetic (apart from
 ${T}_{l\unicode{x1D6FA} U}^{L\omega u}$
, all remaining simulations exhibit a higher
 $u'$
on the side with the highest
 $L_{11}$
), and another with smaller and less energetic scales. The diffusion of turbulent kinetic energy is generally responsible for homogenising the flow by acting in the sense of diminishing the gradient. This mechanism could eventually couple both scales, since their size is generally linked to the level of
 $T_u$
. In addition, as the flow evolves, the largest structures may occupy the regions with smaller length scales. The conclusions of Tordella & Iovieno (Reference Tordella and Iovieno2012) might help with interpreting these phenomena. In their work, a gradient of integral length scales is put in a triple-periodic DNS, alongside a constant kinetic energy level. Consequently, it is shown that, even when the levels of turbulent kinetic energy are the same in two different HIT regions, the mere existence of a gradient in the integral length scale will introduce an inhomogeneity in
 $k$
, highlighting the coupling between these two large-scale quantities. In particular, the greater the ratio of integral length scales, the more pronounced is the inhomogeneity (i.e. gradient) of turbulent kinetic energy. Moreover, the gradient will be formed in the direction of the largest integral length scale, i.e. this will exhibit a higher magnitude when compared with the region with the smaller scale. This is a key remark that allows for interpreting some previous observations. Here,
 ${T}_{l\unicode{x1D6FA} U}^{L\omega u}$
contrasts with all other simulations, since the gradient on the integral length scale and the turbulence intensity are in the opposite direction. Additionally, figure 6(c) shows a faster homogenisation of
 $T_u$
(at approximately
 $50\,\%$
of the domain, it is approximately constant) than any of the other spatially developing DNS. Since initially the kinetic energy is higher at the inner layer, but the integral length scale is smaller, the latter will act in the sense of augmenting
 $k$
on the outer layer (where
 $L_{11}$
is bigger). These counteracting mechanisms ultimately result in a faster homogenisation. All in all, these aspects end up supporting the perspective that one of the layers will dominate/impose its properties on the other, something possibly connected to the curved isolines previously mentioned.
4.1. Passive scalar-related quantities
Finally, looking at the passive scalar field is also pertinent. Indeed, as aforementioned, this quantity will be used for identifying the TTIs. Additionally, it allows for understanding some trends as to which is the dominant layer. Figure 9 depicts both the average passive scalar,
 $\overline {\phi }^f$
, and its variance,
 $\overline {\phi '^2}^f$
.
Contours of
 $\overline {\phi }$
(upper) and
 $\overline {\phi '^2}$
(lower) for simulations (a)
 ${T}_{L\unicode{x1D6FA} U}^{L\omega u}$
, (b)
 ${T}_{l\omega u}^{L\omega u}$
, (c)
 ${T}_{l\unicode{x1D6FA} U}^{L\omega u}$
, (d)
 ${T}_{l\omega u}^{L\unicode{x1D6FA} U}$
, (e)
 ${T}_{l\unicode{x1D6FA} U}^{L\unicode{x1D6FA} U}$
and ( f)
 ${T}_{l\unicode{x1D6FA} U}^{l\omega u}$
. The dashed lines highlight the initial separation between outer and inner turbulent regions. The passive scalar field scale was restricted to the interval
 $[0.4;0.6]$
for the sake of highlighting the region with
 $\phi =0.5$
.

The passive scalar spreads with streamwise distance. If we look at the distance between white and black regions of the upper semiplanes, i.e.
 $0.4\leqslant \phi \leqslant 0.6$
, we observe that, closer to the outlet, this distance is much greater for
 ${T}_{l\omega u}^{L\unicode{x1D6FA} U}$
or
 ${T}_{l\unicode{x1D6FA} U}^{L\unicode{x1D6FA} U}$
than for
 ${T}_{l\omega u}^{L\omega u}$
or
 ${T}^{l\omega u}_{l\unicode{x1D6FA} U}$
. Such results suggest that the combination, for example, of
 ${H}_{L\unicode{x1D6FA} U}$
with
 ${H}_{l\omega u}$
enhances the turbulent diffusivity of passive scalar when compared with that of
 ${H}_{L\omega u}$
and
 ${H}_{l\omega u}$
. This is linked to the value of
 $\phi$
at the centreline,
 $\phi _c$
, since the higher the diffusion, the lower the passive scalar mean value at the middle of the domain. In other words, given that the total domain quantity of
 $\phi$
is approximately constant, when the outer region has an increased value of scalar concentration, then its presence on the inner part should decrease accordingly. The evolution of
 $\phi _c$
with
 $x/H$
is shown in figure 10(a). Clearly, the preceding observation is more directly proved here:
 ${T}_{l\omega u}^{L\unicode{x1D6FA} U}$
and
 ${T}_{l\unicode{x1D6FA} U}^{L\unicode{x1D6FA} U}$
have a faster decrease of the centreline value, possibly due to the presence of an outer layer with a higher energy and
 ${Re}_{\lambda }$
, i.e.
 ${H}_{L\unicode{x1D6FA} U}$
. In contrast,
 ${T}_{l\omega u}^{L\omega u}$
and
 ${T}^{l\omega u}_{l\unicode{x1D6FA} U}$
have a slower decay. Nevertheless, interestingly, all profiles, apart from
 ${T}_{L\unicode{x1D6FA} U}^{L\omega u}$
, seem to follow a power law of the type
 $(x/H)^{-\beta }$
, with
 $\beta \sim 0.3$
, at the end of the domain. For the sake of comparison, and even though a quantitative assessment of
 $\beta$
is not under analysis, the theoretical exponents for axisymmetric jets would be
 $\beta =1$
, while for planar jets or wakes, one derives
 $\beta =0.5$
(Schlichting & Gersten Reference Schlichting and Gersten2016). The lack of mean shear in this flow might explain the slower decay rate, when compared with the aforementioned canonical cases. The two most important takeaways are that, on the one hand, different layers will induce dissimilar passive scalar centreline evolutions, confirming the utmost importance of turbulent properties in dictating the dynamics of
 $\phi$
, and, consequently, of TTIs. On the other hand, in the long term, i.e. for high enough
 $x/H$
, almost all curves tend to an asymptotic similar decay rate. There, homogenisation has largely taken place and perhaps the differences between layers are not so dramatic as to affect the passive scalar differently.
So far, the concentration of
 $\phi$
and its value at the centreline confirmed that the passive scalar is greatly influenced by the characteristics of each layer. However, it would be beneficial to find a metric that could provide something related to a direction, or trend, that could help in understanding the spreading of each turbulent region, ultimately connected to the exchanges occurring at the TTI, quantitatively. Focussing on the passive scalar variance yields great insight on this topic. Recalling, its contours are shown in the lower semiplanes of figure 9, for all six simulations. The maps of this quantity are similar for all simulations, with a peak of
 $\overline {\phi '^2}$
at
 $x/H\approx 0.5$
. Additionally, we can look at the direction of the maximum passive scalar variance for each
 $x/H$
. In some cases, it is tilted inwards, outwards or stays approximately horizontal (neutral), which clearly introduces a degree of freedom associated with the
 $y$
direction. We can more systematically compare these trends by defining a thickness based on the maximum passive scalar variance,
 \begin{equation} \delta _{{var}(\phi )}:\overline {\phi '^2}\left(x/H,y/H=\delta _{{var}(\phi )}/H\right)=\max \big(\overline {{\phi '}^2}\big). \end{equation}
At the inlet, the simulations should present
 $\delta _{{var}(\phi )}/H\approx 0.5$
and if this value decreases (increases), the physical interpretation is that the outer (inner) layer is prevailing. That occurs since
 $\overline {\phi '^2}$
is, analogously to
 $\overline {u'^2}$
, a measure of an energy. Therefore, if some external property is modifying the direction of maximum passive scalar energy, it surely is prescribing its properties. The evolution of
 $\delta _{{var}(\phi )}/H$
is summarised in figure 10(b).
Streamwise evolution of (a) the passive scalar concentration at the centreline (
 $y=0$
),
 $\phi _c$
, and (b) the half-width thickness based on the maximum passive scalar variance, for all simulations.

Despite the slight oscillatory behaviour (
 $\delta _{{var}(\phi )}$
is highly sensitive to small variations, but we are mostly interested in obtaining qualitative trends), it is clear that there are three different possibilities. In some cases,
 $\delta _{{var}(\phi )}/H$
grows, e.g.
 ${T}^{L\omega u}_{L\unicode{x1D6FA} U}$
and
 ${T}^{l\omega u}_{l\unicode{x1D6FA} U}$
, in others, it diminishes, e.g.
 ${T}_{l\omega u}^{L\omega u}$
,
 ${T}_{l\omega u}^{L\unicode{x1D6FA} U}$
,
 ${T}_{l\unicode{x1D6FA} U}^{L\unicode{x1D6FA} U}$
, or even stays approximately neutral, e.g.
 ${T}_{l\unicode{x1D6FA} U}^{L\omega u}$
. We can associate each of the layers’ properties (recalling table 1) with these trends, in an attempt to finally provide a general framework for the impact of
 $\omega '$
,
 $u'$
and
 $L_{11}$
on the spreading of passive scalar and TTIs. First, for the simpler cases, i.e. when we have fewer parameters varying, we can highlight some empirical observations. Namely, for
 ${T}_{l\omega u}^{L\omega u}$
and
 ${T}_{l\unicode{x1D6FA} U}^{L\unicode{x1D6FA} U}$
, even though the levels of
 $\omega '$
across the layers do not change, we see a trend on
 $\delta _{{var}(\phi )}$
. This means that this quantity alone is not capable of dictating the dynamics of
 $\delta _{{var}(\phi )}$
(otherwise a neutral behaviour would have been observed). From it, one can suggest that the r.m.s. of vorticity does not influence considerably the half-width thickness based on the maximum passive scalar variance. It may even be possible to go one step further and suggest that the spreading of turbulence across TTIs is not directly related to small-scale quantities. In these cases, since the outer layer is prevailing, we can say that either
 $L_{11}$
or
 $u'$
are relevant in imposing the orientation, since both of them are greater for the outer region. Thereupon, if we take this rationale further, assuming that
 $\omega '$
does not directly influence the trends, the evolution of
 $\delta _{{var}(\phi )}$
for
 ${T}_{L\unicode{x1D6FA} U}^{L\omega u}$
and
 ${T}_{l \unicode{x1D6FA} U}^{l\omega u}$
, which have a constant
 $L_{11}$
(cf. figures 8
a and 8
f), leads to the conclusion that, for these cases, the growth of
 $\delta _{{var}(\phi )}/H$
is totally dependent on
 $u'$
. Finally, the two simulations with all parameters varying suggest the following: for
 ${T}_{l\omega u}^{L\unicode{x1D6FA} U}$
, both
 $L_{11}$
and
 $u'$
are larger in the same layer; therefore, both properties shall work for the end result, i.e. to make the outer layer dominate, which induces a strongly inwards motion. However,
 ${T}_{l\unicode{x1D6FA} U}^{L\omega u}$
has a slightly higher
 $u'$
on the inner region, which would make this layer dominate, and a slightly lower
 $L_{11}$
, which would induce the outer layer to prevail. The end result is a neutral, not well-defined trend, as shown. Recalling the work of Tordella & Iovieno (Reference Tordella and Iovieno2006) on shearless turbulence mixing layers is pertinent. There, it is observed that, when the gradient in turbulent kinetic energy and integral length scale from one region to another have the same sign (i.e. either both are increasing or decreasing in the same direction), then there is a greater transport (in terms of kinetic energy) than when these gradients have different signs, i.e. are acting against each other. Here, an analogous situation occurs, however, for the passive scalar variance, ultimately connected to the spreading of each turbulent region in communication through the TTIs: for cases when
 $T_u^{({\textit{Outer}})}/T_u^{({\textit{Inner}})}\!\gt \!1$
and
 $L_{11}^{({\textit{Outer}})}/L_{11}^{({\textit{Inner}})}\!\gt \!1$
, there is a prevalence of the outer layer, whereas when
 $T_u^{({\textit{Outer}})}/T_u^{({\textit{Inner}})}\!\lt \!1$
and
 $L_{11}^{({\textit{Outer}})}/L_{11}^{({\textit{Inner}})}\!\lt \!1$
, the inner region dominates, both of which correspond to the situations where the transport is maximised. The case where
 $T_u^{({\textit{Outer}})}/T_u^{({\textit{Inner}})}\!\gt \!1$
and
 $L_{11}^{({\textit{Outer}})}/L_{11}^{({\textit{Inner}})}\!\lt \!1$
leads to an ill-defined behaviour, which is translated through the existence of contrary gradients. All this can be linked to the maps presented in figure 2. Indeed, one can suggest that, on the one hand, if we are located in the first quadrant of the
 $L_{11}{-}T_u$
map (figure 2
b), then the outer layer shall prevail. In opposition, if we are located in the third quadrant, the inner layer will prevail. The even quadrants reflect a not well-defined trend, ultimately concomitant to the fact that
 $T_u$
and
 $L_{11}$
are acting against each other. On the other hand, since
 $\omega '$
does not play a significant role on the spreading, the
 $\omega '{-}T_u$
map (figure 2
c) does not convey a clear trend. Eventually, we suggest that, more important than the values of
 $T_u$
or
 $L_{11}$
themselves, is the ratio from outer to inner, since some values for the various TTIs cases studied are located in the same coordinates on these maps, and they present similar trends.
5. Conditional dynamics close to spatially developing TTIs
Based on the rationale presented in § 3, that shows the physical relevance of identifying TTIs with a threshold on the passive scalar, i.e.
 $\phi _{{\rm th}}=0.5$
, conditional statistics of several small- and large-scale quantities were studied using a similar post-processing tool as that described by Zecchetto & da Silva (Reference Zecchetto and da Silva2021). Essentially, the way the algorithm computes the conditional statistics is divided into three parts: (i) the isosurface is identified with
 $\phi _{{\rm th}}=0.5$
; (ii) vectors normal to it are computed at each surface point, such that a local frame of reference is obtained; and (iii) the field under study is interpolated with a trilinear scheme, at a given distance, such that a conditional average can be performed. Points with
 $y_I\lt 0$
correspond to the outer region of the flow and those with
 $y_I\gt 0$
refer to the inner region, accordingly, as depicted in figure 11.
Schematic of the procedure to generate conditional statistics and the orientation of the interface-normal variable
 $y_I$
. Both the thickness and the geometry of the TTI are merely illustrative.

Moreover, the domain was divided into slabs of equal thickness (see figures 3
b and 3
c), enabling the study of the streamwise evolution of the conditional statistics, i.e. understanding the effects of turbulence decay. For the sake of a better convergence, a temporal average concerning several time instants was also considered for each slab. Figure 12 depicts conditional profiles of passive scalar,
 $\phi$
, and the dissipation of its variance normalised by the molecular diffusivity,
 $\kappa$
(which is equal to
 $\nu$
for unity
 $\textit {Sc}$
),
 \begin{align} \varepsilon _{\phi }/\kappa =\dfrac {\partial \phi }{\partial x_j}\dfrac {\partial \phi }{\partial x_j}, \end{align}
for simulation
 ${T}_{l\omega u}^{L\omega u}$
.
Conditional statistics of (a) normalised passive scalar,
 $\langle \phi \rangle _I$
, and (b) normalised dissipation of passive scalar (variance),
 $\langle \varepsilon _{\phi }\rangle _I/\kappa$
, for
 ${T}_{l\omega u}^{L\omega u}$
. A passive scalar jump,
 $\varDelta \phi$
, is highlighted near the interface (
 $y_I=0$
). Light/dark curves represent locations closer to the inlet/outlet of the domain, respectively.

Trivially, for
 $\langle y \rangle _I=0$
, i.e. at the TTI,
 $\langle \phi \rangle _I=0.5$
. Near the interface, there exists a steep gradient of the passive scalar, reflected in a sudden jump of thickness
 $\varDelta \phi \approx 0.4$
. This behaviour had been previously reported in the context of TNTIs (Westerweel et al. Reference Westerweel, Fukushima, Pedersen and Hunt2009), where it is justified that its presence is related, to some extent, to an invariance on the detection of the interface. On both turbulent cores, we attain two distinct and clearly defined states, with high and low values of
 $\phi$
. Therefore, even though
 $\textit {Sc}=1$
, the molecular diffusion of passive scalar is not troublesome, in the sense that it does not diffuse so much that a clear difference between both asymptotic states would cease to exist. This sharp separation between zones with
 $\phi \to 0$
and others with
 $\phi \to 1$
can be confronted with the volume fraction functions of figure 4(a).
Additionally, it is noteworthy to remark that for
 ${T}_{l\omega u}^{L\omega u}$
, the normalised passive scalar profiles seem symmetric with respect to the axis
 $\langle y\rangle _I$
. However, in cases where the layers exhibit a higher turbulent kinetic energy and are more dissimilar, e.g.
 ${T}_{l\unicode{x1D6FA} U}^{l\omega u}$
, we can observe a greater decrease in one of the sides, rendering a slight asymmetry within the profiles (not shown).
Regarding
 $\varepsilon _{\phi }$
, it exhibits a high-magnitude peak in close proximity to the interface, which is consistent with figure 12(a) since
 $\varepsilon _{\phi }$
is proportional to the gradient of
 $\phi$
, which is observed to be greater at the interface. A similar behaviour has been observed in the context of TNTIs (Attili, Cristancho & Bisetti Reference Attili, Cristancho and Bisetti2014). In terms of spatial decay, as
 $x$
increases, the turbulent core values of the passive scalar profiles get closer and the magnitude of
 $\varepsilon _{\phi }$
decreases.
Interestingly, we can further sustain our analysis by computing a thickness for the passive scalar profiles,
 $\varDelta _{\phi }$
, that is defined in a similar fashion to the aforementioned
 $\varDelta$
. In this case,
 $\varDelta _{\phi }$
uses conditional statistics which renders greater detail closer to the interface. In particular, we reshape the
 $\langle \phi \rangle _I$
curves similarly to what is done for the turbulent kinetic energy, in (4.1), such that the outer and inner turbulent cores present values of
 $0$
and
 $1$
for all
 $x/H$
slabs, respectively. Then,
 $\varDelta _{\phi }$
is defined as the distance, in terms of
 $\langle y\rangle _I$
, between the locations at which the newly normalised passive scalar takes values of 0.25 and 0.75 within the profiles. The resultant streamwise evolution of
 $\varDelta _{\phi }$
is shown in figure 13.
Streamwise evolution of the passive scalar thickness,
 $\varDelta _{\phi }$
, for all simulations. The black line showcases the subdiffusive growth obtained by Iovieno et al. (Reference Iovieno, Di Savino, Gallana and Tordella2014).

Overall, close to the inlet, all simulations show a subdiffusive growth, i.e.
 $\varDelta _{\phi }\sim (x/H)^{a}$
, with
 $a\lt 1/2$
. This is in line with the results of Jayesh & Warhaft (1994) and Iovieno et al. (Reference Iovieno, Di Savino, Gallana and Tordella2014). Particularly,
 ${T}^{L\omega u}_{L\unicode{x1D6FA} U}$
and
 ${T}^{L\unicode{x1D6FA} U}_{l\unicode{x1D6FA} U}$
seem to follow this strictly up to
 $x/H=0.85$
, while
 ${T}^{l\omega u}_{l\unicode{x1D6FA} U}$
is more diffusive. Towards the outlet, the growth rate decays, which we believe to be associated with the tendency for homogenisation in the streamwise direction. We further postulate that the similar growth rate, despite small deviations, of all simulations for small
 $x/H$
might be associated with the normalisation applied to the passive scalar profiles. Indeed, this reshaping decreases the asymmetry that exists in the profiles (recalling, some layers present faster decays, which would result in more unbalanced profiles). As a matter of fact, Iovieno et al. (Reference Iovieno, Di Savino, Gallana and Tordella2014) state in their study (which considers classical statistics) that when the ratio of turbulent kinetic energy is unitary, a similar subdiffusive growth is observed. However, they also remark that the the passive scalar profiles remain approximately symmetric. It remains to be seen if in cases of great inhomogeneity in the turbulent kinetic energy, where the profiles are possibly highly asymmetric, the same exponent would be visible.
5.1. Quasi-universality of small-scale dynamics
We now move into the detailed analysis of quantities associated with the velocity/vorticity fields. As such, figure 14 shows the conditional statistics of enstrophy and rate-of-strain magnitude,
 $\omega _i\omega _i$
and
 $s_{ij}s_{ij}$
, the most relevant small-scales quantities, for
 ${T}_{l\omega u}^{L\omega u}$
,
 ${T}_{l\omega u}^{L\unicode{x1D6FA} U}$
and
 ${T}_{l\unicode{x1D6FA} U}^{l\omega u}$
. Here, all curves were rescaled by a constant value corresponding to the turbulent core value of enstrophy or rate-of-strain magnitude of the slab closest to the inlet. From the two turbulent core regions, outer and inner, we choose the one with the highest magnitude of
 $\omega _i\omega _i$
or
 $s_{ij}s_{ij}$
. In terms of notation, we denote these values by
 $\langle \boldsymbol{\cdot }\rangle _T^{{(inlet)}}$
.
Conditional statistics of (a,c,e) enstrophy,
 $\langle \omega _i\omega _i\rangle _I$
, and (b,d,f) rate-of-strain magnitude,
 $\langle s_{ij}s_{ij}\rangle _I$
, for
 ${T}_{l\omega u}^{L\omega u}$
,
 ${T}_{l\omega u}^{L\unicode{x1D6FA} U}$
and
 ${T}_{l\unicode{x1D6FA} U}^{l\omega u}$
, respectively. Light/dark curves represent locations closer to the inlet/outlet of the domain, respectively.

Each of the three simulations were meticulously chosen to represent one of three distinct groups which showcase different qualitative evolutions of enstrophy or rate-of-strain magnitude: (i) when the levels of
 $\omega _i\omega _i$
and
 $s_{ij}s_{ij}$
are similar in both layers (as in
 ${T}_{l\omega u}^{L\omega u}$
and
 ${T}_{l\unicode{x1D6FA} U}^{L\unicode{x1D6FA} U}$
, cf. figures 6
b and 6
e for
 $\omega '$
); (ii) when the outer layer presents a higher magnitude of
 $\omega _i\omega _i$
and
 $s_{ij}s_{ij}$
(as observable in
 ${T}_{l\omega u}^{L\unicode{x1D6FA} U}$
, cf. figure 6
d), or (iii) when the inner layer has a greater magnitude of the small-scale terms (as in
 ${T}_{L\unicode{x1D6FA} U}^{L\omega u}$
,
 ${T}_{l\unicode{x1D6FA} U}^{L\omega u}$
or
 ${T}_{l\unicode{x1D6FA} U}^{l\omega u}$
, cf. figures 6
a, 6
c and 6
f). There are several key aspects regarding the spatial evolution of these quantities. First of all, both enstrophy and strain present a decay with
 $x$
, as expected, since the forcing is only located at the inlet, and the turbulence decays freely afterwards. For
 ${T}_{l\omega u}^{L\omega u}$
, the enstrophy profiles depict two small bumps, i.e. peaks, on each side of the TTI, whose presence can be associated to an increased vorticity near the TTI. However, when the magnitudes of enstrophy are quite dissimilar (for instance, the curves closer to the inlet in figures 14
c and 14
e), we observe only one (clear) peak in the layer with the highest level of vorticity magnitude, which starts recalling what is qualitatively observed in TNTIs (Zecchetto & da Silva Reference Zecchetto and da Silva2021). Indeed, it is almost as if, in the limit of very dissimilar levels of enstrophy (vorticity r.m.s.) between two layers,
 $\omega '^{(i)}\ll \omega '^{(j)}$
, we would tend to a TNTI.
In terms of the rate-of-strain magnitude, we observe a peak at the interface (
 $\langle y \rangle _I= 0$
), regardless of the location, meaning that this interfacial region is dominated by a straining motion. Nevertheless, TNTIs do not exhibit a peak of
 $s_{ij}s_{ij}$
and it is certainly relevant to understand the cause for its appearance in this context. If we compare the conditional strain,
 $\langle s_{ij}s_{ij}\rangle _I$
, closer to the inlet for simulations
 ${T}_{l\omega u}^{L\omega u}$
and
 ${T}_{l\unicode{x1D6FA} U}^{l\omega u}$
, we observe that the peak of the former reaches a magnitude almost twice that of the value at the turbulent cores, and hence is important. Yet, for the latter simulation, the strain peak has a relatively small magnitude when compared with the turbulent core value of the inner region (
 $\langle y\rangle _I\to \infty$
). As the flow decays, the peak, even though decreasing its magnitude, becomes more dominant with respect to the turbulent core values, since the strain levels get closer, eventually tending to the state of
 ${T}_{l\omega u}^{L\omega u}$
. However, if we extend this argument in reverse, then as the difference in the two bulk rate-of-strain magnitudes increases, the local peak at the interface diminishes in importance until it becomes negligible, thereby recovering the phenomenology of a TNTI. All in all, we present this schematic that consists of: (i) a TNTI being a special case of the more general TTIs when the difference in the levels of
 $\omega '$
is taken ad extremum; and (ii) a TTI with similar levels of
 $\omega '$
in both turbulent regions being the asymptotic case to which the interfaces tend after a sufficiently long spatial decay.
The observation of peaks and valleys in the enstrophy and strain-rate magnitude motivates the use of a normalisation of the former by the local Kolmogorov microscales (Zecchetto & da Silva Reference Zecchetto and da Silva2021),
 $u_{\eta }\equiv (\nu \varepsilon )^{1/4}$
and
 $\eta$
. Dimensionally, it can be analytically expressed as
 $\langle \omega _i\omega _i\rangle _I/(\langle u_{\eta }\rangle _I/\langle \eta \rangle _I)^2$
. Notice that one can also interpret this normalisation as being the relation between enstrophy and the Kolmogorov time scale,
 $\tau _{\eta }\equiv \eta /u_{\eta }$
, yielding
 $\langle \omega _i\omega _i \rangle _I\langle \tau _{\eta }\rangle _I^2$
. Additionally, it is particularly useful (and equivalent) to understand it as a balance between the average enstrophy and (twice) the average rate of rate-of-strain magnitude,
 $\langle \omega _i\omega _i\rangle _I/\langle 2s_{ij}s_{ij} \rangle _I$
. These profiles are shown in figure 15 for all six simulations and at
 $x/H\in [0.5;0.6]$
.
Conditional profiles of enstrophy normalised by local Kolmogorov microscales at
 $x/H\in [0.5;0.6]$
for
 ${T}_{L\unicode{x1D6FA} U}^{L\omega u}\!$
,
 ${T}_{l\omega u}^{L\omega u}\!$
,
 ${T}_{l\unicode{x1D6FA} u}^{L\omega u}\!$
,
 ${T}_{l\omega u}^{L\unicode{x1D6FA} U}\!$
,
 ${T}_{l\unicode{x1D6FA} U}^{L\unicode{x1D6FA} U}$
and
 ${T}_{l\unicode{x1D6FA} U}^{l \omega u}$
.

Qualitatively, all simulations present a similar double-peak curve, regardless of their different parameters. These shapes are in line with the results of Nakamura et al. (Reference Nakamura, Watanabe and Nagata2023) and Chen & Buxton (Reference Chen and Buxton2024). Since the strain has a peak close to the interface location (cf. figure 14
b, d, f; however, relatively less prominent the greater the vorticity magnitude difference), it will provoke a minimum on the Kolmogorov-normalised enstrophy profile near
 $\langle y\rangle _I=0$
. The visible valleys siding the strain peak will result from the bumps that were observed on the conditional enstrophy profiles (cf. figure 14
a, c, e). As we move towards the turbulent cores,
 $\langle y \rangle _I/\langle \eta \rangle _I\to \pm \infty$
, the normalisation tends to
 $1$
, which is a kinematic constraint for homogeneous flows (Tsinober Reference Tsinober2000; Zecchetto & da Silva Reference Zecchetto and da Silva2021). Nonetheless, the slightly different value can be attributed to the location of the slab, which is still close to the inlet and some adjustment to the initial condition could be taking place. In terms of the distance between these consecutive maxima, values in line with the results of Nakamura et al. (Reference Nakamura, Watanabe and Nagata2023) are obtained, i.e.
 $\langle y\rangle _I/\langle \eta \rangle _I\approx 6{-}7$
. This represents roughly half the value reported for this distance by Chen & Buxton (Reference Chen and Buxton2024). When comparing all curves, we notice two points of relevance. On the one hand, there exist curves which are almost superimposed, such as
 ${T}_{l\unicode{x1D6FA} U}^{L\omega u}$
and
 ${T}_{l\unicode{x1D6FA} U}^{l\omega u}$
, in spite of having completely different evolutions of the large-scale parameters (e.g.
 ${T}_{l\unicode{x1D6FA} U}^{L\omega u}$
has a gradient on
 $L_{11}$
, while
 ${T}_{l\unicode{x1D6FA} U}^{l\omega u}$
does not). This means that the large-scale parameters play no significant role on the local dynamics of TTIs. Yet, one cannot say the same about the small-scale quantities, such as
 $\omega '$
. Indeed, the magnitude of the peaks is precisely associated with how different are the levels of vorticity fluctuations. To show this, we evaluate the streamwise evolution of
 $\langle \omega _i\omega _i\rangle _I/(\langle u_{\eta } \rangle _I/\langle \eta \rangle _I)^2$
, as presented in figure 16, recalling that as the flow develops, the levels of enstrophy generically homogenise.
Conditional profiles of enstrophy normalised by local Kolmogorov microscales at several streamwise locations for (a)
 ${T}_{l\omega u}^{L\omega u}$
, (b)
 ${T}_{l\omega u}^{L\unicode{x1D6FA} U}$
and (c)
 ${T}_{l\unicode{x1D6FA} U}^{l\omega u}$
. Light/dark curves represent locations closer to the inlet/outlet of the domain, respectively. The arrows point in the downstream direction.

Fundamentally, for
 ${T}_{l\omega u}^{L\omega u}$
, with similar (low)
 $\omega '$
levels on both sides, especially closer to the inlet, the curves are approximately invariant to the slab
 $x/H$
, and the peaks have similar magnitudes, i.e.
 $\langle \omega _i\omega _i \rangle _I/ \langle 2s_{ij}s_{ij}\rangle _I\approx {1.25}$
, which is well in agreement with the value obtained for TNTIs,
 $\langle \omega _i\omega _i \rangle _I/ \langle 2s_{ij}s_{ij}\rangle _I=1.248$
(Zecchetto & da Silva Reference Zecchetto and da Silva2021). For
 ${T}_{l\omega u}^{L\unicode{x1D6FA} U}$
, the inner region has an initial smaller
 $\omega '$
, inducing a diminished peak magnitude. Here, the impact of
 $x/H$
is non-negligible: as
 $x/H$
increases, the correspondent peak is slowly shifted upwards. This can be interpreted in light of the observations previously remarked: turbulence decays and tends to an homogeneous configuration, and we would eventually reach an asymptotic state similar to that of
 ${T}_{l\omega u}^{L\omega u}$
, where the magnitude of the peaks is similar, since both regions have comparable enstrophies. A mirrored case occurs for
 ${T}_{l \unicode{x1D6FA} U}^{l\omega u}$
, where it is the outer region with the lowest r.m.s. of vorticity. Here, the evolution of the peak magnitude corresponding to the outer layer is even clearer, since the levels of enstrophy on the slabs closer to the outlet are much more comparable (cf. figure 14
e). It has become clear how the only parameter differentiating all curves is how contrasting the levels of vorticity magnitude are on each layer, i.e.
 $\omega '^{{(\textit{Outer})}}/\omega '^{{(\textit{Inner})}}$
. This sustains the previous remark that neither the integral length scale,
 $L_{11}$
, nor the turbulence intensity,
 $T_u$
, both of which are large-scale properties, impact the dynamics of small-scale quantities near the TTIs.
Due to this quasi-universality, one may wonder about the flow structures near the TTIs. Figure 4(b) had already shown that the passive scalar correctly distinguishes zones with two different non-null vorticity magnitudes, but the inherent two-dimensionality and the use of
 $\sqrt {\omega _i\omega _i}$
, does not allow for a proper assessment of the eddies in close proximity to the TTI. In figure 17, we show a three-dimensional visualisation of rotational structures identified with a value of the second invariant of the velocity gradient tensor (VGT),
 $Q=4000$
(arbitrary units) for
 ${T}_{l\unicode{x1D6FA} U}^{l\omega u}$
and
 $x/H\in [0.4;0.8]$
. These are coloured by the passive scalar field, and are separated between those identified in the inner region (figure 17
a) and in the outer region (figure 17
b).
Three-dimensional visualisation of the flow structures. The rotational eddies identified by the
 $Q=4000$
(arbitrary units) inside the (a) inner and (b) outer layers are coloured by the passive scalar concentration. The translucent surface corresponds to the TTI. The snapshot of an arbitrary time instant refers to simulation
 ${T}_{l\omega u}^{l\omega U}$
.

The vortices closer to the interface are (visually) tangent to the TTI. Despite not being as clear as in the case of TNTIs (da Silva, Dos Reis & Pereira Reference da Silva, Dos Reis and Pereira2011), the turbulent/turbulent interface does not cut a vortex in the normal direction. Moreover, the inner layer has a much higher density of eddies than the outer layer, which is in total agreement with the conditional enstrophy statistics of figure 14 and the inlet imposition (cf. table 2). Both these arguments ultimately support the quasi-universality previously sketched: on average, the eddies are tangent on both sides of the TTI, which induces a straining motion in between both, and a higher rotationality on either side of the interface. This is in line with the results of Kankanwadi & Buxton (Reference Kankanwadi and Buxton2022) pertaining the enhanced interface-normal rate-of-strain near TTIs, which is associated with a local anisotropy. In addition, the lesser density of eddies on one side yields a smaller magnitude of the normalised peak. Eventually, if there were no eddies in one of the regions (TNTI type of situation), we would recover a profile with a single maximum.
This whole discussion, strictly related to the connection between enstrophy and the strain-rate magnitude in the vicinity of TTIs, cannot be underestimated. Recalling the works of Buaria et al. (Reference Buaria, Pumir, Bodenschatz and Yeung2019, Reference Buaria, Pumir and Bodenschatz2020) on extreme velocity gradients is pertinent, as they have provided some insight on the relation between those variables, i.e.
 $\omega _i\omega _i$
and
 $s_{ij}s_{ij}$
. In particular, they found that whenever these quantities are much smaller than the average, they appear to be decorrelated, whereas if they are much larger, they present a power-law dependence, e.g. enstrophy conditioned on rate-of-strain magnitude grows linearly with it. It would be interesting to see if these observations hold in the inhomogeneous cases of turbulent/turbulent interfaces, where the premise
 $\langle \omega _i\omega _i\rangle _I=\langle 2s_{ij}s_{ij}\rangle _I$
does not hold everywhere.
5.2. Budgets of
 $\omega _i\omega _i$
and
$s_{ij}s_{ij}$


Understanding the dynamics behind the evolution of
 $\omega _i\omega _i$
and
 $s_{ij}s_{ij}$
requires a detailed look over the terms that govern each of these quantities. Indeed, we have (Zecchetto & da Silva Reference Zecchetto and da Silva2021)
 \begin{equation} \underbrace {\vphantom {\dfrac {\partial ^2}{\partial x_j}}\dfrac {D}{Dt}\Big (\dfrac {\omega _i\omega _i}{2}\Big )}_{\textstyle {T_{\omega }}}=\underbrace {\vphantom {\dfrac {\partial ^2}{\partial x_j}}\omega _i\omega _js_{ij}}_{\textstyle {P_{\omega }}}+\underbrace {\nu \dfrac {\partial ^2}{\partial x_j\partial x_j}\Big (\dfrac {\omega _i\omega _i}{2}\Big )}_{\textstyle {D_{\omega }}}-\underbrace {\nu \dfrac {\partial \omega _i}{\partial x_j}\dfrac {\partial \omega _i}{\partial x_j}}_{\textstyle {E_{\omega }}}, \end{equation}
where
 $T_{\omega }$
refers to the total variation of enstrophy,
 $P_{\omega }$
accounts for inertial production of enstrophy via vorticity stretching,
 $D_{\omega }$
is the (viscous) diffusion and
 $E_{\omega }$
the (viscous) dissipation. Moreover, for the rate-of-strain magnitude, the governing equation is given by (Tsinober Reference Tsinober2000)
 \begin{align} \underbrace {\vphantom {\dfrac {\partial ^2}{\partial x_k}}\dfrac {D}{Dt}\Big (s_{ij}s_{ij}\Big )}_{\vphantom {{D_{s}^{(\nu )}}}\textstyle {T_s}}=\underbrace {\vphantom {\dfrac {\partial ^2}{\partial x_k}}-2s_{ij}s_{jk}s_{ki}}_{\vphantom {{D_{s}^{(\nu )}}}\textstyle {P_s}}\underbrace {\vphantom {\dfrac {\partial ^2}{\partial x_k}}-\dfrac {1}{2}\omega _i\omega _js_{ij}}_{\textstyle {\vphantom {{D_{s}^{(\nu )}}} -P_{\omega }/2}}\underbrace {\vphantom {\dfrac {\partial ^2}{\partial x_k}}-2s_{ij}\nabla^2_{ij}p}_{\textstyle {D_s^{(p)}}}+\underbrace {\nu \dfrac {\partial ^2}{\partial x_k\partial x_k}\Big ({s_{ij}s_{ij}}\Big )}_{\textstyle {D_{s}^{(\nu )}}}\underbrace {-2\nu \dfrac {\partial s_{ij}}{\partial x_k}\dfrac {\partial s_{ij}}{\partial x_k}}_{\vphantom {{D_{s}^{(\nu )}}}\textstyle {E_{s}}}, \end{align}
where
 ${\nabla} ^2_{ij}(\boldsymbol{\cdot })\equiv \partial ^2(\boldsymbol{\cdot })/\partial x_i\partial x_j$
,
 $p$
is the pressure,
 $T_s$
is the total variation of rate-of-strain magnitude,
 $P_{s}$
is the production of rate-of-strain via its own self-amplification,
 $D_s^{(p)}$
is a pressure Hessian term accounting for diffusion of strain,
 $D_{s}^{(\nu )}$
is the (viscous) diffusion of strain and
 $E_s$
is the (viscous) dissipation.
Figure 18 shows the enstrophy budget terms of simulations
 ${T}_{l\omega u}^{L\omega u}$
and
 ${T}_{l\unicode{x1D6FA} U}^{l \omega u}$
at three different
 $x/H$
locations, i.e.
 $x/H\in [0.5;0.6]$
,
 $x/H\in [1.0;1.1]$
and
 $x/H\in [1.5;1.6]$
.
Spatial evolution of
 $\omega _i\omega _i$
budget terms for (a)
 ${T}_{l\omega u}^{L\omega u}$
and (b)
 ${T}_{l\unicode{x1D6FA} U}^{l\omega u}$
. The dashed, dotted and dash-dotted lines represent respectively the enstrophy (vorticity stretching) inertial production, enstrophy (viscous) diffusion and its (viscous) dissipation. Light/dark curves represent locations closer to the inlet/outlet of the domain, respectively. The arrows point in the downstream direction.

For
 ${T}_{l\omega u}^{L\omega u}$
(figure 18
a), the situation is clear:
 $D_{\omega }$
is negligible when compared with
 $P_{\omega }$
or
 $E_{\omega }$
. This is in line with the findings of Kankanwadi & Buxton (Reference Kankanwadi and Buxton2022). The key cause for this behaviour can be attributed to two reasons: (i) both layers have similar levels of enstrophy and, therefore, barely any inhomogeneity (in terms of enstrophy) exists which would engender a diffusive mechanism; (ii) the local
 ${Re}_{\lambda }\gtrsim 100$
, which ensures that the role of inertial forces exceeds those of viscous agents. Moreover, since similar properties (in terms of the small-scales) exist in both layers, the terms
 $P_{\omega }$
and
 $E_{\omega }$
have a comparable magnitude in the cores of the inner and outer regions. At the interface, we observe extrema in these quantities: the production is greater since the rate-of-strain magnitude peaks at
 $\langle y\rangle _I=0$
, while the dissipation is increased due to the higher gradient of enstrophy close to the TTI. Finally, there seems to qualitatively exist an equilibrium far enough from the interface, since
 $|P_{\omega }|\approx |E_{\omega }|$
; particularly so for the inner region, whilst a slight imbalance exists in the outer region. This confirms that, in spite of the similar levels of
 $\omega '$
, these two layers have different properties. Nevertheless, the values towards which the quantities
 $\langle P_{\omega }\rangle _I/(\langle u_{\eta }\rangle _T/\langle {\eta }\rangle _T)^3$
and
 $\langle E_{\omega }\rangle _I/(\langle u_{\eta }\rangle _T/\langle {\eta }\rangle _T)^3$
tend are well in agreement with those reported in the turbulent cores of TNTIs (Zecchetto & da Silva Reference Zecchetto and da Silva2021). Indeed, despite some scatter, since the normalisation by the Kolmogorov turbulent core quantities does not collapse all curves, those authors obtained
 $\langle P_{\omega }\rangle _T/(\langle u_{\eta }\rangle _T/\langle {\eta }\rangle _T)^3\sim 0.15{-}0.17$
while
 $\langle E_{\omega }\rangle _T/(\langle u_{\eta }\rangle _T/\langle {\eta }\rangle _T)^3\sim 0.13{-}0.18$
, both of which are also observed in this particular TTI. For
 ${T}_{l\unicode{x1D6FA} U}^{l\omega u}$
(figure 18
b), the picture is not so clear. Indeed, there is a spatial effect occurring, similarly to what had been explored for the normalised enstrophy (cf. figure 16
c). We notice two aspects: (i) the diffusive term,
 $D_{\omega }$
, continues to be smaller than both the vorticity stretching or the dissipation. However, its magnitude does not change noticeably with the streamwise direction,
 $x/H$
, (not shown); (ii) closer to the inlet, the layer with the smallest
 $\omega '$
level (i.e. outer) also exhibits a diminished
 $P_{\omega }$
and
 $E_{\omega }$
, when compared with the inner region (in opposition to the behaviour of
 ${T}_{l\omega u}^{L\omega u}$
). The evolution of the maximum of
 $P_{\omega }$
at the interface is worth analysing. For TNTIs, the production has no peak at the irrotational boundary (in fact,
 $P_{\omega }\approx 0$
, due to the lack of vorticity at this boundary in TNTIs). Here, even though a peak exists, it becomes increasingly small as we move towards the inlet, and the same can be argued about the dissipation. Once again, extending this observation to a limiting case (in a ‘thought experiment’), the peak would not be relevant, and we would tend to a TNTI-like behaviour. In addition, the terms on the low-magnitude region would tend to
 $0$
and, assuming that the magnitude of
 $D_{\omega }$
would not change, this would accordingly dominate.
Spatial evolution of
 $s_{ij}s_{ij}$
budget terms for (a)
 ${T}_{l\omega u}^{L\omega u}$
and (b)
 ${T}_{l\unicode{x1D6FA} U}^{l\omega u}$
. The solid, solid with markers, dashed, dotted and dash-dotted lines represent respectively the rate-of-strain self-amplification, the rate-of-strain dissipation, the production of enstrophy, the pressure Hessian term and the viscous diffusion of strain. Light/dark curves represent locations closer to the inlet/outlet of the domain, respectively. The arrows point in the downstream direction. The inset in panel (b) shows the pressure Hessian term near the TTI.

Analogously, figure 19 shows the rate-of-strain magnitude budget terms. Clearly, the strain self-amplification,
 $P_s$
, is the highest contributor to the production of rate-of-strain for any of the simulations. It is globally balanced by the dissipation of strain,
 $E_s$
, and the vorticity stretching,
 $-P_{\omega }/2$
. The vorticity stretching is responsible for transforming straining to rotational motion since it diminishes the rate-of-strain while it increases enstrophy. Looking particularly at
 ${T}_{l\omega u}^{L\omega u}$
(figure 19
a), one observes that both layers present similar magnitudes of any term when
 $\langle y \rangle _I\to \pm \infty$
, whereas this is not the case for
 ${T}_{l\unicode{x1D6FA} U}^{l\omega u}$
(figure 19
b). Such behaviour is expected, based on the previous analysis concerning the terms governing
 $\omega _i\omega _i$
. Indeed,
 ${T}_{l\unicode{x1D6FA} U}^{l\omega u}$
showcases an increased magnitude of
 $P_s$
and
 $E_{s}$
, in the inner region, which is more energetic from the small-scale point of view. Regarding the extremes at the interface (for both
 $P_s$
and
 $E_s$
), we can refresh the remarks previously made on its diminished magnitude for when the rate-of-strain magnitude levels in each layer differ significantly. Moreover, the viscous diffusion term,
 $D_s^{(\nu )}$
, is negligible for any of the cases. However, one cannot say the same thing about the pressure Hessian term,
 $D_{s}^{(p)}$
. Indeed, for
 ${T}_{l\unicode{x1D6FA} U}^{l\omega u}$
, it has a value of the same order of magnitude as that of
 $-P_{\omega }/2$
close to the TTI. When zooming in at
 $\langle y\rangle _I\approx 0$
, as shown in the inset of figure 19(b), one notices that
 $D_{s}^{(p)}$
has a minimum value at the TTI, whose magnitude is
 ${\sim} 75\,\%$
of
 $-P_{\omega }/2$
; hence, almost equally important. Recall figure 14(b,d,f), where it is shown that the rate-of-strain magnitude peaks at the interface,
 $\langle y\rangle _I=0$
(however, with a relatively smaller magnitude when the layers have very dissimilar levels of enstrophy). At the TTI, the (non-local) pressure term, by acting as a sink, will try to balance the rapid rise of strain. Similarly, in the inner region, there is a peak of
 $D_s^{(p)}$
coincident with the rapid decrease of
 $\langle s_{ij}s_{ij}\rangle _I$
. It is also intriguing that the magnitude of
 $D_s^{(p)}/(\langle u_{\eta }\rangle _T/\langle {\eta }\rangle _T))^3$
is somewhat constant, regardless of the
 $x/H$
locations. Presumably, had the levels of enstrophy been more different (closer to a TNTI type of situation), this term could have overcome either of the other two main terms, i.e.
 $P_s$
or
 $E_s$
. As a matter of fact, Holzner et al. (Reference Holzner, Lüthi, Tsinober and Kinzelbach2009) showed that
 $D_{s}^{(p)}$
is also minimum (and negative) at the TNTI. In addition to the aforementioned relation between enstrophy and rate-of-strain magnitude for homogeneous flows,
 $\langle \omega _i\omega _i\rangle _I/(2\langle s_{ij}s_{ij}\rangle _I)=1$
, there is also a parallel connection (under the same homogeneity condition) between rate-of-strain self-amplification and production of enstrophy (Tsinober Reference Tsinober2000),
 \begin{equation} -\dfrac {4}{3}\dfrac {\langle s_{ij}{s_{jk}}{s_{ki}}\rangle _I}{\langle \omega _i\omega _js_{ij} \rangle _I}=1 \iff \dfrac {\langle P_s \rangle _I}{\langle P_{\omega } \rangle _I}=3/2. \end{equation}
Recalling figures 18(a) and 18(b), we observe, at the inner and outer turbulent core regions,
 $\langle P_{\omega } \rangle _T/(\langle u_{\eta }\rangle _T /\langle {\eta }\rangle _T)^3 \sim 0.16$
, where the flow has a HIT behaviour. The relation (5.4) yields
 $\langle P_{s} \rangle _T/(\langle u_{\eta }\rangle _T /\langle {\eta }\rangle _T)^3 \sim 0.24$
. This is remarkably consistent with the results of figures 19(a) and 19(b); hence, further supporting these findings.
5.3. Conditional profiles of large-scale dynamics in TTIs
To conclude the conditional analysis, it is pertinent to assess profiles of large-scale quantities. We have observed that using a passive scalar threshold is physically relevant as it is capable of distinguishing between states with high and low vorticity magnitude (cf. figures 14
c and 14
e). However, we need to understand if
 $\phi _{\rm{th}}$
can also differentiate two states of turbulent kinetic energy. Figure 20 conveys conditional profiles of turbulence intensity for simulations
 ${T}_{l\omega u}^{L\omega u}$
and
 ${T}_{l\unicode{x1D6FA} U}^{l\omega u}$
at several streamwise locations.
Conditional statistics of turbulence intensity,
 $\langle T_u\rangle _I$
for (a)
 ${T}_{l\omega u}^{L\omega u}$
and (b)
 ${T}_{l\unicode{x1D6FA} U}^{l\omega u}$
. Light/dark curves represent locations closer to the inlet/outlet of the domain, respectively.

The first thing that can be noticed about the dynamics of
 $\langle T_u\rangle _I$
close to the TTI is that it is smoother than either of the small-scale quantities (i.e. enstrophy or rate-of-strain magnitude), something that had been previously observed both in the context of TTIs (Kankanwadi & Buxton Reference Kankanwadi and Buxton2020) or TNTIs (Westerweel et al. Reference Westerweel, Fukushima, Pedersen and Hunt2009; Taveira & da Silva Reference Taveira and da Silva2013). The small peak at the interface might be caused by the way the statistics are computed (cf. Taveira & da Silva Reference Taveira and da Silva2013) or can be reminiscent of a statistical artefact. Nevertheless, the quantitative agreement between the
 $\langle T_u\rangle _I$
magnitudes within the turbulent core regions is remarkable. For instance, notice how the inner region of
 ${T}_{l\omega u}^{L\omega u}$
(
 $\langle y\rangle _I\gg 0$
) and the outer region of
 ${T}_{l\unicode{x1D6FA} U}^{l\omega u}$
(
 $\langle y\rangle _I\ll 0$
) have almost the exact same evolution: it starts at
 $\langle T_u\rangle _I \approx 0.31$
for
 $x/H\in [0.5;0.6]$
and it reaches
 $\langle T_u\rangle _I \approx 0.17$
in the last slab. After all, these correspond to the same layer,
 ${H}_{l\omega u}$
, in terms of turbulence properties. In contrast, the outer and inner regions of
 ${T}_{l\omega u}^{L\omega u}$
and
 ${T}_{l\unicode{x1D6FA} U}^{l \omega u}$
are dissimilar, but the flow adjusts itself to preserve as smooth a transition as possible.
The analysis of the rate-of-strain magnitude budget terms (figure 19) highlighted the importance of pressure as a mediator of the rate-of-strain dynamics, in close proximity to the TTI. Therefore, figure 21 shows the mean conditional pressure,
 $\langle p\rangle _I$
, for both
 ${T}_{l\omega u}^{L\omega u}$
and
 ${T}_{l\unicode{x1D6FA} U}^{l \omega u}$
, normalised by the convection velocity
 $U_{\infty }$
.
Conditional statistics of mean pressure normalised by the convection velocity,
 $\langle p\rangle _I/U_{\infty }^2$
, for (a)
 ${T}_{l\omega u}^{L\omega u}$
and (b)
 ${T}_{l\unicode{x1D6FA} U}^{l\omega u}$
. Light/dark curves represent locations closer to the inlet/outlet of the domain, respectively.

Two very distinct behaviours are observed for
 $\langle p \rangle _I$
. On the one hand,
 ${T}_{l\omega u}^{L\omega u}$
has a quasi-constant mean pressure across both layers. The small difference is, however, concomitant with the profiles of
 $\langle T_u\rangle _I$
of figure 20(a), in the sense that a higher magnitude of the turbulence intensity corresponds to a more negative value of
 $\langle p \rangle _I/U_{\infty }^2$
. Indeed, the estimate of Teixeira & da Silva (Reference Teixeira and da Silva2012) for TNTIs yields great qualitative insight. There, it is suggested that, based on rapid distortion theory, in the turbulent core, the relation
 $\langle p \rangle _I/\rho _0=-2/3\langle k\rangle _I$
holds, where
 $\rho _0$
is the fluid’s constant density. Therefore, the higher the
 $\langle T_u\rangle _I$
, the more negative is
 $\langle p\rangle _I$
. On the other hand, for
 ${T}_{l\unicode{x1D6FA} U}^{l \omega u}$
, we observe a non-constant average pressure. For the first slabs, located closer to the inlet, there seems to still exist an adjustment to the initial condition. Afterwards, the outer region constantly presents a less negative magnitude than the inner layer. Once again, this is in agreement with the results of figure 20(b), where it is observed that the outer region presents a smaller turbulence intensity. Specifically, the slab closest to the outlet shows a quasi-constant
 $\langle p \rangle _I/U_{\infty }^2$
, inline with the almost unchanged conditional
 $\langle T_u \rangle _I$
. The Reynolds-averaged NSEs applied to each slab, assuming homogeneity in the
 $x$
and
 $z$
directions, also allow for verifying that there exists a relation between the gradient of the mean pressure in the normalwise direction,
 $\partial \overline {p}/\partial y$
, and the corresponding variation of the variance of the velocity fluctuations,
 $\partial (\overline {v'^2})/\partial y$
. The proportionality between both quantities is confirmed, as
 $\langle p \rangle _I$
changes more rapidly near the inlet, where the inhomogeneity in the turbulence intensity is the greatest.
It is well known that the pressure is responsible for redistributing the turbulent kinetic energy between each velocity component (Tennekes & Lumley Reference Tennekes and Lumley1972). This occurs via the correlation between its fluctuation,
 $p'$
, and the gradients of the velocity r.m.s.,
 $\partial u_i^{\prime}/\partial x_j$
. Hence, one is interested in analysing the pressure variance,
 $\langle p'^2\rangle _I$
, as shown in figure 22, for the same simulations
 ${T}_{l\omega u}^{L\omega u}$
and
 ${T}^{l\omega u}_{l\unicode{x1D6FA} U}$
, once again normalised by
 $U_{\infty }$
.
Conditional statistics of pressure variance normalised by the convection velocity,
 $\langle p'^2\rangle _I/U_{\infty }^4$
, for (a)
 ${T}_{l\omega u}^{L\omega u}$
and (b)
 ${T}^{l\omega u}_{l\unicode{x1D6FA} U}$
. Light/dark curves represent locations closer to the inlet/outlet of the domain, respectively.

For
 ${T}_{l\omega u}^{L\omega u}$
, the gradient of
 $T_u$
is small and, therefore, there are no particularly interesting dynamics pertaining to the pressure fluctuations. However, for
 ${T}^{l\omega u}_{l\unicode{x1D6FA} U}$
, since the gradient of
 $T_u$
is steeper, there is a maximum of
 $\langle p'^2\rangle _I$
close to the interface. This is in line with the results reported for TNTIs (Taveira & da Silva Reference Taveira and da Silva2013), especially for the slabs closer to the inlet. There, a peak is also observed; however, slightly shifted towards the rotational region.
Ultimately, the following sketch can be drawn: pressure, a large-scale quantity, shows relevant dynamics at the TTIs, influencing in a non-negligible way the rate-of-strain magnitude via the pressure Hessian term (cf. figure 19
b). In turn,
 $s_{ij}$
, a quantity exhibiting large- and small-scales characteristics (Elsinga et al. Reference Elsinga, Ishihara, Goudar, Da Silva and Hunt2017), will act on the dynamics of enstrophy, via the vorticity stretching mechanism, an essential contribution for
 $\omega _i\omega _i$
(cf. figures 18
a and 18
b). The latter is a small-scale quantity that showcases very distinct characteristics near the TTI. This path connects the large-scale phenomena to the small-scale universal quantities.
6. Conclusions
A novel approach to simulating turbulent flows was developed, consisting of running simultaneously three DNS with two different codes, which allows for creating spatially evolving TTIs without mean shear. The procedure permits virtually any turbulent property to be specified (within the constraints of the simulation size) with a high accuracy and degree of control. The temporally evolving code is used to generate time-correlated HIT velocity planes that naturally are solutions to the NSEs. The spatially developing code uses these planes, alongside a convection velocity and a passive scalar hyperbolic tangent inlet profile, to create two adjacent flowing turbulent layers. In between these, spatially evolving TTIs without mean shear are formed. Six different well-converged simulations with
 $146 \lesssim {Re}_{\lambda } \lesssim 296$
and a resolution of, at least,
 ${k}_{\textit{max}}\eta \sim 1{-}1.5$
, were obtained.
Initially, the employment of a passive scalar threshold to identify TTIs was carefully assessed using the volume fraction function. It was shown that, regardless of the streamwise location, the point where this function changed the least is in the neighbourhood of
 $\phi =0.5$
. Classical statistics of relevant large- and small-scale quantities were computed with the intent of, first, physically verifying this new inlet condition and also understanding the flow development. In particular, when assessing contours of
 $\omega '$
and
 $T_u$
, it was found that whenever these quantities present an inhomogeneity, there is a turbulent region that tends to dominate over the other (observable by the curvature of the isolines). Transverse profiles of the turbulent kinetic energy, when properly normalised, were shown to be in agreement with the shearless turbulence mixing layers of Veeravalli & Warhaft (Reference Veeravalli and Warhaft1989), Tordella & Iovieno (Reference Tordella and Iovieno2006) and Nakamura et al. (Reference Nakamura, Matsushima, Zheng, Nagata and Watanabe2022), provided that the turbulence intensity levels are dissimilar enough. Therefore, this flow was presented as a generalisation of a shearless turbulence mixing layer, where no particular restriction is imposed on the turbulent kinetic energy levels of each layer.
Moreover, the profiles of the integral length scale suggested that the presence of a gradient in this variable promotes a coupling between the regions, with the higher-magnitude layer influencing the other. Next, the passive scalar was assessed and the evaluation of its variance, combined with a new metric, the half-width thickness based on the maximum passive scalar variance, shed light on the prevailing layer. In particular, it allowed for observing that the small-scale quantities have a diminished impact on the flow development, while the turbulence intensity and integral length scale greatly influence the spreading of turbulent regions. These conclusions, in terms of the impact of turbulent properties on the passive scalar variance, can be argued to be in line with the observations of Tordella & Iovieno (Reference Tordella and Iovieno2006) (in their work in terms of turbulent kinetic energy). Furthermore, it is suggested that more important than the values of
 $L_{11}$
or
 $T_u$
per se are the ratios of these quantities across the two layers.
Conditional statistics of quantities depending on their distance from the interfacial layers were computed. The passive scalar shows a large jump across the TTI, while the dissipation of its variance reveals a peak. The thickness of these profiles grows with the streamwise distance at a subdiffusive rate comparable to values previously reported in the literature. The profiles of enstrophy and rate-of-strain magnitude showed a decay and tendency towards homogenisation with streamwise direction. Furthermore, the former has one or two peaks in each side of the TTIs (depending on how unalike are the magnitudes on each region), while the latter has a peak at the interface (with a relative preponderance that gets diminished for greater differences in the rate-of-strain magnitude levels). However, when properly normalised by the local Kolmogorov microscales (Zecchetto & da Silva Reference Zecchetto and da Silva2021), we observe a universal double-peaked curve for enstrophy, consistent with the results of Nakamura et al. (Reference Nakamura, Watanabe and Nagata2023) and Chen & Buxton (Reference Chen and Buxton2024), whose shape does not depend on the large-scale parameters, and only on how dissimilar are the levels of
 $\omega '$
. However the distance between the two enstrophy peaks observed here is roughly half of the the value reported in Chen & Buxton (Reference Chen and Buxton2024) – but is similar to one observed in Nakamura et al. (Reference Nakamura, Watanabe and Nagata2023). Eventually, when we extrapolate this difference ad extremum, we would recover a profile typical of TNTIs, where only one peak exists (on the rotational side).
The behaviour of the strain-rate magnitude in close proximity to the TTIs was further analysed by taking into consideration three-dimensional visualisations of vortices identified with a threshold on the second velocity gradient tensor invariant. These were shown to be visually tangent to the interface, providing a schematic view in close agreement with the previously found enhanced interface-normal strain-rate magnitude (Kankanwadi & Buxton Reference Kankanwadi and Buxton2022). The budget terms of enstrophy and rate-of-strain magnitude further unveiled some of the internal mechanisms that lie beneath these layers. Specifically, the viscous diffusion of
 $\omega _i\omega _i$
was shown to be negligible, similarly to the results of Kankanwadi & Buxton (Reference Kankanwadi and Buxton2022). When normalised by the Kolmogorov microscales extracted from the turbulent core, values of the same order of magnitude as TNTIs were recovered (Zecchetto & da Silva Reference Zecchetto and da Silva2021). On the rate-of-strain magnitude side, the self-amplification is shown to be the dominant production term, with a diminished role for the viscous diffusion term also observed. Additionally, the pressure–strain interaction mechanism is shown to be as significant as the vorticity stretching (that acts as sink of strain), exhibiting a minimum at the interface, which is suggested to counterbalance the rapid growth of the rate-of-strain magnitude. The study of conditional profiles of turbulence intensity, in addition to depicting a remarkably good quantitative agreement for different simulations using the same type of HIT, conveys the idea that the jump of this quantity across the interface is not as steep as that of the small-scale quantities of enstrophy and rate-of-strain magnitude. The mean pressure was shown to be consistent with the conditional turbulence intensity, while its variance presented a peak at the interface, highlighting the importance of this variable to the dynamics of spatially evolving TTIs.
Acknowledgements
The authors would like to acknowledge fruitful discussions with Professor John-Christos Vassilicos.
Funding
The authors acknowledge Fundação para a Ciência e a Tecnologia (FCT) or its financial support via the project LAETA Base Funding (DOI: 10.54499/UIDB/50022/2020). P.D. Alves acknowledges Fundação para a Ciência e a Tecnologia (FCT) for its financial support via SFRH/BD/05716/2024. C.B.S. acknowledges Fundação para a Ciência e a Tecnologia (FCT) for its financial support via projects DOI: 10.54499/2023.15779.PEX, and DOI: 10.54499/2023.14450.CPCA.A3.
Declaration of interests
The authors report no conflict of interest.
Appendix A. Spatially evolving HIT
The simplest case that can be studied with the newly proposed approach (detailed in § 2.1) is the imposition of consecutive slices of a single type of HIT velocity field at the inlet, i.e. as if we were considering only HIT
 $i$
type of planes in figure 1. This was done to understand the dynamics of each individual type of turbulence, as well as to verify that isotropy is obtained (something that is important to ensure, so that no additional anisotropic effects are at play). In this case, instead of using the
 $\overline {(\boldsymbol{\cdot })}^f$
-average presented in § 4, we took into account that the
 $y$
direction is homogeneous (which is not the case in spatially evolving TTIs). In the end, a given field
 $\psi$
has an average that only depends on
 $x/H$
,
 \begin{equation} \overline {\psi }(x_i/H)\equiv \dfrac {1}{N_yN_z N_t}\sum _{j=1}^{N_y}\sum _{k=1}^{N_z}\sum _{m=1}^{N_t}\psi (x_i/H,y_j/H,z_k/H,t_m). \end{equation}
First, one can look at the ratios of the velocity variance, i.e.
 $(\overline {u'^2}/\overline {v'^2})^{1/2}$
,
 $(\overline {u'^2}/\overline {w'^2})^{1/2}$
and
 $(\overline {v'^2}/\overline {w'^2})^{1/2}$
. Ideally, these shall be close to unity for an isotropic flow. Figure 23 depicts these for each of the four spatially evolving HIT simulations.
Spatial evolution of the square root of the velocity variance ratios for (a)
 ${H}_{L\omega u}$
, (b)
 ${H}_{L\unicode{x1D6FA} U}$
, (c)
 ${H}_{l\omega u}$
and (d)
 ${H}_{l\unicode{x1D6FA} U}$
. The interval
 $1\pm 0.1$
is represented by a grey region.

Overall, one can say that isotropy is attained rather quickly, after an initial adjustment to both the inlet condition and discretisation in the
 $x$
direction. In particular,
 ${H}_{L\omega u}$
(figure 23
a) attains ratios of
 $1\pm 0.1$
at
 $x/H\approx 0.6$
, and it remains within this interval for the majority of the streamwise distance, apart from the end (
 $x/H\gtrsim 2.2$
), where
 $\overline {w'^2}$
becomes slightly larger. Here,
 ${H}_{L\unicode{x1D6FA} U}$
(figure 23
b) has a similar behaviour, attaining the
 $10\,\%$
margin at
 $x/H\approx 0.6$
. Nevertheless, close to the outlet, there is a departure from unity.
 ${H}_{l\omega u}$
(figure 23
c) depicts the poorest isotropy, with an isotropic state in between
 $0.5 \lesssim x/H \lesssim 2.4$
. Finally,
 ${H}_{l\unicode{x1D6FA} U}$
(figure 23
d) barely leaves the grey region, ultimately indicating a very consistent isotropic decay.
It is also pertinent to look at the evolution of other turbulence-related quantities, such as the normalised turbulent kinetic energy,
 $k/\max (k)$
, the Taylor-based Reynolds number,
 ${Re}_{\lambda }$
, the resolution,
 $\varDelta x/\eta$
, the longitudinal integral length scale,
 $L_{11}$
, or the non-dimensional dissipation,
 $C_{\varepsilon }$
. Figure 24 shows the evolution of these for all the simulations.
Spatial evolution of (a) the normalised turbulent kinetic energy, (b) its associated exponent,
 $n_k$
, (c) the Taylor-based Reynolds number, (d) the spatial resolution, (e) the longitudinal integral length scale and ( f) the non-dimensional dissipation.

The turbulent kinetic energy (figure 24
a) decays monotonically with streamwise distance. In addition, it follows a power-law decay, especially in the second half of the domain, i.e.
 $2\leqslant x/H \leqslant 4$
. This motivates the analysis of the kinetic energy decay exponent, which, following Krogstad & Davidson (Reference Krogstad and Davidson2010), can be computed by
 \begin{equation} n_k(x/H)=-\dfrac {\ln [ (k/\max (k)(x/H+\varDelta x/H) )/ (k/\max (k)(x/H-\varDelta x/H) ) ]}{\ln [(x/H+\varDelta x/H)/(x/H-\varDelta x/H) ]}. \end{equation}
The absolute value of this exponent is shown in figure 24(b), alongside the theoretical exponents provided by analytical decay theories, i.e.
 $\sigma \equiv 1$
when the decay occurs at constant Reynolds number,
 $\sigma \equiv 2$
for the Saffman spectrum,
 $\sigma \equiv 4$
for the Batchelor spectrum and
 $\sigma \equiv +\infty$
when the decay occurs at constant integral length scale (Sagaut & Cambon Reference Sagaut and Cambon2008), where
 $\sigma$
is the exponent of the power-law infrared region of the energy spectrum. All four types of HIT (apart from
 ${H}_{L\omega u}$
) show an exponent
 $n_k$
within the analytical theory from
 $x/H \gtrsim 1.8$
. As for
 ${H}_{L\omega u}$
,
 $n_k$
is still rising at the end of the domain, and perhaps a larger
 $x/H$
would be required to assess its decay. In the case of the present work, the mere knowledge that all simulations follow classical laws is suficient to verify the approach. The streamwise evolution of
 ${Re}_{\lambda }$
is shown in figure 24(c). The quantitative agreement of
 ${Re}_{\lambda }$
for
 $x/H=0$
and the inlet conditions provided by Temp-DNS (dashed reference lines) is remarkable. Afterwards, a small increase is observable, due to the adjustments to the initial condition; however, one could argue that it is negligible, given that the inlet value is reattained shortly thereafter. Consequently,
 ${Re}_{\lambda }$
decays, following the expected order of magnitude of the inlet values. Regarding the resolution (figure 24
d), on the one hand,
 ${H}_{L\omega u}$
and
 ${H}_{l\omega u}$
are finely resolved (
 $\varDelta x/\eta \lesssim 1.3$
). On the other hand, the resolutions of
 ${H}_{L\unicode{x1D6FA} U}$
and
 ${H}_{l\unicode{x1D6FA} U}$
are slightly greater, but still allow for a proper description of the small scales, since
 $\varDelta x/\eta \lesssim 2$
, which is reported to be enough (Pope Reference Pope2000). All these resolutions are in agreement with the results of Temp-DNS:
 ${H}_{L\unicode{x1D6FA} U}$
and
 ${H}_{l\unicode{x1D6FA} U}$
with
 ${k}_{\textit{max}}\eta \sim 1$
and
 ${H}_{L\omega u}$
and
 ${H}_{l\omega u}$
with
 ${k}_{\textit{max}}\eta \sim 1.5$
. The development of the integral length scale is depicted in figure 24(e). Namely, for convenience, the velocity signal
 $u_i$
as a function of the
 $z$
coordinate was used to compute
 $L_{31}$
,
 \begin{equation} L_{31}=\dfrac {\pi }{2}\dfrac {E_{33}({k}\to 0)}{\overline {w'^2}}, \end{equation}
where
 $E_{33}$
is the 1-dimensional energy spectrum using the
 $z$
component of the velocity, and
 ${k}$
is the wavenumber magnitude. Once again, the agreement with the values computed with Temp-DNS is exceptional. Moreover, all grow with
 $x/H$
, completely in accordance with the phenomenology of freely-decaying turbulence (Sagaut & Cambon Reference Sagaut and Cambon2008). Finally, one can look at the non-dimensional dissipation,
 $C_{\varepsilon }$
, as shown in figure 24( f). Essentially, all simulations present a similar inlet value of
 $C_{\varepsilon }\approx 0.45$
, which is in agreement with the values typically observed in forced HIT (Pope Reference Pope2000), and used for the analytical estimation of the maximum attainable
 ${Re}_{\lambda }$
in § 2.1. As the turbulence decays, there is a growth of
 $C_{\varepsilon }$
until a value close to unity is obtained. To assess the possible existence of non-equilibrium dissipation dynamics, one can evaluate the relation between
 ${Re}_{\lambda }$
and
 $C_{\varepsilon }$
, as reported in figure 25.
Relation between non-dimensional dissipation,
 $C_{\varepsilon }$
, and Taylor-based Reynolds number,
 ${Re}_{\lambda }$
for
 ${H}_{L\omega u}$
,
 ${H}_{L\unicode{x1D6FA} U}$
,
 ${H}_{l\omega u}$
and
 ${H}_{l\unicode{x1D6FA} U}$
. The dashed black line refers to the relation of
 $C_{\varepsilon }\sim {Re}_{\lambda }^{-1}$
.

Initially, in a small region close to the inlet, we observe a relation of
 $C_{\varepsilon }\sim {Re}_{\lambda }^{-m}$
, where
 $m\sim 1$
, a situation that has been reported in many turbulence decay applications (Vassilicos Reference Vassilicos2015). However, as the streamwise distance increases,
 $m$
ultimately diminishes until we reach a state where
 $C_{\varepsilon }$
barely changes, in spite of the decreasing
 ${Re}_{\lambda }$
(
 $m\sim 0$
). Specifically,
 ${H}_{L\unicode{x1D6FA} U}$
showcases a more abrupt change from the non-equilibrium regime to the
 $C_{\varepsilon }=\textrm {const.}$
behaviour.