I. INTRODUCTION
Due to outstanding mechanical and corrosion properties, stainless steel exhibits a tremendous advantage in many industries and a duplex structure (austenite and ferrite phases) promotes the stability and weldability of these materials further by lowering the possibility of hot cracking, Reference Li, Wang, Zhang, Li, Zhang, Xue and Wang1–Reference Cui and Lundin3 while defects, microsegregation, and residual stress are easily to be generated during welding process, Reference Badji, Bacroix and Bouabdallah4 for the stainless steel cladding material, post weld heat treatment (PWHT) in range of 600–650 °C is widely chosen to mitigate these negative effects and the good welding properties are obtained. Reference Li, Charles and Congleton5,Reference Li and Congleton6
It is taken for granted that the content of Cr element is the key factor to the passive film and the corrosion resistance basically. Reference Takeuchi, Takuyo, Tomoki, Koji and Koji7 For stainless steel, a higher Cr content ensures the better corrosion resistance of materials while grain size, Reference Abbasi Aghuy, Zakeri, Moayed and Mazinani8 alloying elements, Reference Ha, Jang and Lee9 and second phases Reference Yang, Yan, Wang and Li10–Reference Otake, Muto, Chiba, Sugawara and Hara14 such as inclusions, carbides, and σ-phase damage the stabilization of passive film, which results in the degradation of corrosion properties. Some previous works indicate that three types of the inclusions (MnS, multielement oxides, and mixtures of sulfides and oxides) have been studied and each type of the inclusions shows the different response to pitting nucleation and growth, Reference Pardo, Merino, Coy, Viejo, Arrabal and Matykina12,Reference Ke and Alkire13 while the type of the inclusion and its effects on corrosion properties have not been fully understood for the cladding material.
It is widely reported that precipitates especially Cr-rich carbides and σ-phase caused by heat treatment induce a Cr-depleted zone around them, lowering the pitting potential Reference Lo and Tsai15–Reference Guan, Xu, Xu and Wang18 and increasing the degree of sensitization, Reference Bai, Lu, Li and Li19,Reference Moura, Lima, Pardal and Tavares20 which is influenced by heat treatment temperature and time. Reference Zhu, Deng, Wang, Yang, Ding and Wang16,Reference Yang, Wang, Tan, Hong, Jiang, Jiang and Lin17,Reference Bai, Lu, Li and Li19 For 308L stainless steel, its pitting is sensitive to the concentration of Cl−, Reference Moura, Lima, Pardal and Tavares20 and the intergranular corrosion behavior is successfully evaluated by electrochemical potentiokinetic reactivation (EPR) method. Reference Liu, Wen, Zhang, Huo and Gong21–Reference Fang, Zhang, Wu, Sun and Li22 However, up to now less attention has been focused on the local corrosion behavior of 308L stainless steel weld overlay cladding especially after PWHT and the relevant factors are not clear. More detailed investigation is needed.
Base on the above conclusions, this study attempts to investigate the microstructural evolution of 308L stainless steel weld overlay cladding after PWHT by scanning electron microscope (SEM) and transmission electron microscope (TEM), the variations of pitting and intergranular corrosion properties are evaluated by potentiodynamic polarization and double loop electrochemical potentiokinetic reactivation (DL-EPR) method, respectively.
II. MATERIALS AND METHODS
A. Materials and welding
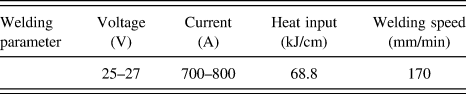
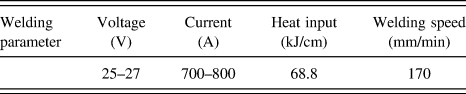
EQ308L stainless steel strip was used as cladding metal on A508 base metal. Three layers of stainless steel strips with the whole thickness of 11 mm were deposited by submerged arc strip welding (SAW) to obtain the cladding metal; the welding parameters of SAW are listed in Table I. All samples for the present study were cut from the surface of the top most cladding layer. Chemical compositions of the SAW stainless steel strip and A508 base metal are listed in Table II.
Welding parameters of SAW process.
Chemical compositions of base and weld metals (wt%).

After welding, the cladding plate was divided into three parts: one part was in as-welded condition, and other two parts underwent PWHT at 615 °C for 16 h and 48 h, respectively.
B. Microstructure
For microstructural analysis, the samples were mechanically ground to 5000# grit on SiC papers and then polished using a 2.5 mm diamond paste for inclusions observation firstly by scanning electron microscope (SEM; JEOL Ltd., Tokyo, Japan) and backscatter electron microscope (BSE). Electrochemical etching was carried out at 2 V for 5 s in 10% NaOH to observe the microstructural variation after PWHT. Precipitates in the samples after PWHT were identified by TEM observation performed by a FEI-F20 transmission electron microscopy operated at 200 kV (TEM; FEI Technologies Inc., Hillsboro, Oregon).
C. Potentiodynamic polarization test
Pitting corrosion resistance of the samples was investigated using potentiodynamic polarization test in 3.5 wt% NaCl solution at room temperature. The test was conducted by a potentiostat (CHI 6670) equipped with a conventional three-electrode system including a working electrode (sample), a saturated calomel reference electrode (SCE), and a Pt-plate counter electrode. The pure nitrogen gas (N2) was purged into the test solution for 30 min before the electrochemical tests and continued to purge into the solution during the test. The samples with a size of 10 × 10 × 2 mm for potentiodynamic polarization tests were embedded in epoxy resin except for an exposed area of 1 cm2 used as working electrode surface. These samples were then mechanically ground to 2000# grit on SiC papers and then polished using a 2.5 mm diamond paste. Before the test, the solution was stabilized at open circuit potential (OCP) for 30 min and potentiodynamic scan started from −200 mV versus OCP with a scan rate of 0.3333 mV/s until the current density increased to 1 mA/cm2. Pitting potential (E pit) was defined as the potential at which current density began to rapidly increase. Reference Cardoso and Vieira11,Reference Pardo, Merino, Coy, Viejo, Arrabal and Matykina12 Five repeated tests for each PWHT were carried out. After the test, the pitting morphology of the samples was observed by BSE and then the corresponding three-dimensional topography of the pitting was investigated using confocal laser scanning microscopy (OLYMPUS LEXT OLS4000, Olympus Corporation, Tokyo, Japan ).
D. DL-EPR test
The DL-EPR tests at room temperature were performed by a potentiostat (CHI 6670) with a conventional three-electrode system including a working electrode (sample), a SCE, and a Pt-plate counter electrode. The 5 × 5 × 2 mm samples embedded in epoxy resin exhibits 0.25 cm2 working electrode surface areas, and are mechanically ground to 2000# grit gradually, followed by polishing using a 2.5 mm diamond paste and cleaning by distilled water. The solution for DL-EPR tests was 0.5 M H2SO4 + 0.01 M KSCN. Polarization scan started after stabilizing at OCP for 30 min, the potential was scanned from −0.5 V SCE to 0.3 V SCE in the anodic direction and then reversed to −0.5 V SCE in the cathodic direction with a scan rate of 1.67 mV/s, three repeated tests for each PWHT were carried out to confirm the reproducibility. The degree of Cr depletion was evaluated by the ratio of I r/I a, where I r is the peak current of the cathodic scan and I a is the peak current of the anodic scan, and the surface morphology of each sample after the test was observed by SEM.
III. RESULTS
A. Microstructure
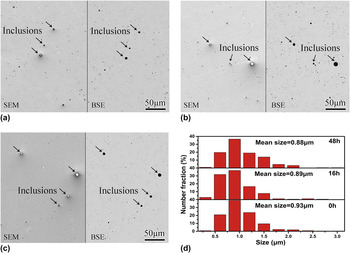
Figures 1(a)–1(c) show the secondary electron and backscattered electron micrographs of the samples after different PWHTs. As shown in Figs. 1(a)–1(c), some inclusions (almost-round particles) are distributed randomly in all the samples. The size distribution of these inclusions is summarized in Fig. 1(d). It is found that the average size of the inclusions is not more than 1 μm, and PWHT at 615 °C has no obvious effect on the size of inclusions in the cladding material.
SEM and BSE micrographs of the samples (a) as welded, after PWHT for (b) 16 h and (c) 48 h, (d) the corresponding size distribution of inclusions in the samples.

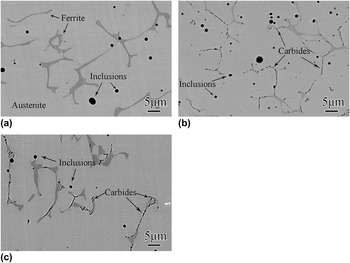
Figure 2 shows the backscattered SEM micrographs of the samples after different PWHTs, the corresponding magnified images are inserted. It is found in Fig. 2 that all the samples contain darker δ-ferrite phase and lighter austenite phase with some inclusions in the matrix. No precipitate is observed in the ferrite/austenite phase interface of the sample as welded, as shown in Fig. 2(a), while some carbides are found at the phase interface in the samples after PWHT for 16 h and 48 h, as shown in Figs. 2(b) and 2(c), respectively, the corresponding magnified images of Figs. 2(b) and 2(c) indicate that these tiny carbides mainly distribute along the interface of ferrite/austenite phase. In addition, as PWHT time increased from 16 to 48 h, more carbides form along the interface of δ-ferrite/austenite phase. This result is later confirmed by TEM observation, as shown in Figs. 3 and 4.
BSE micrographs of the samples (a) as welded, after PWHT for (b) 16 h and (c) 48 h.

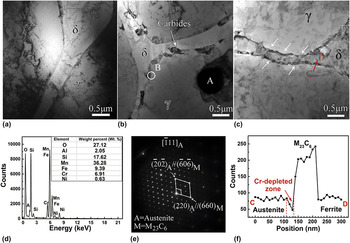
Bright-field TEM images of the samples (a) as welded, after PWHT for (b) 16 h and (c) 48 h, (d) EDS spectrum of the inclusion A, (e) SEAD pattern of the carbide B in (b), (f) line profile for Cr along line CD in (c).

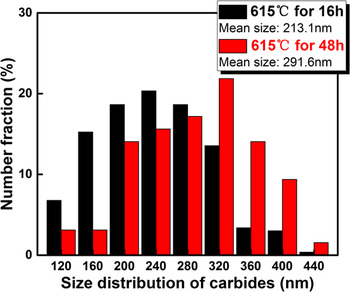
Size distribution of carbides in samples after PWHT for 16 and 48 h.

Figures 3(a)–3(c) show the bright-field TEM micrographs of the samples with different PWHTs, respectively. It is found from Fig. 3(a) that no precipitate is found along the interface of δ-ferrite/austenite phase, and the interface is sharp. However, carbides distribute randomly along the δ-ferrite/austenite phase interface, as shown in Figs. 3(b) and 3(c). Obviously, more rod-like carbides are found in Fig. 3(c) than that in Fig. 3(b), which indicates that more precipitation at the interface of δ-ferrite/austenite phase occurs with the increase of PWHT time. Figure 3(d) shows the energy spectrum result of the inclusion marked as “A” in Fig. 3(b). It is found that the inclusion is identified as (Mn, Si, and Al) oxides, which belong to the multielement oxides. Selected area diffraction (SEAD) pattern obtained from B in Fig. 3(b) including the carbide and its surrounding austenite matrix indicates that the precipitate M23C6 exhibits a fcc structure, and shows an orientation relationship with the austenite matrix of 〈001〉M//〈001〉A, as shown in Fig. 3(e). Figure 3(f) displays the linear profile of Cr at δ-ferrite/austenite phase interface. It is found that the precipitate exhibits a higher Cr content than δ-ferrite and austenite phase; moreover, the unsymmetrical Cr-depleted zone with a width of about 30 nm is found in the vicinity of M23C6, which is in accordance with the previous works. Reference Guan, Xu, Xu and Wang18
Figure 4 shows size distribution of the carbides distributed along δ-ferrite/austenite phase interface in samples after PWHT for 16 and 48 h. As shown in Fig. 4, the size of carbides at the phase interface in both samples ranges from 80 to 400 nm. On the other hand, heat treatment time plays an important role in the size of carbides. It is worthy of noticing that the mean size of carbides of the sample after PWHT for 48 h (291.6 nm) is much larger than that of the sample after PWHT for 16 h (213.1 nm), indicating that PWHT facilitates the carbides precipitation and growth.
B. Pitting corrosion results
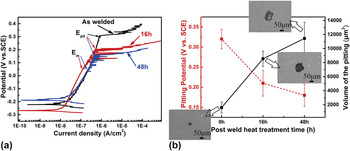
Figure 5(a) displays potentiodynamic polarization curves in 3.5 wt% NaCl solution. As shown in Fig. 5(a), the E pit, the pitting corrosion potential, decreases from 0.32 to 0.18 V with increase of PWHT time, which indicates that PWHT has a negative effect on the pitting resistance of the cladding materials. In addition, oscillations of the current response are observed in the passivity region closed to the pitting potential in the samples after PWHT, this unstable response of electrochemical test existing in the samples indicates that metastable pitting occur during the test; Reference Tang, Zuo, Wang, Zhao, Niu and Lin23 it is found that the metastable pitting potential (E m) existed in the samples after PWHT, and the E m decreases with increase of PWHT time from 16 to 48 h, which indicates that the formation of carbides has effect on metastable pitting nucleation. The E pit, pitting potential, and the volume of the corresponding pits of the samples with different PWHTs are shown in Fig. 5(b). As displayed in Fig. 5(b), E pit decreases while the volume of the pits increases with increase of PWHT time from 16 to 48 h, which indicates that PWHT increases the pitting corrosion susceptibility of the cladding material.
(a) Potentiodynamic polarization curves, and (b) pitting potential and the volume of the corresponding pit in the samples with different PWHTs in 3.5 wt% NaCl solution, the corresponding typical morphologies of pits are inserted.

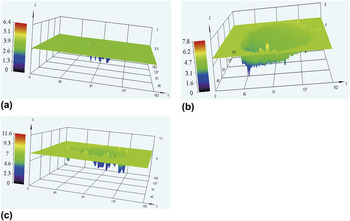
Figures. 6(a)–6(c) show three-dimensional topographies of the pitting formed on the samples after different PWHTs. It is found that pits with irregular shapes form on all the samples. However, deeper pits are found in the samples after PWHT than that in the samples as welded, which indicates a higher pitting corrosion rate of the samples after PWHT. In addition, it is found that the depth of pit increases with increase of PWHT time. In addition, the maximum depth of pit in the sample after PWHT for 0 h is about 2 μm, while that for 16 and 48 h are 3 and 6 μm, respectively, an increase of width and depth of the pit on the sample surface after PWHT indicates that existence of carbides has a negative effect on the pitting corrosion of the cladding material.
Three-dimensional topographies of the samples (a) as welded, after PWHT for (b) 16 h and (c) 48 h.

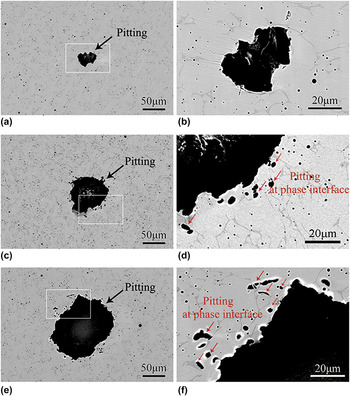
Figures 7(a), 7(c), and 7(e) show the BSE micrographs of stable pits formed on the surface of the samples after different PWHTs, the corresponding magnified micrographs of the white frame indicated in Fig. 7(a), 7(c), and 7(e) are shown in Figs. 7(b), 7(d), and 7(f), respectively. As shown in Fig. 7(a), the irregular stable pit forms in the as-welded materials, and its size is about 40 μm as shown in Fig. 7(b). By comparison, the larger stable pits with a size of 60–100 μm are observed in Figs. 7(c) and 7(e); moreover, these stable pits possess the perforated lacy shapes, revealing that some small pits form around them, as shown in Figs. 7(c) and 7(e), which are primarily related to the austenite/ferrite phase interface, as shown in Figs. 7(d) and 7(f). The above phenomenon indicates high pitting corrosion susceptibility of phase interface after PWHT.
BSE micrographs of typical stable pits formed on the surface of the samples (a) as welded, after PWHT for (c) 16 h and (e) 48 h, the corresponding magnified micrographs of the white frame indicated in (a), (c) and (e) are shown in (b), (d) and (f), respectively.

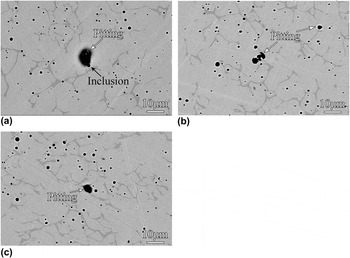
To observe the pitting nucleation process in the cladding material during the polarization, some tests were suspended when the applied potential increases close to the pitting potential, and then surface of these samples were observed by BSE. Figure 8 shows BSE micrographs of the typical pits formed on the sample surface with different PWHTs before reaching the pitting potential. As shown in Fig. 8(a), the pit located around the (Mn, Si, and Al) oxides is found in the sample as welded, revealing that the multielement oxides act as the active sites of the pitting in the sample as welded. However, it is found that the irregular pits occur at the δ-ferrite/austenite phase interface in the samples after PWHT for 16 and 48 h, which indicates that the δ-ferrite/austenite phase interface is the most susceptible place for the pitting corrosion in the samples after PWHT for 16 and 48 h.
BSE micrographs of the typical pits on the surfaces of the samples (a) as welded, after PWHT for (b) 16 h and (c) 48 h when the applied potential reaches close to the pitting potential.

C. Intergranular corrosion results
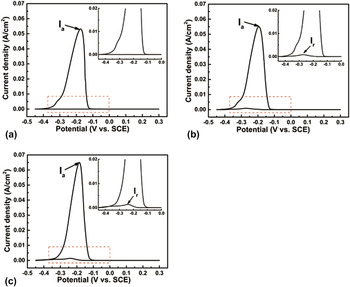
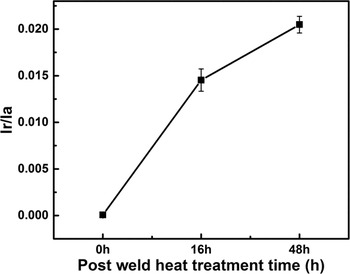
Figure 9 shows the DL-EPR curves of the samples with different PWHTs, the corresponding high magnified images of red frame are inserted. As shown in Fig. 9(a), the activation current peak (I a) is 0.05316 A/cm2, while almost no reactivation peak (I r) is observed for the sample as welded. By comparison, higher activation peak (I a) is observed for the samples after PWHT and the obvious reactivation peak (I r) during negative scan indicates that PWHT promotes the intergranular corrosion susceptibility of the cladding material. A higher sensitive to intergranular corrosion takes place with increase of PWHT time from 16 to 48 h. The corresponding I r/I a values of the samples with different PWHTs are shown in Fig. 10. Apparently, the values of I r/I a gradually increase with increase of PWHT time, indicating that PWHT has a great influence on the intergranular corrosion behavior of the cladding material.
DL-EPR curves of the samples (a) as welded, after PWHT for (b) 16 h and (c) 48 h, the corresponding magnified image of the red frame is inserted.

I r/I a values of the samples with different PWHTs.

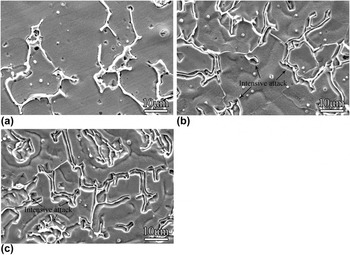
Figure 11 shows the SEM micrographs of the samples with different PWHTs after DL-EPR test. As shown in Fig. 11(a), the un-corroded and sharp phase boundary is clearly observed in the sample as welded, while boarder and deep groove forms along the phase boundary in the samples after PWHT for 16 and 48 h, as shown in Figs. 11(b) and 11(c), confirming high intergranular corrosion susceptibility in the samples after PWHT, as shown in Figs. 9 and 10.
Typical SEM micrographs of the samples (a) as welded, after PWHT for (b) 16 h and (c) 48 h after DL-EPR test.

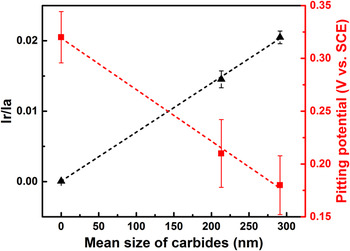
Figure 12 shows the variation of pitting potential and I r/I a value with mean size of carbides. It is found that both pitting potential and I r/I a value have a linear relationship with change of carbides size. The pitting potential and I r/I a value can be fitted by the following linear dependence:
 $${Y_{{E_{{\rm{pit}}}}}} = 0.319 + 4.88 \times {10^{ - 4}}X$$
and
 $${Y_{{{{I_{\rm{r}}}} \mathord{\left/ {\vphantom {{{I_{\rm{r}}}} {{I_{\rm{a}}}}}} \right. \kern-\nulldelimiterspace} {{I_{\rm{a}}}}}}} = 6.67 \times {10^{ - 4}} + 6.96 \times {10^{ - 5}}X\quad ,$$
wherein the corresponding regression coefficients of the fits are
 $R_{{E_{{\rm{pit}}}}}^2 = 0.998$
and
 $R_{{{I_{\rm{r}} } \mathord{\left/ {\vphantom {{I_{\rm{r}} } {I_{\rm{a}} }}} \right. \kern-\nulldelimiterspace} {I_{\rm{a}} }}}^2 = 0.999$
, respectively, indicating that size distribution of carbides corresponded to Cr-depleted level dominates the loss of pitting potential and intergranular corrosion resistance, and the inclusions in the cladding material show no direct effect on that.
Variation of pitting potential and I r/I a value with mean size of carbides.

IV. DISCUSSION
It was accepted that, during the welding process, the weld pool region is heated up to more than 2000 °C in the air and the deoxidizing elements, such as Mn, Si, and Al et al., would react with the absorbed oxygen in liquid welding pool and formed the nonmetallic complex inclusions to lowered the oxygen concentration in the weld metal. Reference Di, Ji, Cheng and Cao24 These complex inclusions could survive and stabilize in a certain size at room temperature and were believed to affect the corrosion properties. Reference Cardoso and Vieira11,Reference Ke and Alkire13,Reference Ha, Jang and Lee25 As displayed in Figs. 1 and 3, the almost-round multielement (Mn, Si, and Al) oxide inclusions dispersed randomly in the cladding material and their average size was less than 1 μm. It was obvious that PWHT at 615 °C in present research had no obvious effect on the size of these inclusions, but produced M23C6 carbides along the δ/γ interface, as shown in Figs. 2 and 3. It is usual that the carbon, the austenite-stabilization element, can easily diffuse to the sites with high concentration of strong carbide formation elements Cr, Nb, and Ti et al. Reference Yang, Wang, Tan, Hong, Jiang, Jiang and Lin17 In our research, it was believed that the carbon diffused to the δ/γ interface and reacted with surrounding Cr element to form the rod-like precipitates (Fig. 4) during PWHT process; on the other hand, it was possible that high concentration of Cr element in ferrite phase compensated for the depletion of Cr element caused by precipitation, Reference Sheng26 whereas Cr-depleted zone was prone to form in the austenite phase after PWHT, as shown in Fig. 4(f). In addition, as PWHT time increased from 16 to 48 h, it was believed that increase of size of carbides along the phase interface aggravated the extent of Cr depletion and showed a dramatic effect on the corrosion behavior of the cladding material by further broadening the extent of Cr depletion in the austenite phase.
As reported by many previous works, inclusions were widely considered to be precursor sites for pitting attack, Reference Cardoso and Vieira11,Reference Nakhaie and Moayed27 the reason of which was instability and active dissolution of the inclusions during anodic polarization, Reference Nakhaie and Moayed27 the latter was reported as the initial step before the formation of a stable pitting, Reference Cardoso and Vieira11 resulting in the pitting nucleation at the inclusions/matrix interface, as shown in Fig. 8(a). It is worthy of noticing that acted as the pitting sites of the sample as welded during the anodic polarization [Fig. 8(a)], the reason was that these low electrical conductivity inclusions began to dissolve after exposed to the Cl− solution, Reference Tang, Zuo, Wang, Zhao, Niu and Lin23,Reference Ha, Jang and Lee25,Reference Nakhaie and Moayed27 and the hydration of Mn, Si and Al elements seemed to have no effect on the repassivation process of bare metal, Reference Nakhaie and Moayed27 which induced lower possibility of metastable pitting nucleation in the sample as welded [Fig. 5(a)], while the dissolution of inclusions left the cavities filled with electrolyte, which induced a high concentration and aggregation of chloride ions, and it was believed that these concentrated chloride ions could destroy the passive film easily until the concentration reached a critical value, Reference Liu, Wen, Zhang, Huo and Gong21 resulting in the breakdown of protective film and pitting nucleation there (Fig. 8).
While for the sample after PWHT, existence of Cr-depleted zone in the austenite phase indicated that this weak area was attacked by Cl-ions in NaCl solution easily during passivation, Reference Cardoso and Vieira11 and a series of metastable pits was likely to occur at these weakness sites, thus the metastable pitting potential (E m) appeared in the samples after PWHT [Fig. 5(a)], on the other hand, further activation dissolution of less noble metal caused by higher potential promoted propagation of the metastable pitting, which enhanced the possibility of transformation to stable pitting, Reference Lo and Tsai15 revealing lower pitting potential of the sample after PWHT than that of the sample as welded (Fig. 5), as a result, larger and deeper pitting located at the δ/γ phase interface was found in the samples after PWHT (Figs. 6 and 7). It was worthy of noticing that as the PWHT time increased to 48 h, larger size of carbides corresponded to higher Cr depletion level facilitated active dissolution of metal and more metastable pitting might be formed around these carbides and Cr-depleted zone, resulting in the decrease in E pit shown in Fig. 5(a), and the formation of larger and deeper pitting was clearly observed in the sample after PWHT for 48 h (Figs. 5 and 6), which was also confirmed by the linear relationship between pitting potential and mean size of carbides (Fig. 12). As a result, the Cr-depleted zone caused by PWHT determined the reduction of E pit and were responsible for the degradation of pitting corrosion resistance of the cladding material.
As stated before, Cr-depleted zone played an important role in pitting corrosion, which was also confirmed as a key factor for intergranular corrosion as reported by other articles, Reference Guan, Xu, Xu and Wang18,Reference Bai, Lu, Li and Li19 the ratio of reactivation and activation peak current during EPR test was reported as the effective parameter for evaluating the degree of sensitivity. Reference Tang, Zuo, Wang, Zhao, Niu and Lin23 In the present research, activation peak increased with increase of the PWHT time, which was attributed to active dissolution of the metal itself, Reference Yang, Yan, Wang and Li10 suggesting that PWHT contributed to more corrosion of the cladding material. However, no obvious reactivation peak (Fig. 8), corresponding to almost no sensitivity (Fig. 10), indicated that the sample as welded exhibited a high intergranular corrosion resistance. By comparison, obvious reactivation peak and high I r/I a value of the sample after PWHT revealed that carbides and Cr-depleted zone promoted the degree of sensitization and the corroded δ/γ phase interface (Fig. 11) also confirmed high intergranular corrosion susceptibility of the samples after PWHT. Inclusions appeared no effect on intergranular corrosion resistance and Cr depletion during PWHT was the key to the loss of intergranular corrosion resistance.
V. CONCLUSIONS
Microstructure, pitting and intergranular corrosion behaviors of stainless steel weld overlay cladding with different PWHTs were investigated. The main results can be obtained as follows:
-
(1) Inclusions, multiple element (Mn, Si, and Al) oxides with a size of less than 1 μm distributed randomly in the cladding material. PWHT showed no obvious effect on size of inclusions, but contributed to carbides precipitation along the δ/γ phase interface and Cr-depleted zone in the austenite phase.
-
(2) Inclusions acted as the pitting sites in the sample as welded. PWHT reduced the pitting potential and contributed to the formation of larger and deeper pits, which nucleated around the δ/γ phase interface. As PWHT time increased, the increase of carbide size enlarged the Cr depletion level, which resulted in decrease of E pit and reduction of pitting corrosion resistance.
-
(3) Existence of carbides and Cr-depleted zone caused by PWHT lowered the I r/I a value, and contributed to heavier attack of the δ/γ phase interface and dominated the loss of intergranular corrosion resistance. The increase of PWHT time deteriorated the loss of intergranular corrosion resistance further and inclusions showed no effect on the intergranular corrosion of the cladding material.
ACKNOWLEDGMENTS
The authors acknowledge the financial support for the present work from National Energy Application Technology Research and Engineering Demonstration Project (NY20111201-1).