


Introduction
Permanently ice-covered regions of the world preserve a unique and datable record of the past composition of the Earth’s atmosphere due to incorporation of trace quantities of water-soluble and insoluble substances in snow/ice during both precipitating and non-precipitating periods (Reference Clausen, Langway, Oeschger and LangwayClausen and Langway, 1989; Reference Peel, Oeschger and LangwayPeel, 1989). Thus, one may reveal the history of the atmospheric environment at a specific site through chemical analysis of snow/ice samples collected continuously in a glacier or ice sheet. In the Antarctic ice sheet, such work has been carried out at many places for various time-scales. Due to the complexity of climate and vastness of the ice sheet, however, this type of work is still necessary at new sites and also at previously investigated places, particularly for short-time-scale studies with high resolution, to understand the modern atmospheric and snow-chemistry compositions as well as regional differences. Glaciochemical and other glaciological studies are very sparse in the inland regions of the Antarctic ice sheet, especially in the central part of the East Antarctic plateau, so new work is much needed.
In recent years, the Chinese National Antarctic Research Expedition (CHINARE) has initiated an inland glaciological
investigation program along a traverse route from Zhong- ′′′′
shan station on the coast (69˚22' S, 76˚23' E) to Dome A
(about 81.5˚ S, 77˚ E; 4200ma.s.l.; 1400 km from Zhongshan). During these expeditions, the traverse route has been extended southwards to 1100 km inland in the central area of the East Antarctic plateau (Fig. 1), and firn/ice cores with a depth range of 50 –100m were drilled at several sites. Additionally, snow pits with 2–3.3m depths were sampled at some sites. To date, studies of the cores and snow pits from the coast to 500 km inland have shown the regime of climate variations over the past 250 years in Princess Elizabeth Land, and regional differences in climate between the west and east sides of Lambert Glacier, reported elsewhere (Li and others, 1999; Qin and others, 2000; Xiao and others, 2001; Zhang and others, 2001, Reference Zhang2002; Ren and others, 2002). Dating analysis for the cores drilled 800 and about 1100 km inland is not finished yet. In this paper, we present preliminary results of three snow-pit sites, with emphasis on the ionic concentrations.
Sampling and Experimental Analysis
Figure 1 shows the Zhongshan station–Dome A investigation route and the location of the sampling sites. The longest
Map showing the Zhongshan–Dome A traverse route and location of sampling sites.
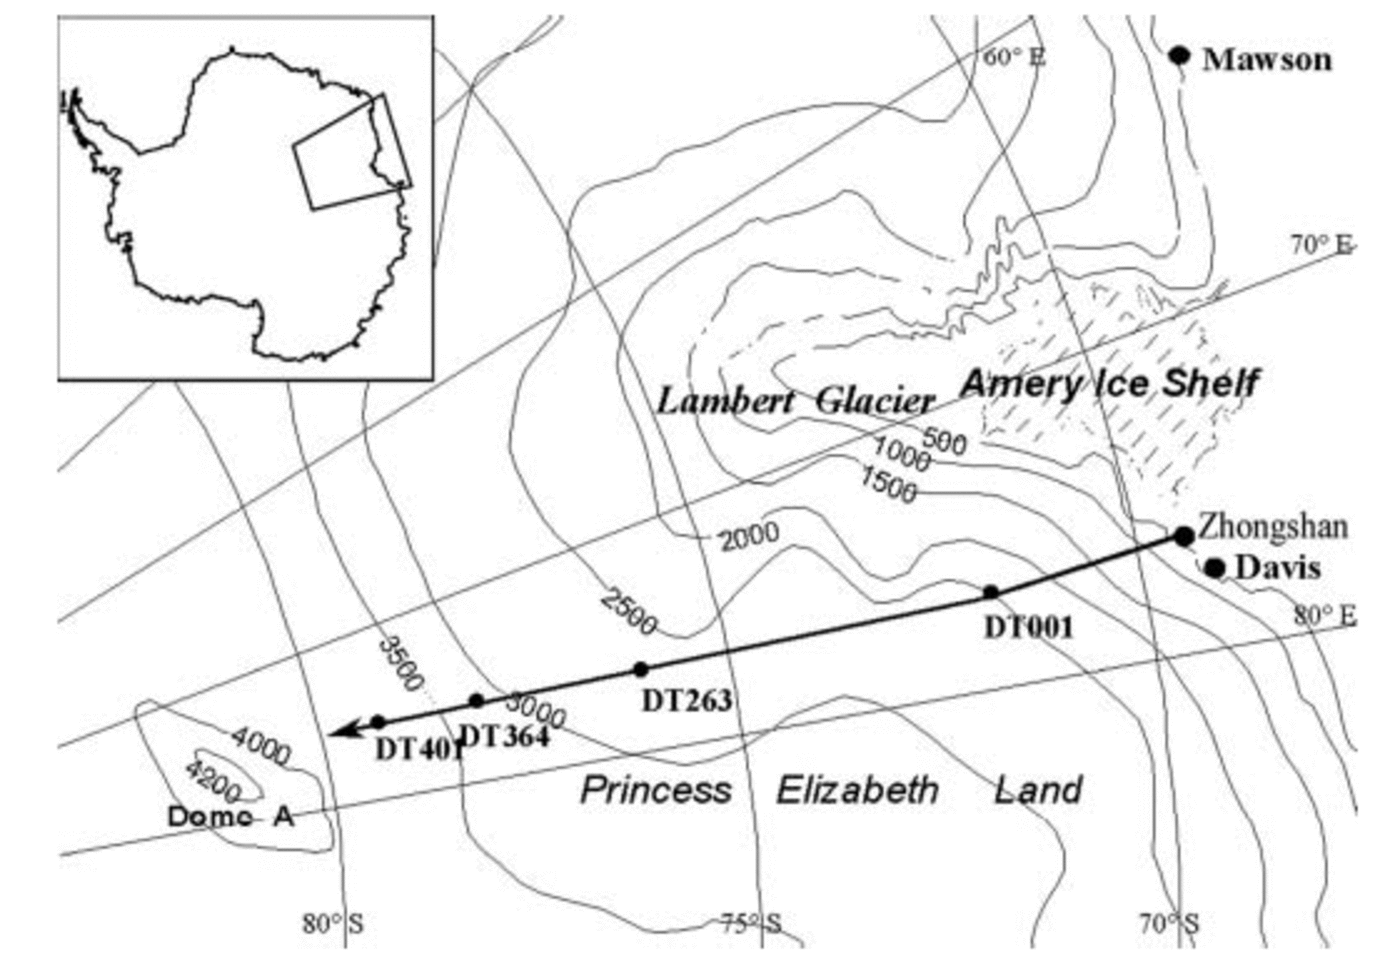
traverse from the coast, from Zhongshan station to DT401 ′′′′
(79˚00' S, 77˚00' E; 3760ma.s.l.; 1097 km from Zhongshan)
was carried out in the austral summer from December 1998 to February 1999. During this traverse, snow pits were dug to
depths of 3.3, 2.1 and 2.4m at sites DT401, DT364
(78˚20' S, 77˚00' E; 3380ma.s.l.; 1022 km from Zhongshan)
and DT263 (76˚32' S, 77˚01'E; 2850ma.s.l.; 820 km from
Zhongshan), respectively. At each pit, snow was sampled continuously from the bottom to the surface by pushing a 120mL pre-cleaned plastic bottle into the leeward wall of the pit, each sample covering a depth interval of 3 cm. At DT401, DT364 and DT263 sites, respectively, 110, 70 and 80 samples were obtained. Visible stratigraphy was described for the sampled wall of each pit. In addition, four aerosol samples were collected at DT401, and two samples at DT263. The aerosol study results were partially reported by Sun (2002) and will be discussed further elsewhere.
Snow samples were kept frozen during transport and stored at about –15˚C prior to laboratory analysis. Analyses were carried out for anions (Cl–, NO3 –, SO4 2–), cations (Na+, NH4 –, K+, Mg2+, Ca2+) and stable isotopes (δ18O). Ion concentrations were measured using a Dionex Model DX-600 ion chromatograph for cations and a DX-300 for anions, with a detection limit of 1 ×10⁻⁹g g–1. Five blank samples were measured and the average values for all blanks were <0.1 μeq L–1, so errors are <5%. δ18O measurements were made using a MAT-252 gas stable-isotope ratio mass spectrometer, with a precision of ±0.5‰. All the measurements were conducted at the Key Laboratory of Ice Core and Cold Regions Environment, Cold and Arid Regions Environmental Research Institute (formerly Lanzhou Institute of Glaciology and Geocryology), Chinese Academy of Sciences.
Dating
Dating is critical in stratigraphic studies of snow and ice. In Antarctica, various dating techniques have been used to establish the depth–age relationship in ice cores. Among them, seasonal variations of physical and chemical parameters and reference horizons are the most important for shallow cores and snow pits. Due to a very low snow-accumulation rate in our study area, δ18O profiles do not provide definite information on seasonal layers, although some variations can be seen (Fig. 2). In our snow pits the average annual layer is estimated to vary from 10 to 20 cm in snow depth, so the radioactive reference horizons produced by thermonuclear tests in the 1950s and early 1960s cannot be detected within a depth of 3.3 m.
Visible stratigraphic profiles help in identifying annual layers in inland Antarctica in spite of much uncertainty in the interpretation of the various stratigraphic features observed (Reference Shoji, Langway, Oeschger and LangwayShoji and Langway, 1989). From observations in more than ten snow pits in the Lambert Glacier basin, Ren and others (1995) concluded that solar radiation crusts are summer layer indicators. On the other hand, studies of snow pits and firn cores within the first 500 km along the Zhongshan–Dome A traverse route show that seasonal variations of some ions (e.g. Na+, Cl– and NO3 –) are well preserved from the surface down to 50m depth (Li and others, 1999; Reference ZhangZhang and others, 2002).
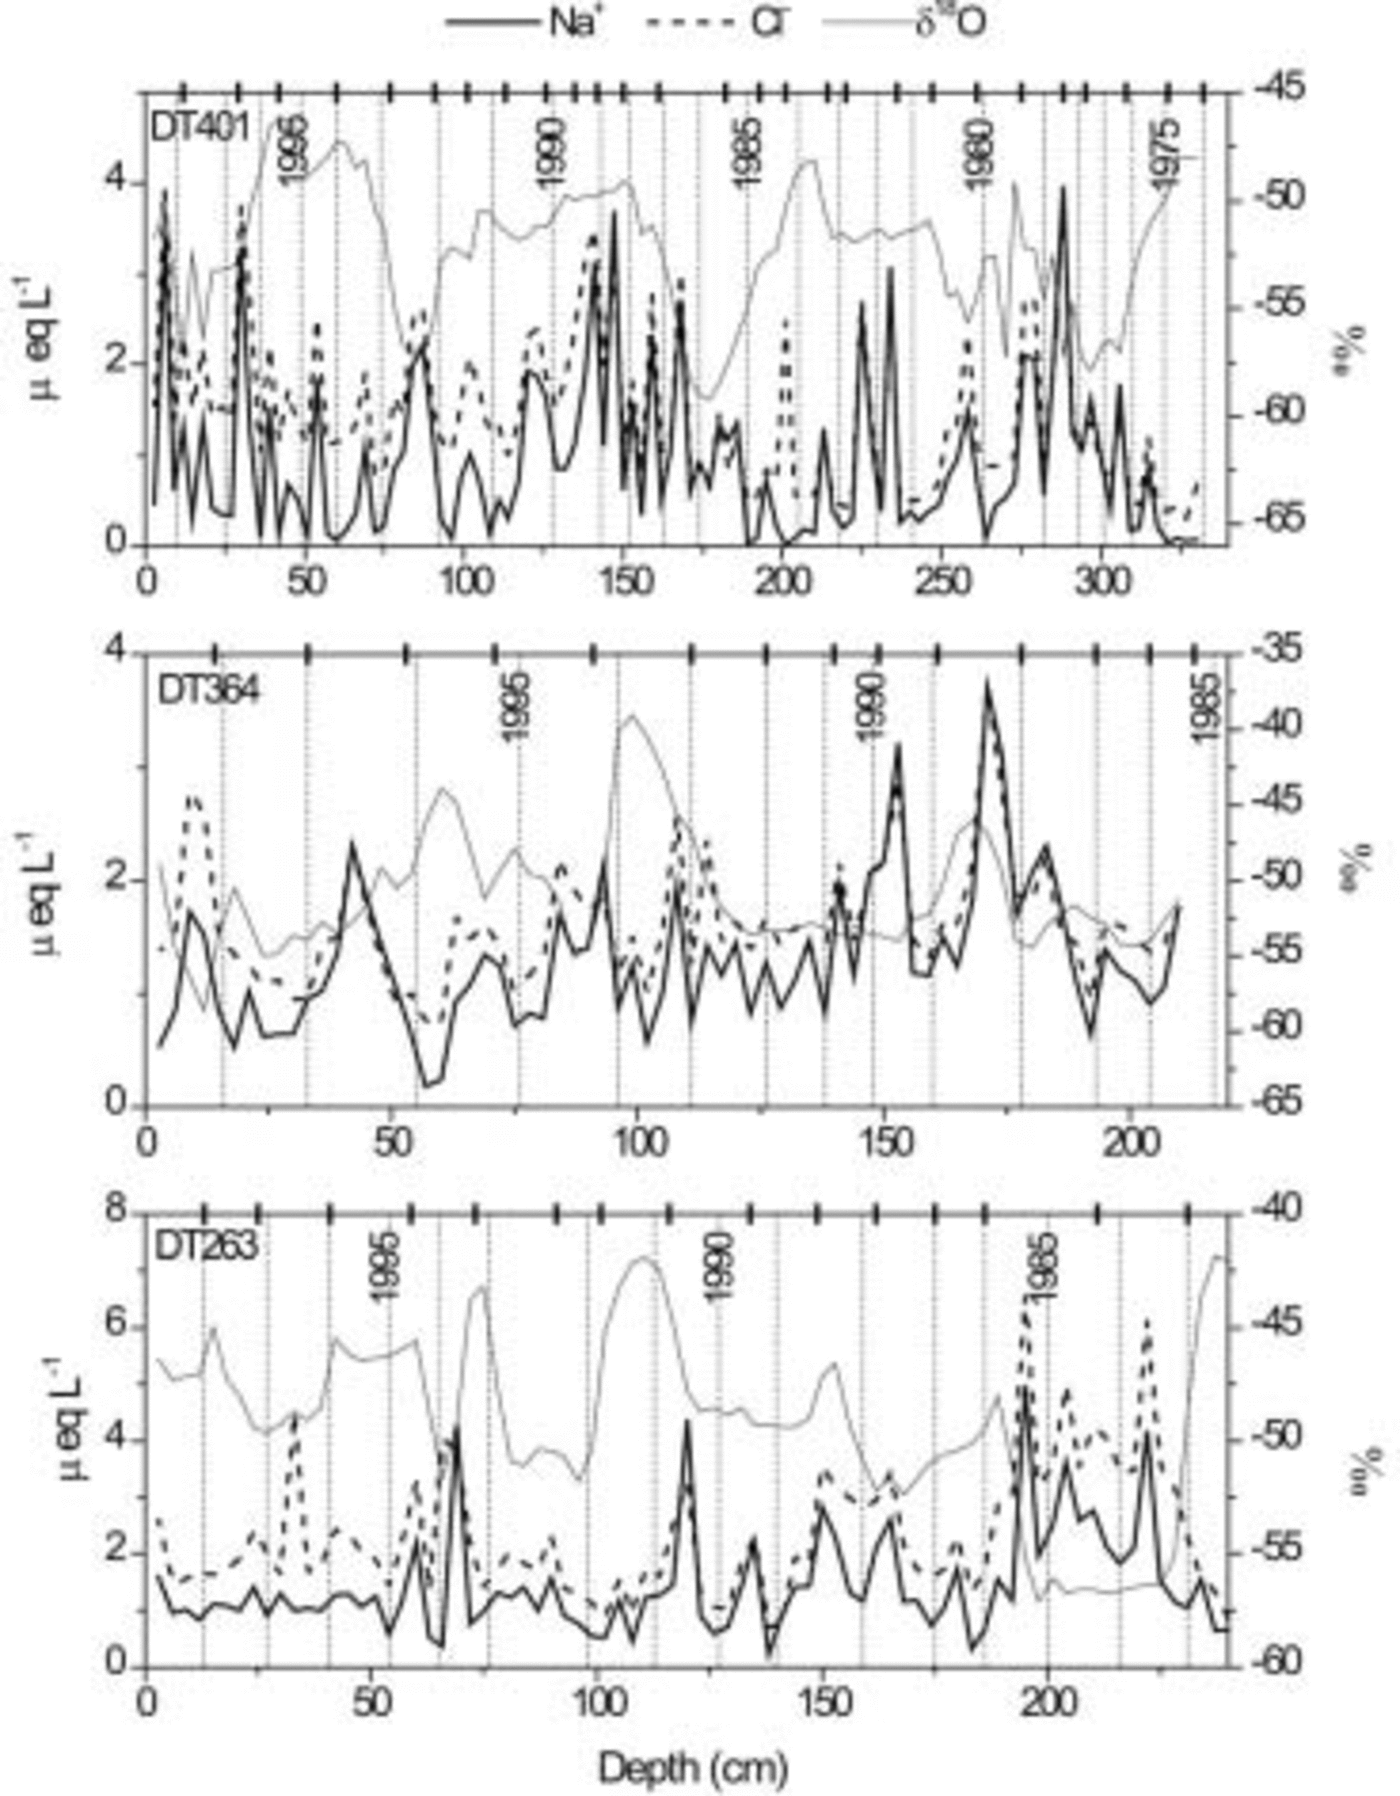
At first we tried to date the snow pits using the ice crusts and each ionic concentration profile separately. Results show that ice crusts do not always correspond with peaks or troughs of ionic profiles. In general, a firn layer in between ice crusts matches one annual cycle of ionic concentration variations, except for NO3 – and NH4 +. In view of this, and considering that correlation between Na+ and Cl– is better than between other ions, the annual-layer series were determined by taking the peaks of Na+ and Cl– concentrations as winter indicators and then adjusted according to the presence of ice crusts, as shown in Figure 2. The error of this dating technique is estimated to be about 10%.
Profiles of Na+, Cl– and δ18O compared with the ice-crust distribution (vertical bars on the upper coordinate axis). Annual layers from 1974 to 1998 are shown as vertical dotted lines in snow pits at DT401, DT364 and DT263, identified as explained in the text.
According to dating and density measurements, these three pits represent 25, 13 and 16 years of precipitation, and the accumulation rate on average is 60, 76 and 70 kg m–2 a–1 at DT401, DT364 and DT263, respectively. Figure 3 illustrates the accumulation-rate variations in these pits.
Variations of the accumulation rate at DT401, DT364 and DT263.

Ionic Concentrations
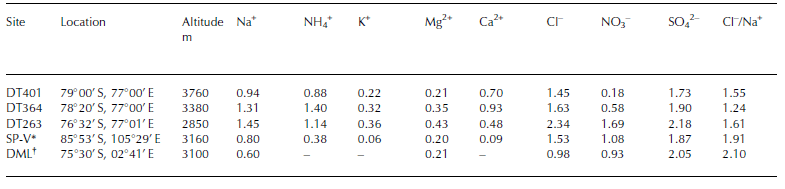
Concentration profiles of Na+ and Cl– in the snow pits are shown against depth in Figure 2. The derived time-scales, and NO3 – and nssSO4 2– are shown in Figures 4 and 5, respectively. Concentrations of K+, Mg2+ and Ca2+ are relatively low, <1.0 μeq L–1. All average ionic concentrations and the Cl–/Na+ ratio in these three pits are given in Table 1. For the sake of comparison, results at two snow pits at similar altitudes in other regions of East Antarctica are also quoted. One of these pits was sampled in late 1989 along a route from South Pole to Vostok (SP-V) (Qin, 1995); the other was sampled in the austral summer of 1993/94 in Dronning Maud Land (Reference StenbergStenberg and others, 1998).
NO3 – concentration profiles in snow pits at DT401, DT364 and DT263. The time markers are derived from Figure 2 as explained in the text.

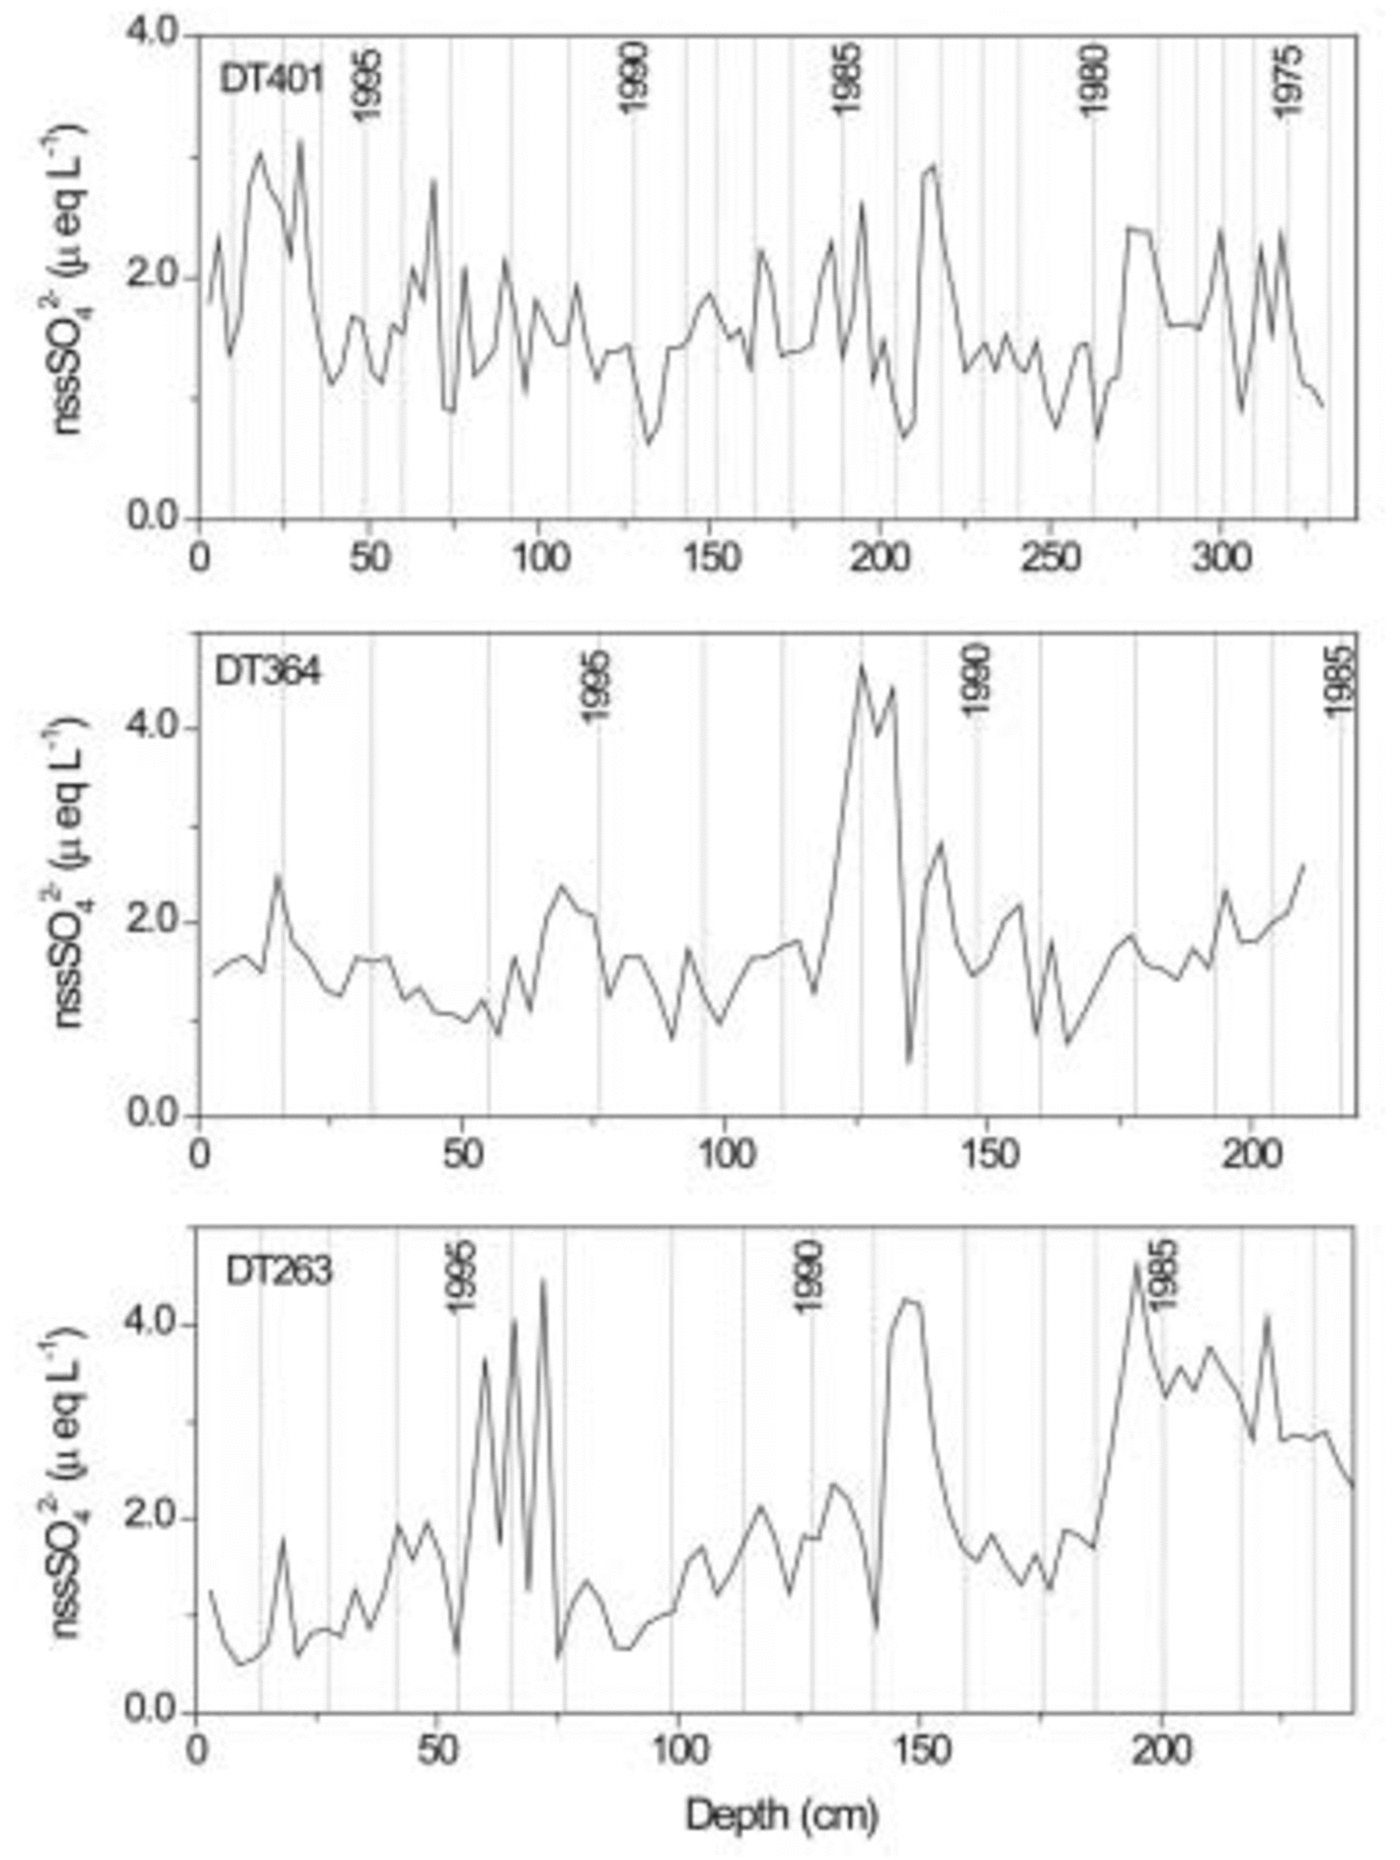
nssSO4 2– concentration profiles in snow pits at DT401, DT364 and DT263. The time markers were derived from Figure 2 as explained in the text. 1984–86, respectively. It is questionable whether these peaks all indicate volcanic eruptions. If the upper and lower peak sets are regarded as signals of Pinatubo (plus Hudson) and possibly El Chichόn (Mexico; 17.3˚N, 93.2˚ W) eruptions, respectively, the 1989 peak does not have a corresponding volcano event. It was estimated that the El Chichόn eruption in 1982 loaded 7±2 Mt of SO4 into the atmosphere (Reference Bluth, Doiron, Schnetzler, Krueger and WalterBluth and others, 1992), smaller than the Pinatubo eruption but larger than the Hudson eruption. However, this eruption has not been detected at DT001 (Reference ZhangZhang and others, 2002), only 500 km from DT263. More data are needed to confirm and further investigate the large differences between the three pit sites and whether the nssSO4 2– could be taken as an indicator of volcano events in this area.
Average values of ionic concentrations in snow pits (μeq L –1)
It is interesting to note that NO3 – concentrations are much lower than those of other ions, being <0.1 μeq L–1 in more than half of the samples in the pit at DT401, but comparable to Na+ concentrations at DT263. Very high values in the uppermost 10cm (the concentration of the first two samples is 6.14 and 1.56 μeq L–1, respectively) cause a moderate average concentration of NO3 – at DT401. This phenomenon also occurs at DT364 and on the SP-V route (Qin, 1995), but does not occur at DT263.
Very high NO3 – concentrations in the uppermost surface layers and rapid decay at depth have also been reported at a few other sites on the East Antarctic plateau, such as Dome C and Vostok, and at the South Pole (Reference Mayewski and LegrandMayewski and Legrand, 1990; Reference Whitlow, Mayewski and DibbWhitlow and others, 1992; Reference Dibb and WhitlowDibb and Whitlow, 1996). These results suggest that NO3 – is unstable and a great part of it may be lost by re-emission back to the atmosphere within 1 year in the central parts of East Antarctica.
NO3 – content in polar snow is believed to be affected by photolysis and lightning (Reference Clausen, Langway, Oeschger and LangwayClausen and Langway, 1989). Reference Jones, Weller, Wolff and JacobiJones and others (2000) and Reference Dominé and ShepsonDominé and Shepson (2002) have discussed photolysis of NOx in snow of Greenland and Antarctica. They have modelled the snowpack as a multiphase reactor in which physical exchange processes, heterogeneous reactions and photochemical reactions take place, but lack of quantitative understanding still hampers efforts to simulate these snowpack processes. Since reports of post-depositional loss of NO3 – in Antarctic snow are few, and the results between our pits strikingly different, we hope to collect further data and perform future investigations during the next traverses in the region.
Comparison of average ionic concentrations in various snow pits in Table 1 shows that concentrations of most ions decrease with increasing altitude and hence distance from the coast along the traverse route. It is difficult to explain the relatively high present values of NH4 + and Ca2+ at DT364. In general, concentrations of the main ions (e.g. Na+, Cl– and SO4 2–) in our snow pits are comparable to measurements in Dronning Maud Land and on the route from South Pole to Vostok (Qin, 1995). On the other hand, NH4 + is much higher along the Zhongshan–Dome A route than along the South Pole–Vostok route, and NO3 – is strikingly low at DT401 and DT364.
From Figures 2, 4 and 5 we can see that major-ionic concentrations increase with depth at DT263, the opposite is true at DT401 and no clear trend is apparent at DT364. This suggests that ionic concentrations have been increasing in recent decades at high altitudes and decreasing at lower altitudes, with a transition zone at around 3400ma.s.l. Since ionic concentrations are inversely proportional to the snow accumulation rate, if constant flux is assumed, this points to a regional difference in the snow accumulation variation (i.e. a decreasing accumulation rate near the plateau top and increasing rate at lower altitudes in the past two decades). Indeed, an accumulation-rate increase in recent years at DT263 and DT364 and decrease at DT401 can be seen in Figure 3. In addition, an apparent increase in the snow accumulation rate along the Zhongshan–Dome A traverse route in the past decades from the coast to a site 500 km inland, at altitudes lower than 2600 m, has also been revealed by shallow-core studies (Xiao and others, 2001; Ren and others, 2002).
On the other hand, ionic fluxes may also have changed with time in the past due to atmospheric circulation variations. At the South Pole, for example, it was reported that accumulation rate increased during the period from the 1950s to the 1980s (Reference Mosley-ThompsonMosley-Thompson and others, 1995), and concentrations of most ions, except NO3 –, had basically no changes (Reference Mayewski and LegrandMayewski and Legrand, 1990; Reference Whitlow, Mayewski and DibbWhitlow and others, 1992; Reference Legrand and MayewskiLegrand and Mayewski, 1997).
Non-sea-salt sulphates
In Antarctica, nssSO4 2– peaks have been taken as an indicator of volcanic eruptions in ice-core records. In East Antarctica, volcanic eruptions have been identified from nssSO4 2– data in snow and ice at the South Pole (Reference Delmas, Kirchner, Palais and PetitDelmas and others, 1992; Reference Cole-Dai, Mosley-Thompson and ThompsonCole-Dai and others, 1997), in Remote Plateau (84˚S, 43˚E; Reference Cole-Dai, Mosley-Thompson, Wight and ThompsonCole-Dai and others, 2000) and in Princess Elizabeth Land (at DT001 along the Zhongshan– Dome A route, 270 km inland and 2325 ma.s.l.) (Reference ZhangZhang and others, 2002). Figure 4 gives profiles of nssSO4 2– variations with depth and hence with time. It can be seen from these profiles that it is hard to identify any volcanic eruptions at DT401. But there is a striking peak in the profile at DT364. It is dated to be around 1993, possibly a signal of the Pinatubo (Philippines) and Hudson (Chile) eruptions in 1991. Pinatubo’s eruption was the largest in the 1990s (Reference KruegerKrueger and others, 1995) and has been detected around 1993 in ice cores at many sites in Antarctica, such as at South Pole (Reference Cole-Dai, Mosley-Thompson and ThompsonCole-Dai and others, 1997) and especially at DT001 (Reference ZhangZhang and others, 2002). The 1991 Hudson eruption was much smaller (Reference Doiron, Bluth, Schnetzler, Krueger and WalterDoiron and others, 1991) and was detected in 1992 at DT001 (Reference ZhangZhang and others, 2002). The DT263 profile displays three sets of high nssSO4 2– values, corresponding approximately to 1994–95, 1989 and
Conclusions
Preliminary results of three snow pits at altitudes of 2850– 3760m (800–1100km from the coast, respectively) show some apparent differences in ionic concentrations. At 3760ma.s.l., average ionic concentrations are lower and have increased in the last two decades. Unusually high concentrations of NO3 – are detected at 3760ma.s.l., with values of 6.14 and 1.56 μeq L–1 in the uppermost 10 cm, and an average concentration of all samples of 0.18 μeq L–1. At 2850ma.s.l. the opposite is true, i.e. the average ionic concentrations are relatively higher, ionic concentrations have decreased during the last 20 years and there is no remarkably high NO3 – concentration near the surface. At 3380 ma.s.l. the average ionic concentrations are moderate; the NO3 – values are similar at 3380 and 3760ma.s.l., i.e. concentration of the near-surface samples is strikingly high with a concentration of 3.69 and 1.02 μeq L–1 in the upper 10 cm, and an average concentration of all samples of 0.58 μeq L–1 at 3380ma.s.l. Ionic concentration values at 3380ma.s.l. have no definite temporal trend. The snow accumulation rate also has opposite trends depending upon site altitude. Accumulation rates have increased at 3380ma.s.l. from about 60 kg m–2 a–1 in the 1980s to about 90 kg m–2 a–1 in the 1990s, and from about 60 kg m–2 a–1 to 80 kg m–2 a–1 at 2850ma.s.l., while at 3760ma.s.l. they have decreased from about 70 kg m–2 a–1 in the mid-1970s and mid-1980s to about 60 kg m–2 a–1 in the late 1990s. The nssSO4 2– profiles in snow pits also display different features at the three sites: at 3760ma.s.l. no remarkable nssSO4 2– peaks can be distinguished, but one and three peak sets are quite striking at 3380 and 2850 m, respectively. These data indicate a difference in atmospheric circulation over the plateau top and over the lower-altitude region, with important regional differences in snow chemistry and snow-accumulation variation, and a transition zone at around 3400ma.s.l. More data are needed to confirm the regional trends and to explain the processes of snow–air interaction, atmospheric chemistry and atmospheric circulation.
Acknowledgements
This work was supported by the Ministry of Science and Technology of China (grant No. 2001CB711003, 2001DIA50040), the Chinese Academy of Sciences (grant No. KZCX2-303) and the National Natural Science Foundation of China (grant No. 49971021, 40071025).



