




No CrossRef data available.
Article contents
Speed, speed variability, and accuracy of information processing in 5 to 6-year-old children at risk of ADHD
Published online by Cambridge University Press: 11 April 2005
Abstract
The early assessment of Attention-Deficit/Hyperactivity Disorder (ADHD) children has mainly focused on the behavioral, social, and pre-academic impairments. This study examined whether 5 to 6-year-old children at risk of ADHD are characterized by information-processing deficits. By screening 1,317 children in Southern Limburg (the Netherlands) with the Child Behavior Checklist, 363 were selected and underwent a computerized examination. Eighteen months later, standardized psychiatric information was obtained. Thirty-three ADHD children were compared with 75 borderline ADHD children, 122 pathological controls, and 133 healthy controls. ADHD and borderline ADHD children were slower and more variable in their processing speed on all tasks than children with no or other pathology. These differences were most pronounced for the divided and focused attention tasks. Furthermore, one measure of a state regulation deficit discriminated between groups. With regard to accuracy, only the proportion of misses on a go–no-go task was higher in the ADHD group than in the other groups. Evidence was found that ADHD is better seen as a continuum rather than a discrete category. Already at a young age, children at risk of ADHD show specific information-processing deficits. Deficits in time perception and/or energetic state control in children with ADHD may possibly account for subnormal task performance. (JINS, 2005, 11, 173–183.)
Information
- Type
- Research Article
- Information
- Journal of the International Neuropsychological Society , Volume 11 , Issue 2 , March 2005 , pp. 173 - 183
- Copyright
- © 2005 The International Neuropsychological Society
INTRODUCTION
It is generally accepted that school-age children with Attention-Deficit/Hyperactivity Disorder (ADHD) have characteristic deficits in attention, information processing, and in executive functioning (e.g., Barkley, 1997; Brodeur & Pond, 2001; Carter et al., 1995; Mahone et al., 2001; Pennington & Ozonoff, 1996). However, most studies of ADHD have included children aged 7 and older, although symptoms of the disorder arise before this age (American Psychiatric Association, 1994). The lack of research with younger children can partly be attributed to the difficulty in establishing the diagnosis, because their behavior of children is variable and may temporarily include features of ADHD (Campbell & Ewing, 1990). Moreover, young children probably are not exposed to situations in which attentional demands are high. For these reasons, symptoms of inattention are not always seen (American Psychiatric Association, 1994, p. 81).
Few studies that did investigate young children with or at risk of ADHD mainly focused on behavioral, social, and pre-academic functioning (Cunningham & Boyle, 2002; DuPaul et al., 2001; McGee et al., 1991; Pierce et al., 1999). These studies showed that severe and persistent behavioral problems in young children are a potential risk of ADHD. Lower socioeconomic status, less optimal environment, reduced intellectual abilities, and pre-academic skill deficits were also associated with ADHD. Research on more specific neurocognitive functioning is scarce and the situation is still inconclusive. Marakovitz and Campbell (1998) included laboratory measures of inattention and impulsivity but found that these measures hardly differed between children later diagnosed with ADHD and control children. In contrast, two other studies demonstrated deficits in vigilance, motor control, and working memory in young hyperactive children (Byrne et al., 1998; Mariani & Barkley, 1997), but both studies were limited by using small and clinic-referred samples. More recently, three studies using large nonclinical samples, found specific deficits in inhibitory control associated with ADHD in the preschool period (Berlin & Bohlin, 2002; Hughes et al., 1998; Sonuga-Barke et al., 2002). Yet, a limited range of attention and information processing tasks has been used so far. Therefore, this study aims at a comprehensive assessment of attention abilities of young children at risk of ADHD to delineate specific deficits that may contribute to the behavioral pattern of ADHD.
In the present study, we examined a community sample of 5–6-year-old children at risk of ADHD with a set of computerized attention and information processing tasks (Amsterdam Neuropsychological Tasks, ANT; De Sonneville, 1999; De Sonneville et al., 1999). The ANT is a sensitive instrument for the delineation of attention and information processing deficits in school-age child psychiatric populations (De Sonneville et al., 1994; Swaab-Barneveld et al., 2000; Slaats-Willemse et al., 2003), and preschoolers (Groot et al., 2004). The chosen paradigms tap simple reaction time, divided, focused, and sustained attention skills, as well as inhibition. Following the attention theory of Schneider and Schriffrin (1977), who postulated attention as a limitation in the rate at which information can be processed in the working memory, controlled processing is slow, attention demanding, and capacity-limited, whereas automatic processing is relatively unconscious and generally fast. Divided attention is defined as the ability to direct (divide) attention across all stimulus elements of the signal, as they all are equally relevant to the decision-making process. Focused attention is defined as the ability to direct attention to the relevant information while ignoring irrelevant parts of the imperative signal. Sustained attention is defined as the ability to maintain performance level over time. Furthermore, inhibition was measured using a go–no-go task following Barkley's theory of behavioral inhibition (1997). Executive and attentional functions overlap in situations (tasks) in which the subject has to exert control over his behavior. Typical lists of executive functions include inhibition of prepotent responses (go–no-go/focused attention), integration across time (sustained attention), and working memory (divided/focused attention; e.g., Berger & Posner, 2000; Pennington & Ozonoff, 1996). The majority of neuropsychological tasks require more than one of the aforementioned cognitive operations.
We investigated whether the attention and information processing deficits are specific for ADHD, expecting that children later diagnosed with ADHD would perform significantly worse on attention tasks than children with other psychopathological conditions (referred to as pathological controls). We also examined whether ADHD represents a dimensional trait expressed in qualitative differences between individuals, with ADHD children at one extreme and healthy controls at the other (Barkley, 1998, p. 73, Levy et al., 1997) and included a borderline ADHD group (exhibiting ADHD symptoms in fewer than two situations). We hypothesized that they would perform better than the ADHD children but worse than healthy controls.
METHODS
This report is part of the Study of Attention Disorders in Maastricht (SAM), a prospective cohort study of precursors of ADHD in Southern Limburg, The Netherlands (Kalff et al., 2001; Kroes et al., 2001). The study was approved by the local ethics committee and informed consent was obtained from the participating children's parents.
Research Participants and Procedure
Phase 1 (selection)
All parents of children in the second grade of normal kindergarten schools who visited the Youth Health Care (YHC) for a periodic health examination were approached to participate in the study. Of the 2,290 eligible children, 1,317 children (57.5%; 699 boys and 618 girls, M age 5.87, SD 0.41) participated and their parents completed the Child Behavior Checklist (CBCL; Verhulst et al., 1996). Responders and non-responders were compared for child characteristics, family factors, and environmental factors by randomly sampling 200 subjects in each group (for a more detailed description; see Kroes et al., 2001). Information was obtained anonymously from the medical records of the YHC. No significant differences were found between the groups.
Of the 1,317 responders, three groups of children (in total N = 452) were selected for further investigation. The first group consisted of children with scores above the 90th percentile on the Externalizing scale and/or scores above the 95th percentile on the Attention Problem subscale (Group 1; N = 173). This group contained children with a putative risk for a later diagnosis of ADHD. The second group consisted of children with scores above the 90th percentile on the Internalizing scale and who were not members of Group 1 (Group 2; N = 59). Group 2 was included to contain children with a risk of other pathology. Children with clinical scores on Externalizing and Internalizing scales were assigned to Group 1. The third group, matched for age (± 2 months), sex, and school with Group 1 and 2, consisted of children with Total problem scores below the 90th percentile (Group 3; N = 220).
Phase 2 (assessment)
Starting 4 months after selection, the assessment phase began, in which 400 of the 452 selected children underwent a neurocognitive examination. Nine children no longer participated and 43 children could not be assessed for logistic reasons, such as a lack of school time or space available to assess the children. Assessment took place in a room at the children's school and was carried out by one of 10 well-trained psychologists who were blind to the group assignments.
Phase 3 (follow-up diagnosis)
Eighteen months after selection, when the children were about the age of 7–8 years (an age at which the diagnosis of ADHD can be given with more certainty and reliability), 403 parents of the 452 selected children were interviewed using the ADIKA (Kortenbout van der Sluijs et al., 1993). This is the Dutch version of the Diagnostic Interview for Children and Adolescents (DICA; Herjanic & Reich, 1982), which is based on DSM–III–R criteria (American Psychiatric Association, 1987). The ADIKA was adapted, using the criteria of DSM–IV, to make it suitable for ADHD classification (Van Grimbergen et al., 1999). Although the Dutch version of the interview has not been validated, the reliability and validity of the DICA are reported to be good (Reich, 2000). Eleven percent of the children's parents (N = 49) refused further participation or had moved. Three interviewers were trained and supervised by a senior child psychiatrist and were blind to group membership. Diagnoses were generated from the coded ADIKAs by a computer algorithm ignoring hierarchical DSM criteria (Rozendaal, 1998). Four groups of children were classified: (1) an ADHD group; (2) a borderline ADHD group with all ADHD symptoms but whose symptoms did not lead to disruption in at least two situations, based on parent reports; (3) a pathological control group which met at least one of the DSM–III–R classifications for oppositional defiant disorder, conduct disorder, anxiety disorders, mood disorders, obsessive compulsive disorder, Asperger's disorder, or disorders of elimination but not ADHD; (4) a healthy control group. Comorbidity with other psychiatric disorders was allowed in the ADHD and borderline ADHD groups because this appears the rule rather than the exception in ADHD in the general population (Kadesjö & Gillberg, 2001). Because of the diversity of the comorbidity, the various diagnoses were included in the pathological control group. The children met full diagnostic criteria of the other diagnoses (see Table 1 for an overview of patterns of disorders across groups).
Comorbid diagnoses in population sample of cases with ADHD, borderline ADHD, and a mixture of other pathology

Complete neurocognitive and ADIKA data were available for 363 children (80% of the original selected sample). There were no significant differences in sex or CBCL selection group between the children included or excluded from the analyses. The groups differed significantly with regard to their age; the included group was younger [F(1,450) = 27.23, p < .001] and parental occupation higher in the included group [F(1,450) = 5.11, p = .024].
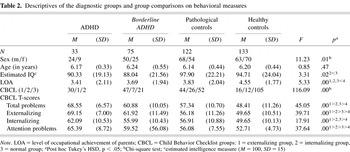
Demographic characteristics for the four diagnostic groups are shown in Table 2. There were significant differences in sex, estimated IQ, parental occupation, and CBCL T-scores between the groups. The three groups selected by means of the CBCL were disproportionately distributed with regard to the ADIKA classification. For example, most children with ADHD (91%) came from Group 1 (externalizing group) and most healthy control children (79%) originated from Group 3 (normal group).
Descriptives of the diagnostic groups and group comparisons on behavioral measures

Dependent Measures
Five reaction time subtasks of the ANT-program were used. A baseline speed task, which measures simple reaction time, was followed by a go–no-go task to measure inhibition and inattention. The other tasks assess different aspects of attention (sustained, divided, focused) and require, as a consequence of imposed working memory demands, controlled information processing. The children were required to respond as rapidly and accurately as possible to visual stimuli presented on a laptop screen. Trials with response latencies falling outside a predefined response window were automatically replaced by trials of a similar type. For all tasks, this window was 200–8000 ms post-stimulus onset, except for the go–no-go task (200–2300 ms). Thus, responses to signals had to be generated between 200 and 8000 ms after a signal; responses made before 200 ms were not expected to be the result of a cognitive evaluation and those made after 8000 ms were no longer considered a valid response. Practice trials were administered before the child was given the actual test.
Baseline speed task
A fixation cross is displayed on the computer screen, which changes into a white square (signal). Upon its presence the child should press the mouse key, after which the cross reappears. Timing between signals is controlled by a random post-response interval (PRI) of 500–2500 ms to prevent signal anticipation strategies. The task consists of two parts with 32 trials for each index finger.
Go–no-go task
The go signals, to which the child has to press a key, are randomly mixed with no-go signals, to which the child has to withhold a response (24 signals of each type, see Figure 1, upper left). The signals are presented for 800 ms (but disappear if a response is given within this period) with an event rate of 3000 ms.

Go–no-go task (two upper left pictures), focused attention task (upper right), sustained and divided attention tasks (lower left). The lower right diagram depicts the timing between signals. In the go–no-go task an event rate is used and signal duration is 800 ms. The other tasks use a post response interval (PRI); stimuli remain on the screen until a response is given. The tasks use a 500 ms warning signal (+), except the sustained attention task.
Sustained attention task
During this task a house is continuously depicted on the screen. Each trial consists of the presentation of one animal randomly in one of the windows (see Figure 1, the shaded animals indicate the other possible locations of the stimulus, PRI = 250 ms). In total, 20 series of 12 trials are presented. The child is instructed to press the yes key with the preferred hand when they detect a bee (target signal) and the no key with the non-preferred hand when the signal does not contain the bee (non-target signal). During each series of 12 trials, 6 targets and 6 non-targets are randomly presented. Visual feedback on error responses is given by a red square that appears at the center of the house.
Divided attention task
Each trial consists of the simultaneous presentation of four animals in the windows and in the door of the house (see Figure 1) that is continuously presented. The child is instructed to press the yes key when the signal contains an animal from a memory set (target signal), and to press the no key when this is not the case (non-target signal). In total, 40 targets and 40 non-targets are presented in random order with a PRI of 1000 ms.
Focused attention task
During this task a fruit basket is continuously present on the screen (Figure 1, upper right). Each trial consists of the simultaneous presentation of four pieces of fruit in the basket. Two pieces of fruit are aligned in a vertical fashion (top and bottom) and two pieces in a horizontal fashion (left and right). The child is instructed to attend the vertical axis and to ignore the pieces of fruit on the horizontal axis. The child has to press the yes key when there are cherries (target fruit) on the horizontal axis (relevant target signal). If cherries are on the vertical axis (irrelevant target signal) or there are no cherries (non-target signal) the child has to press the no key. These three signal types are presented in a random order (28 target signals, 14 irrelevant target signals, and 14 non-target signals, PRI = 1200 ms).
Other Measures
The Vocabulary subtest from the Revised Amsterdam Child Intelligence Test (RAKIT) (Bleichrodt et al., 1987) was used to estimate verbal intelligence. The vocabulary subtest measures the verbal ability of the child and is comparable with the well-known Peabody Picture Vocabulary Test, which is considered to give a valid approximation of verbal IQ (Hinton et al., 2001; Marakovitz & Campbell, 1998).
The Level of Occupational Achievement (LOA) of the parents was scored on a 7-point scale based on the mental complexity of the work, as rated by job experts (DGA, 1989). The scale ranges from unskilled to academic labor. For children living with both parents, the highest level was used; for the remaining children, the level of the parent with whom the child lived was used.
Scores
The following parameters were calculated for all tasks:
- Speed. Mean response time across all correct responses (in ms) was computed in each task as an index for speed of information processing.
- Variability in speed. Mean within-subjects standard deviation of reaction time across all correct responses was computed in each task as a measure of speed variability.
- Accuracy of processing. Per task, mean percentage of errors was computed as an index of accuracy of processing. For the go–no-go task, two error types were analyzed separately because they are related to different processes. A false alarm (pressing the key on no-go signals) is considered as a measure of inhibition while a miss (failing to press the key on go signals) is a measure of inattention. In addition, a speed-accuracy trade off was computed to analyze whether there is a correlation between the number of false alarms and hit reaction time. For the sustained attention task, additional variables were calculated to evaluate the continuous maintenance of alertness over time as well as the ability to adjust behavior following feedback on errors:
- Time-on-task. Changes with time-on-task were calculated per block of five series (four blocks in total) with respect to mean speed and percentage error.
- Fluctuation in speed across total task time. The within-subjects standard deviation of completion time per series across 20 series was computed.
- Behavioral change after feedback. Errors usually make subjects adjust their behavior by taking more time to process the next signal, which is reflected in a response delay when compared with speed of responses after correct (regular) responses. This shift, computed as percentage of the regular speed [100 * (RTafter error − RTregular)/ RTregular], is considered to reflect behavioral adaptability, in that shorter delays signify less capacity to adjust response behavior, presumably as a result of impulsivity, and longer delays reflect adequate adjustments.
Statistical Analyses
Overall task performance at 5–6 years of age in the diagnostic groups was analyzed in a 4 × 5 (Group × Task) GLM repeated measures design with separate runs for the three types of scores (speed, speed variability, and accuracy), using the Geiser Greenhouse corrected probabilities to deal with unequal sample sizes. The Group × Task interaction reflects the extent to which differences between groups are task dependent; that is, associated with specific attention deficits. Polynomial contrasts were used to examine the linear effect across the group classifications; that is, whether the groups can be arranged on a continuum with ADHD at one extreme and healthy controls at the other. In order to test whether differences in speed, speed variability, and accuracy were specific for ADHD, GLM analyses were performed per task, in which all other groups were compared with the ADHD group, using simple contrasts.
The speed–accuracy trade-off in the go–no-go task was analyzed by means of Pearson's correlation coefficient. To investigate the effect of time-on-task in the sustained attention task, a GLM repeated measures analysis was performed with time-on-task as within-subjects factor (Blocks 1,2,3,4) with separate runs for reaction time and error rate. ANOVAs were used to analyze group differences in fluctuations in speed and behavioral change after feedback (shift). To analyze whether the group differences are due to overall slowing and more variable responding or more specific to the search/decision process, post-hoc analyses were performed with the response type (hit vs. correct rejection) as a within-subjects factor.
All analyses were done with and without IQ and baseline speed as covariates. Sex and LOA were not entered as covariates because univariate F tests indicated that there were no significant differences between high and low LOA and no significant differences between boys and girls in the healthy control group on all measures except for the percentage of false alarms in the go–no-go task and the percentage of errors in the divided attention task (boys made more errors than girls). Therefore, sex was entered as covariate in the accuracy GLM repeated measures analysis. All data were analyzed using SPSS 10.0.
RESULTS
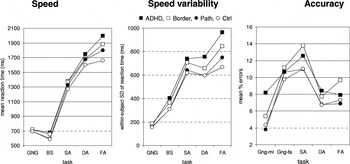
The results were examined separately for extremes in mean reaction times >3 times the interquartile range from the median (n = 3) and for error rates > 50% (n = 40). In studies using continuous performance tests with preschoolers (age range 3–6 years), error rates have been found to be consistently high (Corkum et al., 1995; Hagelthorn et al., 2003; Prather et al., 1995). The number of children excluded differed for each task: 1 (extreme) for the baseline speed task, 7 (all error rates > 50%) for the go–no-go task, 6 (1 extreme and 5 error rates >50%) for the sustained attention task, 13 (1 extreme and 12 error rates >50%) for the divided attention task, and 16 (all error rates >50%) for the focused attention task. Another 16 children did not perform the last task because the assessment schedule ran out of time. For the repeated measures analyses including all tasks simultaneously, listwise deletion thus resulted in an exclusion of 47 children in total. No significant differences in exclusion rate were found between the diagnostic groups. Figure 2 shows the three main parameters for the diagnostic groups as a function of task type.

Speed, speed fluctuation, and accuracy of processing as a function of group classification and task type. BS = baseline speed, GNG = go–no-go, FA = focused attention, DA = divided attention, SA = sustained attention, GNG–mi/fa = misses/false alarms GNG.
Speed
The repeated measures analysis of reaction times revealed a significant main effect of group [F(3,291) = 5.18, p = .002] and a significant Group × Task interaction [F(12,1164) = 3.55, p < .001]. Thus, the groups differed in speed of processing and these differences were task dependent, with largest differences on the divided attention task and, in particular, the focused attention task, and the smallest differences on the baseline speed and go–no-go tasks (see Figure 2, left panel). The polynomial contrast was significant (p = .001), showing a linear effect for reaction time, with controls being fastest and ADHD children being slowest. The simple contrasts in the multivariate analysis per task revealed that the healthy controls were faster than the ADHD children on all tasks (see Table 3), but only marginally faster on the sustained attention and go–no-go tasks. The pathological controls were faster than the ADHD children on the baseline speed and focused attention tasks, and the borderline ADHD children were marginally slower than the ADHD children on the Divided Attention task only.
P-levels <.10 for simple contrasts with ADHD as the reference group, per task, per type of score

Variability in Speed
A significant main effect of group on speed variability [F(3,291) = 6.78, p < .001] and a significant Group × Task interaction [F(12,1164) = 3.10, p < .001] were found. Thus, the groups differed in speed variability and these differences were task dependent, with the largest differences on the divided and focused attention tasks (see Figure 2, middle panel). The polynomial contrast was significant (p < .001), showing a linear effect for speed variability, with controls showing the least variability and ADHD the most. The simple contrasts revealed that healthy and pathological controls showed less variability in speed than the ADHD children on all tasks, except for the go–no-go task (see Table 3). The borderline ADHD children showed less variability in speed than the ADHD children on the divided attention task only.
Accuracy of Processing
The repeated measures analysis of accuracy of processing revealed neither a significant main effect of group nor an interaction of Group × Task (see Figure 2, right panel). No linear effect was found for accuracy. The simple contrasts revealed that healthy controls and pathological controls made fewer misses on the go–no-go task than the ADHD children (see Table 3). No significant inverse correlation was found between the hit reaction time and the percentage of errors, indicating that there was no speed–accuracy trade-off.
Additional Sustained Attention Measures
With respect to time-on-task, significant effects were found for reaction times [F(3,338) = 4.80, p = .003] and error rates [F(3,338) = 22.36, p < .001], indicating a decrease in vigilance over time (two left panels in Figure 3). However, no significant interaction effect was found, indicating that time-on-task did not differentiate between groups. Figure 3 (inner right panel) shows that groups differed in the fluctuations in speed across total task time, with the greatest fluctuations being seen in the ADHD children [F(3,334) = 4.91, p = .002]. Figure 3 (outer right panel) shows that the groups had significantly different response delay times, with the borderline ADHD children having a smaller response delay after feedback than the healthy controls [F(3,338) = 4.14, p = .007].

Tempo and accuracy during sustained attention with time-on-task (Block 1–Block 4), overall fluctuation and effect of feedback on response latency. 1 = first 25% of trials,…, 4 = last 25% of task trials.
The post-hoc analyses with the response type as within subjects factor revealed no significant Group × Response Type interaction, indicating that the group differences are not due to the specific search/decision processes. Analyses with IQ and baseline speed as covariates yielded similar results as the analyses without the covariates with regard to the main effects, linear effects, and simple contrasts in all analyses. For example, there was still a significant main effect of group [F(3,295) = 4.206, p = .006] and a significant Group × Task interaction [F(12,1180) = 3.27, p < .001] in the repeated measures analysis of reaction time when IQ was entered as a covariate. Thus, the differences between groups were hardly affected and therefore these data are not further shown.
DISCUSSION
Five-to-six-year-old children classified with ADHD or borderline ADHD at 18 months' follow-up were found to be generally slower and, especially, more variable in their speed of information processing than children who were later diagnosed with no or other psychopathology. Interestingly, these differences between the groups were greatest on the divided attention and the focused attention task. These tasks require controlled information processing as complex memory search and decision processes have to be executed. The results thus suggest that specific information processing deficits, in addition to a slower baseline speed, occur early in the development of ADHD.
Regarding the sustained attention task, ADHD and borderline ADHD children showed greater fluctuations in speed than did the pathological and healthy controls, which indicates that such children have difficulty maintaining a stable level of performance. This deficit was present from the beginning: speed and accuracy did not decline disproportionately during this task in the ADHD children, which renders the possibility of ADHD-related fatigue ability as unlikely. Even though only one of the three markers of a sustained attention deficit distinguished between the groups, it does not mean that this deficit can be ruled out as an important problem in ADHD. The young child with or without ADHD may perform differently on this task than children who are older, thus it may be a developmental, age-related factor, which simply has not emerged in the young child to the extent seen in older children.
We found that response speed variability yielded the most significant differences between children with ADHD and children with no or other pathology. This extreme variability in response latencies is one of the most robust findings reported for older children with ADHD (Paule et al., 2000). Various explanations have been proposed, such as a lack of consistent effort (Kuntsi et al., 2001; Oosterlaan & Sergeant, 1996), characterizing the core deficit as a state regulation deficit (in line with, e.g., Börger & Van der Meere, 2000; Sergeant et al., 1999). State regulation is the ability of an organism to change from a current non-optimal arousal or activation state in the direction of an optimal (target) state to fulfill the task requirements (Hockey, 1997). Effort is the energy necessary for the regulation of the organism's actual state. The Papez circuit (hypocampus–hypothalamus–cingulated gyrus–hypocampus) and the anterior thalamic nucleus are believed to be involved in such compensatory control (Gray, 1982; McGuinness & Pribram, 1980).
An alternative explanation is that ADHD is characterized by an impairment in time perception and more specifically the precise representation of temporal information leading to an inability to predict precisely the point in time when an impending stimulus event requires a fast response, thereby causing variable response times on all reaction time tasks (Paule et al., 2000). An intriguing model is proposed that links working memory, a key component underlying executive functions associated with control of motor processes, also playing a central role in time perception, with impairments in behavioral inhibition which is thought to cause less efficient executive functioning. Neuroimaging studies have found abnormalities in brain morphology in ADHD in those brain regions (e.g., cerebellum, basal ganglia, and frontostriatal circuitry) that subserve time perception, as well as executive functioning (Aylward et al., 1996; Berquin et al., 1998; Casey et al., 1997). Also, Stuss et al. (2003) have demonstrated that lesions in the frontal lobes (with the exception of the ventral medial/orbitofrontal region) in adults in particular impair the stability of behavior and led to increased intra-individual variability. When viewing ADHD as a predominantly frontal–subcortical disorder, our findings of extreme variability of response speed during controlled information processing are consistent with this view. Moreover, our results extend to young children aged 5–6 years, suggesting the existence of early developmental neurocognitive markers of ADHD.
An inability to adjust behavior to error feedback is specific for school-age children with ADHD (Swaab-Barneveld et al., 2000). We, however, found only borderline ADHD children to be significantly less responsive to feedback (35% delay) than the healthy control children (52% delay). The ADHD children showed a mean delay of 40% but it is possible that a small sample size has precluded reaching a significant result. Further investigation must elucidate the importance of this measure, which can be seen as a measure of inhibition to the prepotent tendency to press as fast as possible, in young children. Such measures of inhibition have been associated to overflow movements, reflecting immaturity of neural systems (Mostofsky et al., 2003a). The authors explain this association by abnormalities within premotor circuits. These regions are critical for inhibition of conscious, effortful responses (Mostofsky et al., 2003b).
Remarkably, the ADHD and borderline ADHD children could not be distinguished from the pathological and healthy controls by their accuracy on almost all tasks. Most studies with school-aged ADHD children have demonstrated an overall inaccuracy in responding (e.g., Kuntsi et al., 2001; Swaab-Barneveld et al., 2000). To this end, it may be concluded that error rates in young preschool children are not the primary variable of interest when using information processing tasks, which is in line with the findings of Hagelthorn et al. (2003). They concluded that focusing on response time and variability may be of more clinical utility for preschoolers. Yet, our results did show one difference in the error rate between groups, that is, in the percentage of misses, a measure of inattention (Corkum & Siegel, 1993), on the go–no-go task, with the ADHD group making more errors than the two control groups, whereas there were no differences in false alarms, a measure of inhibition, between groups. There was no fast guess trade-off. However, this is only one form of inhibition and perhaps this has not emerged in the young child to the extent seen in the older child. While the young ADHD children may not be impulsive in this sense they may still be impulsive in terms of their preference for immediacy over delay or their dislike of waiting. Other authors have also failed to find significant differences in impulsivity (Marakovitz & Campbell, 1998; Mariani & Barkley, 1997), including Swanson et al. (1998), who cite a number of studies supporting the view that ADHD children have an inefficient response style (i.e., slow and inaccurate) rather than an impulsive response style (i.e., fast and inaccurate). Our results clearly demonstrate that inattention is associated with ADHD from an early age and therefore may be an important predictor of the disorder.
Our findings support hypothesis that ADHD represents a dimensional trait, also found by others (Levy et al., 1997; Sonuga-Barke et al., 2002). There was a linear change in speed and variability in speed between the groups, with ADHD at one extreme, followed by borderline ADHD, pathological controls, and then healthy controls. This suggests that the behavioral symptoms of ADHD alone do not necessarily lead to poor performance on computerized attention tasks. Perhaps the impairments as opposed to symptoms, per se, are associated with attentional deficits, as the borderline ADHD group meet the criteria for ADHD in symptoms but are not impaired in two situations and sometimes not at all impaired in any situation. However, our data do not permit to draw conclusions about the causality.
There are several limitations to be mentioned. Because of our study design, with a selection procedure based on CBCL scores, our results do not reflect the true incidence of ADHD in the population. All children with problem behavior were selected whereas only some of the control children relative to the original population were selected. Weighted analyses can adjust for this, although there is some debate concerning this methodology (Korn & Graubard, 1999, pp. 159–182). Second, the relatively low response rate (57.5%) may have biased the findings. However, no systematic differences were found between responders and non-responders. Third, the psychiatric diagnoses in our study were generated by means of the ADIKA and no behavioral data were collected in the third phase in order to obtain an overall level of psychopathology or severity. Moreover, we did not use multiple informants–we were not able to obtain teacher information during the first phase of the study. Thus, we must be cautious to generalize our results and rather speak of ADHD as determined by parents' ratings. Nevertheless, Gomez et al. (1999) reported that parents' estimates tend to be higher than those of teachers while diagnosing ADHD, which would imply overestimates of ADHD in our study.
In addition, we must be cautious about the true nature of the control groups, and therefore in all contrasting results, because perhaps some of these children will ultimately be diagnosed as having ADHD but did not meet the DSM criteria at the time the study was conducted. However, the results may be considered as a conservative estimate of the actual situation because these differences will only be larger when these children are filtered out of the control group.
Our results show that neurocognitive assessment already at young age reveals differences in cognitive patterns between children at risk of ADHD and control children. Exposing young children to test situations, which vary in level of controlled processing demands, brings out deficits in controlled processes termed executive function (control of motor processes and working memory) suggestive of impairments in time perception and/or energetic state control. These impairments are detrimental to the prediction and anticipation of events, the organization and planning of sequences of actions, cognitive and social interactive processes, and may thus hamper the development of intellectual and social skills. More knowledge of the cognitive developmental profiles of children at risk of ADHD may lead to directed intervention programs, which may prevent further difficulties.
ACKNOWLEDGMENTS
This study was supported by the Brain & Behavior Research Institute of University of Maastricht; the University Hospital of Maastricht fund for outstanding and competitive clinical research: the Profileringsfonds; the Prevention Foundation of the Netherlands; and the St.-Clemens and Kan.Salden Foundations of the Netherlands.
References
REFERENCES
American Psychiatric Association.
(1987).
Diagnostic and statistical manual of mental disorders
(Rev. 3rd ed.).
Washington, DC:
Author.
American Psychiatric Association.
(1994).
Diagnostic and statistical manual of mental disorders
(4th ed.).
Washington, DC:
Author.
Aylward, E.H.,
Reiss, A.L.,
Reader, M.J.,
Singer, H.S.,
Brown, J.E., &
Denckla, M.B.
(1996).
Basal ganglia volumes in children with attention-deficit
hyperactivity disorder.
Journal of Child Neurology,
11,
112–115.Google Scholar
Barkley, R.A.
(1997).
Behavioral inhibition, sustained attention, and executive functions:
Constructing a unifying theory of ADHD.
Psychological Bulletin,
121,
65–94.Google Scholar
Barkley, R.A.
(1998).
Attention-Deficit/Hyperactivity Disorder. A Handbook for
Diagnosis and Treatment
(2nd ed.).
London:
Guilford.
Berger, A. &
Posner, M.I.
(2000).
Pathologies of brain attentional networks.
Neuroscience and Biobehavioral Reviews,
24,
3–5.Google Scholar
Berquin, P.C.,
Giedd, J.N.,
Jacobsen, L.K.,
Hamburger, S.D.,
Krain, A.C.,
Rapoport, J.L., &
Castellanos, F.X.
(1998).
Cerebellum in attention-deficit hyperactivity disorder: A
morphometric MRI study.
Neurology,
50,
1087–1093.Google Scholar
Berlin, L. &
Bohlin, G.
(2002).
Response inhibition, hyperactivity, and conduct problems among
preschool children.
Journal of Clinical Child Psychology,
31,
242–251.Google Scholar
Bleichrodt, N.,
Drenth, P.J.D.,
Zaal, J.N., &
Resing, W.C.M.
(1987).
RAKIT: Handleiding bij de Revisie Amsterdamse Kinder Intelligentie
Test [Manual of the revised Amsterdam intelligence test for
children].
Lisse, The Netherlands:
Swets & Zeitlinger.
Börger, N. &
Van der Meere, J.
(2000).
Motor control and state regulation in children with ADHD: A cardiac
response study.
Biological Psychology,
51,
247–267.Google Scholar
Brodeur, D.A. &
Pond, M.
(2001).
The development of selective attention in children with
Attention-Deficit/Hyperactivity Disorder.
Journal of Abnormal Child Psychology,
29,
229–239.Google Scholar
Byrne, J.M.,
DeWolfe, N.A., &
Bawden, H.N.
(1998).
Assessment of Attention-Deficit/Hyperactivity Disorder in
preschoolers.
Child Neuropsychology,
4,
49–66.Google Scholar
Campbell, S.B. &
Ewing, L.J.
(1990).
Follow-up of hard-to-manage preschoolers: Adjustment at age 9 and
predictors of continuing symptoms.
Journal of Child Psychology and Psychiatry,
31,
871–889.Google Scholar
Carter, C.S.,
Krener, P.,
Chaderjian, M.,
Northcutt, C., &
Wolfe, V.
(1995).
Abnormal processing of irrelevant information in
Attention-Deficit/Hyperactivity Disorder.
Psychiatry Research,
56,
59–70.Google Scholar
Casey, B.J.,
Castellanos, F.X.,
Giedd, J.N.,
Marsh, W.L.,
Hamburger, S.D.,
Schubert, A.B.,
Vauss, Y.C.,
Vaituzis, A.C.,
Dickstein, D.P.,
Safatti, S.E., &
Rapoport, J.L.
(1997).
Implication of right frontostriatal circuitry in response inhibition
and attention deficit/hyperactivity disorder.
Journal of the American Academy of Child and Adolescent
Psychiatry,
36,
374–383.Google Scholar
Corkum, P.V.,
Byrne, J.M., &
Ellsworth, C.
(1995).
Clinical assessment of sustained attention in preschoolers.
Child Neuropsychology,
1,
3–18.Google Scholar
Corkum, P.V. &
Siegel, L.S.
(1993).
Is the Continuous Performance Task a valuable research tool for use
with children with Attention-Deficit/Hyperactivity Disorder?
Journal Child Psychology and Psychiatry Allied Disciplines,
34,
1217–1239.Google Scholar
Cunningham, C.E. &
Boyle, M.H.
(2002).
Preschoolers at risk for Attention-Deficit Hyperactivity Disorder
and Oppositional Defiant Disorder: Family, parenting, and behavioral
correlates.
Journal of Abnormal Child Psychology,
30,
555–569.Google Scholar
De Sonneville, L.M.J.
(1999).
Amsterdam Neuropsychological Tasks: A computer-aided assessment
program.
In
B.P.L.M. Den Brinker,
P.J. Beek,
A.N. Brand,
S.J. Maarse, &
L.J.M. Mulder (Eds.),
Cognitive ergonomics, clinical assessment and computer-assisted
learning: Computers in psychology (pp.
187–203).
Lisse, The Netherlands:
Swets & Zeitlinger.
De Sonneville, L.M.J.,
Njiokiktjien, C., &
Bos, H.
(1994).
Methylphenidate and information processing: I. Differentiation
between responders and nonresponders: II. Efficacy in responders.
Journal of Clinical and Experimental Neuropsychology,
16,
877–897.Google Scholar
De Sonneville, L.M.J.,
Visser, M., &
Licht, R.
(1999).
Attention and information processing in 4- and 5-year-old children:
Results of a computerized assessment technique.
In
B.P.L.M. Den Brinker,
P.J. Beek,
A.N. Brand,
S.J. Maarse, &
L.J.M. Mulder (Eds.),
Cognitive Ergonomics, Clinical Assessment and Computer-Assisted
Learning: Computers in Psychology (pp.
204–217).
Lisse, The Netherlands:
Swets & Zeitlinger.
Directoraat-Generaal voor de Arbeidsvoorziening
(DGA).
(1989).
Handleiding voor de functie analyze [Manual functional
analysis].
SDU Uitgeverij; The Netherlands:
The Hague.
DuPaul, G.J.,
McGoey, K.E.,
Eckert, T.L., &
vanBrakle, J.
(2001).
Preschool children with Attention Deficit/Hyperactivity
Disorder: Impairments in behavioral, social, and school
functioning.
Journal of the American Academy of Child and Adolescent
Psychiatry,
40,
508–515.Google Scholar
Gomez, R.,
Harvey, J.,
Quick, C.,
Scharer, I., &
Harris, G.
(1999).
DSM–IV AD/HD: Confirmatory factor models, prevalence, and
gender and age differences based on parent and teacher ratings of
Australian primary school children.
Journal of Child Psychology and Psychiatry,
40,
265–274.Google Scholar
Gray, J.A.
(1982).
The neuropsychology of anxiety: An inquiry into the functions of the
septo-hippocampal system.
Oxford, England UK:
Clarendon Press.
Groot, A.S.,
de Sonneville, L.M.J.,
Stins, J.F., &
Boomsma, D.I.
(2004).
Familial influences on sustained attention and inhibition in
preschoolers.
Journal of Child Psychology and Psychiatry,
45,
306–314.Google Scholar
Hagelthorn, K.M.,
Heimenz, J.R.,
Pillion, J.P., &
Mahone, E.M.
(2003).
Age and task parameters in continuous performance tests for
preschoolers.
Perceptual and Motor Skills,
96,
975–989.Google Scholar
Herjanic, B. &
Reich, W.
(1982).
Development of a structured psychiatric interview for children:
Agreement between child and parent in individual symptoms.
Journal of Abnormal Child Psychology,
10,
307–324.Google Scholar
Hinton, V.J.,
De Vivo, D.C.,
Nereo, N.E.,
Goldstein, E., &
Stern, Y.
(2001).
Selective deficits in verbal working memory associated with a known
genetic etiology: The neuropsychological profile of Duchenne muscular
dystrophy.
Journal of the International Neuropsychological Society,
7,
45–54.Google Scholar
Hockey, G.R.
(1997).
Compensatory control in the regulation of human performance under
stress and high workload: A cognitive energetical framework.
Biological Psychology,
45,
73–93.Google Scholar
Hughes, C.,
Dunn, J., &
White, A.
(1998).
Trick or treat?: Uneven understanding of mind and emotion and
executive dysfunction in hard-to-manage preschoolers.
Journal of Child Psychology and Psychiatry,
39,
981–994.Google Scholar
Kadesjö, B. &
Gillberg, C.
(2001).
The comorbidity of ADHD in the general population of Swedish
school-age children.
Journal of Child Psychology and Psychiatry,
42,
487–492.Google Scholar
Kalff, A.C.,
Kroes, M.,
Vles, J.S.H.,
Bosma, H.,
Feron, F.J.M.,
Hendriksen, J.G.M.,
Steyeart, J.,
van Zeben, T.M.C.B.,
Crolla, I.F.A.M., &
Jolles, J.
(2001).
Factors affecting the relationship between parental education as
well as occupation and problem behavior in Dutch 5- to-6-year-old
children.
Social Psychiatry and Psychiatric Epidemiology,
36,
324–331.Google Scholar
Kroes, M.,
Kalff, A.C.,
Steyaert, J.,
Kessels, A.G.H.,
Feron, F.J.M.,
van Someren, A.J.W.G.M.,
Hurks, P.P.M.,
Hendriksen, J.G.M.,
van Zeben, T.M.C.B.,
Rozendaal, N.,
Crolla, I.F.A.M.,
Jolles, J.,
Troost, J., &
Vles, J.S.H.
(2001).
Child psychiatric diagnoses generalized to a population of Dutch
school children aged 6 to 8 years.
Journal of the American Academy of Child and Adolescent
Psychiatry,
40,
1401–1409.Google Scholar
Korn, E.L. &
Graubard, B.I.
(1999).
Analysis of Health Survey.
New York:
Wiley Interscience.
Kortenbout van der Sluijs, M.J.,
Levita, D.J.,
Manen, R., &
Defares, P.B.
(1993).
Amsterdams Diagnostisch Interview voor Kinderen en Adolescenten
(ADIKA) [Amsterdam Diagnostic Interview for Children and
Adolescents]. Lisse, The Netherlands:
Swets & Zeitlinger.
Kuntsi, J.,
Oosterlaan, J., &
Stevenson, J.
(2001).
Psychological mechanism in hyperactivity: I Response inhibition
deficit, working memory impairment, delay aversion, or something
else?
Journal of Child Psychology and Psychiatry,
42,
199–210.Google Scholar
Levy, F.,
Hay, D.A.,
McStephen, M.,
Wood, C., &
Waldman, I.
(1997).
Attention-deficit hyperactivity disorder: A category or a continuum?
Genetic analysis of a large-scale twin study.
Journal of the American Academy of Child and Adolescent
Psychiatry,
36,
737–744.Google Scholar
Mahone, E.M.,
Koth, C.W.,
Cutting, L.,
Singer, H.S., &
Denckla, M.B.
(2001).
Executive function in fluency and recall measures among children
with Tourette syndrome or ADHD.
Journal of International Neuropsychological Society,
7,
102–111.Google Scholar
Marakovitz, S.E. &
Campbell, S.B.
(1998).
Inattention, impulsivity, and hyperactivity from preschool to school
age: Performance of hard-to-manage boys on laboratory measures.
Journal of Child Psychology and Psychiatry,
39,
841–851.Google Scholar
Mariani, M.A. &
Barkley, R.A.
(1997).
Neuropsychological and academic functioning in preschool boys with
Attention Deficit Hyperactivity Disorder.
Developmental Neuropsychology,
13,
111–129.Google Scholar
McGee, R.,
Partridge, F.,
Williams, S., &
Silva, P.A.
(1991).
A twelve-year follow-up of preschool hyperactive children.
Journal of the American Academy of Child and Adolescent
Psychiatry,
30,
224–232.Google Scholar
McGuinness, D. &
Pribram, K.H.
(1980).
The neuropsychology of attention: Emotional and motivational
controls.
In
M.C. Wittrock (Ed.),
The brain and psychology.
New York:
Academic Press.
Mostofsky, S.H.,
Newschaffer, C.J., &
Denckla, M.B.
(2003a).
Overflow movements predict impaired response inhibition in children
with ADHD.
Perception and Motor Skills,
97,
315–331.Google Scholar
Mostofsky, S.H.,
Abrams, M.T.,
Schafer, J.G.B.,
Goldberg, M.C.,
Courtney, S.M.,
Calhoun, V.D.,
Kraut, M.A.,
Denckla, M.B., &
Pekar, J.J.
(2003b).
fMRI evidence that the neural basis of response inhibition is
task-dependent.
Cognitive Brain Research,
17,
419–430.Google Scholar
Oosterlaan, J. &
Sergeant, J.A.
(1996).
Inhibition in ADHD, aggressive, and anxious children: A biologically
based model of child psychopathology.
Journal of Abnormal Child Psychology,
24,
19–36.Google Scholar
Paule, M.G.,
Rowland, A.S.,
Ferguson, S.A.,
Chelonis, J.J.,
Tannock, R.,
Swanson, J.M., &
Castellanos, F.X.
(2000).
Attention deficit/hyperactivity disorder: Characteristics,
interventions, and models.
Neurotoxicology and Teratology,
22,
631–651.Google Scholar
Pennington, B.F. &
Ozonoff, S.
(1996).
Executive functions and developmental psychopathology.
Journal of Child Psychology and Psychiatry,
37,
51–87.Google Scholar
Pierce, E.W.,
Ewing, L.J., &
Campbell, S.B.
(1999).
Diagnostic status and symptomatic behavior of hard-to-manage
preschool children in middle childhood and early adolescence.
Journal of Clinical Child Psychology,
28,
44–57.Google Scholar
Prather, P.A.,
Sarmento, N., &
Alexander, A.
(1995).
Development of vigilance in preschoolers
[Abstract].
Journal of the International Neuropsychological Society,
1,
153.Google Scholar
Reich, W.
(2000).
Diagnostic Interview for Children and Adolescents (DICA).
Journal of the American Academy of Child and Adolescent
Psychiatry,
39,
59–66.Google Scholar
Rozendaal, N.
(1998).
Handleiding computer algoritme ADIKA.
Maastricht, The Netherlands:
Vakgroep Psychiatrie en Neuropsychologie, Universiteit
Maastricht.
Schneider, W. &
Schriffrin, R.M.
(1977).
Controlled and automatic human information processing: I. Detection,
search, and attention.
Psychological Review,
84,
1–66.Google Scholar
Sergeant, J.A.,
Oosterlaan, J., &
van der Meere, J.
(1999).
Information processing and energetic factors in attention
deficit/hyperactivity disorder.
In
C. Quay &
A. Hogan (Eds.),
Handbook of disruptive behavior disorders (pp.
75–104).
Plenum:
New York.
Slaats-Willemse, D.S.,
Swaab-Barneveld, H.,
de Sonneville, L.,
van der Meulen, E., &
Buitelaar, J.
(2003).
Deficient response inhibition as a cognitive endophenotype of
ADHD.
Journal of the American Academy for Child and Adolescent
Psychiatry,
42,
1242–1248.Google Scholar
Sonuga-Barke, E.J.S.,
Dalen, L.,
Daley, D., &
Remington, B.
(2002).
Are planning, working memory, and inhibition associated with
individual differences in preschool ADHD symptoms?
Developmental Neuropsychology,
21,
255–272.Google Scholar
Stuss, D.,
Murphy, K.J.,
Binns, M.A., &
Alexander, M.P.
(2003).
Staying on the job: The frontal lobes control individual performance
variability.
Brain,
126,
2363–2380.Google Scholar
Swaab-Barneveld, H.,
De Sonneville, L.,
Cohen-Kettenis, P.,
Gielen, A.,
Buitelaar, J., &
Van Engeland, H.
(2000).
Visual sustained attention in a child psychiatric population.
Journal of the American Academy of Child and Adolescent
Psychiatry,
39,
651–659.Google Scholar
Swanson, J.,
Castellanos, F.X.,
Murias, M.,
Lahoste, G., &
Kennedy, J.
(1998).
Cognitive neuroscience of attention deficit hyperactivity disorder
and hyperkinetic disorder.
Current Opinion of Neurobiology,
8,
263–271.Google Scholar
Van Grimbergen, I.,
Célestin-Westreich, S., &
Ponjaert-Kristofferson, I.
(1999).
Validering van ADIKA-IV (deel externaliserend gedrag) bij een
klinische populatie kinderen tussen 6 en 18 jaar [Validation of
ADIKA-IV (externalising part) in a clinical child population aged
6–18 years].
Paper presented at the second Flemish Congress of Child- and
Adolescent Psychiatry and Psychotherapy, Leuven, Belgium.
Verhulst, F.C.,
Koot, J.M., &
Van der Ende, J.
(1996).
Handleiding voor de CBCL (Child Behavior Checklist) [Manual for
the CBCL].
Afdeling Kinder- en Jeugdpsychiatrie, Sophia
Kinderziekenhuis/Academisch Ziekenhuis Rotterdam/Erasmus
Universiteit Rotterdam.

Comorbid diagnoses in population sample of cases with ADHD, borderline ADHD, and a mixture of other pathology
Descriptives of the diagnostic groups and group comparisons on behavioral measures

Go–no-go task (two upper left pictures), focused attention task (upper right), sustained and divided attention tasks (lower left). The lower right diagram depicts the timing between signals. In the go–no-go task an event rate is used and signal duration is 800 ms. The other tasks use a post response interval (PRI); stimuli remain on the screen until a response is given. The tasks use a 500 ms warning signal (+), except the sustained attention task.
Speed, speed fluctuation, and accuracy of processing as a function of group classification and task type. BS = baseline speed, GNG = go–no-go, FA = focused attention, DA = divided attention, SA = sustained attention, GNG–mi/fa = misses/false alarms GNG.

P-levels <.10 for simple contrasts with ADHD as the reference group, per task, per type of score

Tempo and accuracy during sustained attention with time-on-task (Block 1–Block 4), overall fluctuation and effect of feedback on response latency. 1 = first 25% of trials,…, 4 = last 25% of task trials.
 You have
Access
- 47
- Cited by