Introduction
In the framework of climate change and the melting of Arctic sea ice, now well documented, scenarios of developing Arctic shipping emerged anew, echoing the European projects of the 16th–19th centuries to discover a shorter route to Asia, or more recently the Manhattan project to develop a commercially viable tanker route across the northwest passage, all ill-fated. Only in the USSR, by dint of huge investment in Arctic ports and heavy icebreakers in the framework of a planned economy, did Arctic shipping develop before the effects of climate change. Now, every summer when the official statistics about the decline of the sea ice are published, the media repeat the oncoming age of Arctic shipping, an idea resting, often without any deeper analysis (Lasserre Reference Lasserre and Lasserre2010), on the fact that Arctic routes are much shorter than through Suez or Panama between northern Europe and northern Asia, and that, therefore, they would automatically attract shipping firms. The melting of sea ice did not merely reactivate ancient ambitions about transportation in the Arctic, but immediately proved to bear a political issue, as the growth of shipping in the region underlines the question of what the status of the northwest and northeast passages will be (Byers Reference Byers2009; Lasserre Reference Lasserre and Lasserre2010): international straits, as claimed by the United States or the European Union? Or internal, and thus subject to their sovereignty, as claimed by Canada and Russia? Neutral, if ships navigate across the Arctic Ocean? The question of the development of Arctic shipping remains controversial as expert analyses do not converge (Howell and Yackel Reference Howell and Yackel2004; Gedeon Reference Gedeon2007; Loughnane Reference Loughnane2009; Lasserre Reference Lasserre and Pelletier2011).
It is in this context of renewed interest, that models have been designed to attempt to assess the economic feasibility of commercial shipping along Arctic routes. The issue proves not to be technical: with powerful icebreakers and, more recently, the advent of double-acting ships (DAS), navigation across ice that becomes thinner and thinner and sees multiyear ice melt, is no longer an engineering difficulty, but rather a business case problem (Niini and others Reference Niini, Kaganov and Tustin2007; Lasserre, Reference Lasserre and Lasserre2010b). Several models tried to address the following question: to what extent would shipping in these waters be profitable?
These models, published between 1991 and 2012, are analysed in this paper. They reveal the difficulty of defining credible parameters to build up a model that could assess the profitability of Arctic shipping. The author has also attempted to construct his own so as to feed the discussion. The objective of this article is to discuss the strengths and weaknesses of these models and the reliability of their assessments on the profitability of Arctic shipping, and to capitalise on their teachings to set up a new model that would take into account market issues.
Throughout the paper the following abbreviations are employed: NWP - northwest passage, NEP - northeast passage, P&I – protection and indemnity insurance, H&M – hull and machinery insurance, TEU – twenty foot equivalent unit (this is the unit used to count containers), PC – polar class, NYK Nippon Yusen Kaisha (Japanese shipping line), DNV – Det Norske Veritas (a ship classification society), UNCTAD – United Nations Conference on Trade and Development. All currencies are US$. Volumes where cited as ‘gal’ are US gallons.
Several models describe the economics of Arctic shipping
Even before climate change effects were widely discussed, studies had been undertaken to assess the feasibility of developing shipping along the northern sea route (NSR). Echoing Soviet attempts at revitalising the seaway, following President Mikhail Gorbachev's Murmansk initiative of 1 October 1987, several research projects tried to evaluate the technical and economic feasibility of developing international commercial shipping. The idea was all the more rational as, in contrast with the northwest passage where traffic was next to nil, the USSR had developed an series of active commercial ports and a busy seaway along the Siberian coast that rested on the escort of many powerful nuclear and diesel icebreakers. The western part of the route, between Murmansk and Dickson, was even open to year-round navigation after 1980 (Mulherin Reference Mulherin, Eppler, Proshutinsky, Proshutinsy, Farmer and Smith1996). In particular, the INSROP (International Northern Sea Route Programme) was a six year (June 1993–March 1999) international research programme designed to assess the economics of the NSR, a project that, besides Russia, interested Japan and Norway very much. Wergeland's studies (Reference Wergeland, Ivanov, Isakov, Batskikh, Høifødt, Nilsen, Armstrong, Østreng and Jørgensen–Dahl1991, Reference Wergeland1992) were also early attempts at assessing the business potential of the NSR. But the collapse of the Soviet Union in 1991 led to the rapid decline of economic activity along the NSR, and no follow-up of these early research models. Some of the models analysed are indeed reflections of research programmes that were carried on since the early 1990s to assess the feasibility and profitability of shipping in the Arctic. These research programmes include INSROP (1993–1999, mainly funded by Japan, Norway and Russia, studying the NSR); Ice Routes - The Application of Advanced Technologies to the Routing of Ships through Sea Ice (1997–1998, European Union); ARCDEV – Arctic Demonstration and Exploratory Voyages (1997–1999, European Union, studying the western Russian Arctic seas); ARCOP – Arctic Operational Platform (2002–2006, European Union, studying the NSR); Northern Maritime Corridor (2002–2005, European Union, Norway and Russia, studying the North, Barents and Kara Seas); JANSROP (2002–2005, Japan, studying the NSR); Canadian Arctic Shipping Assessment (2005–2007, Canada, studying the Canadian Arctic waters); AMSA - Arctic Marine Shipping Assessment (2006–2008, initiated by the Arctic Council, considering the whole Arctic). Research thus largely emphasised the NSR as a potential transit route and gateway to Russian resources.
General portrait of the models considered
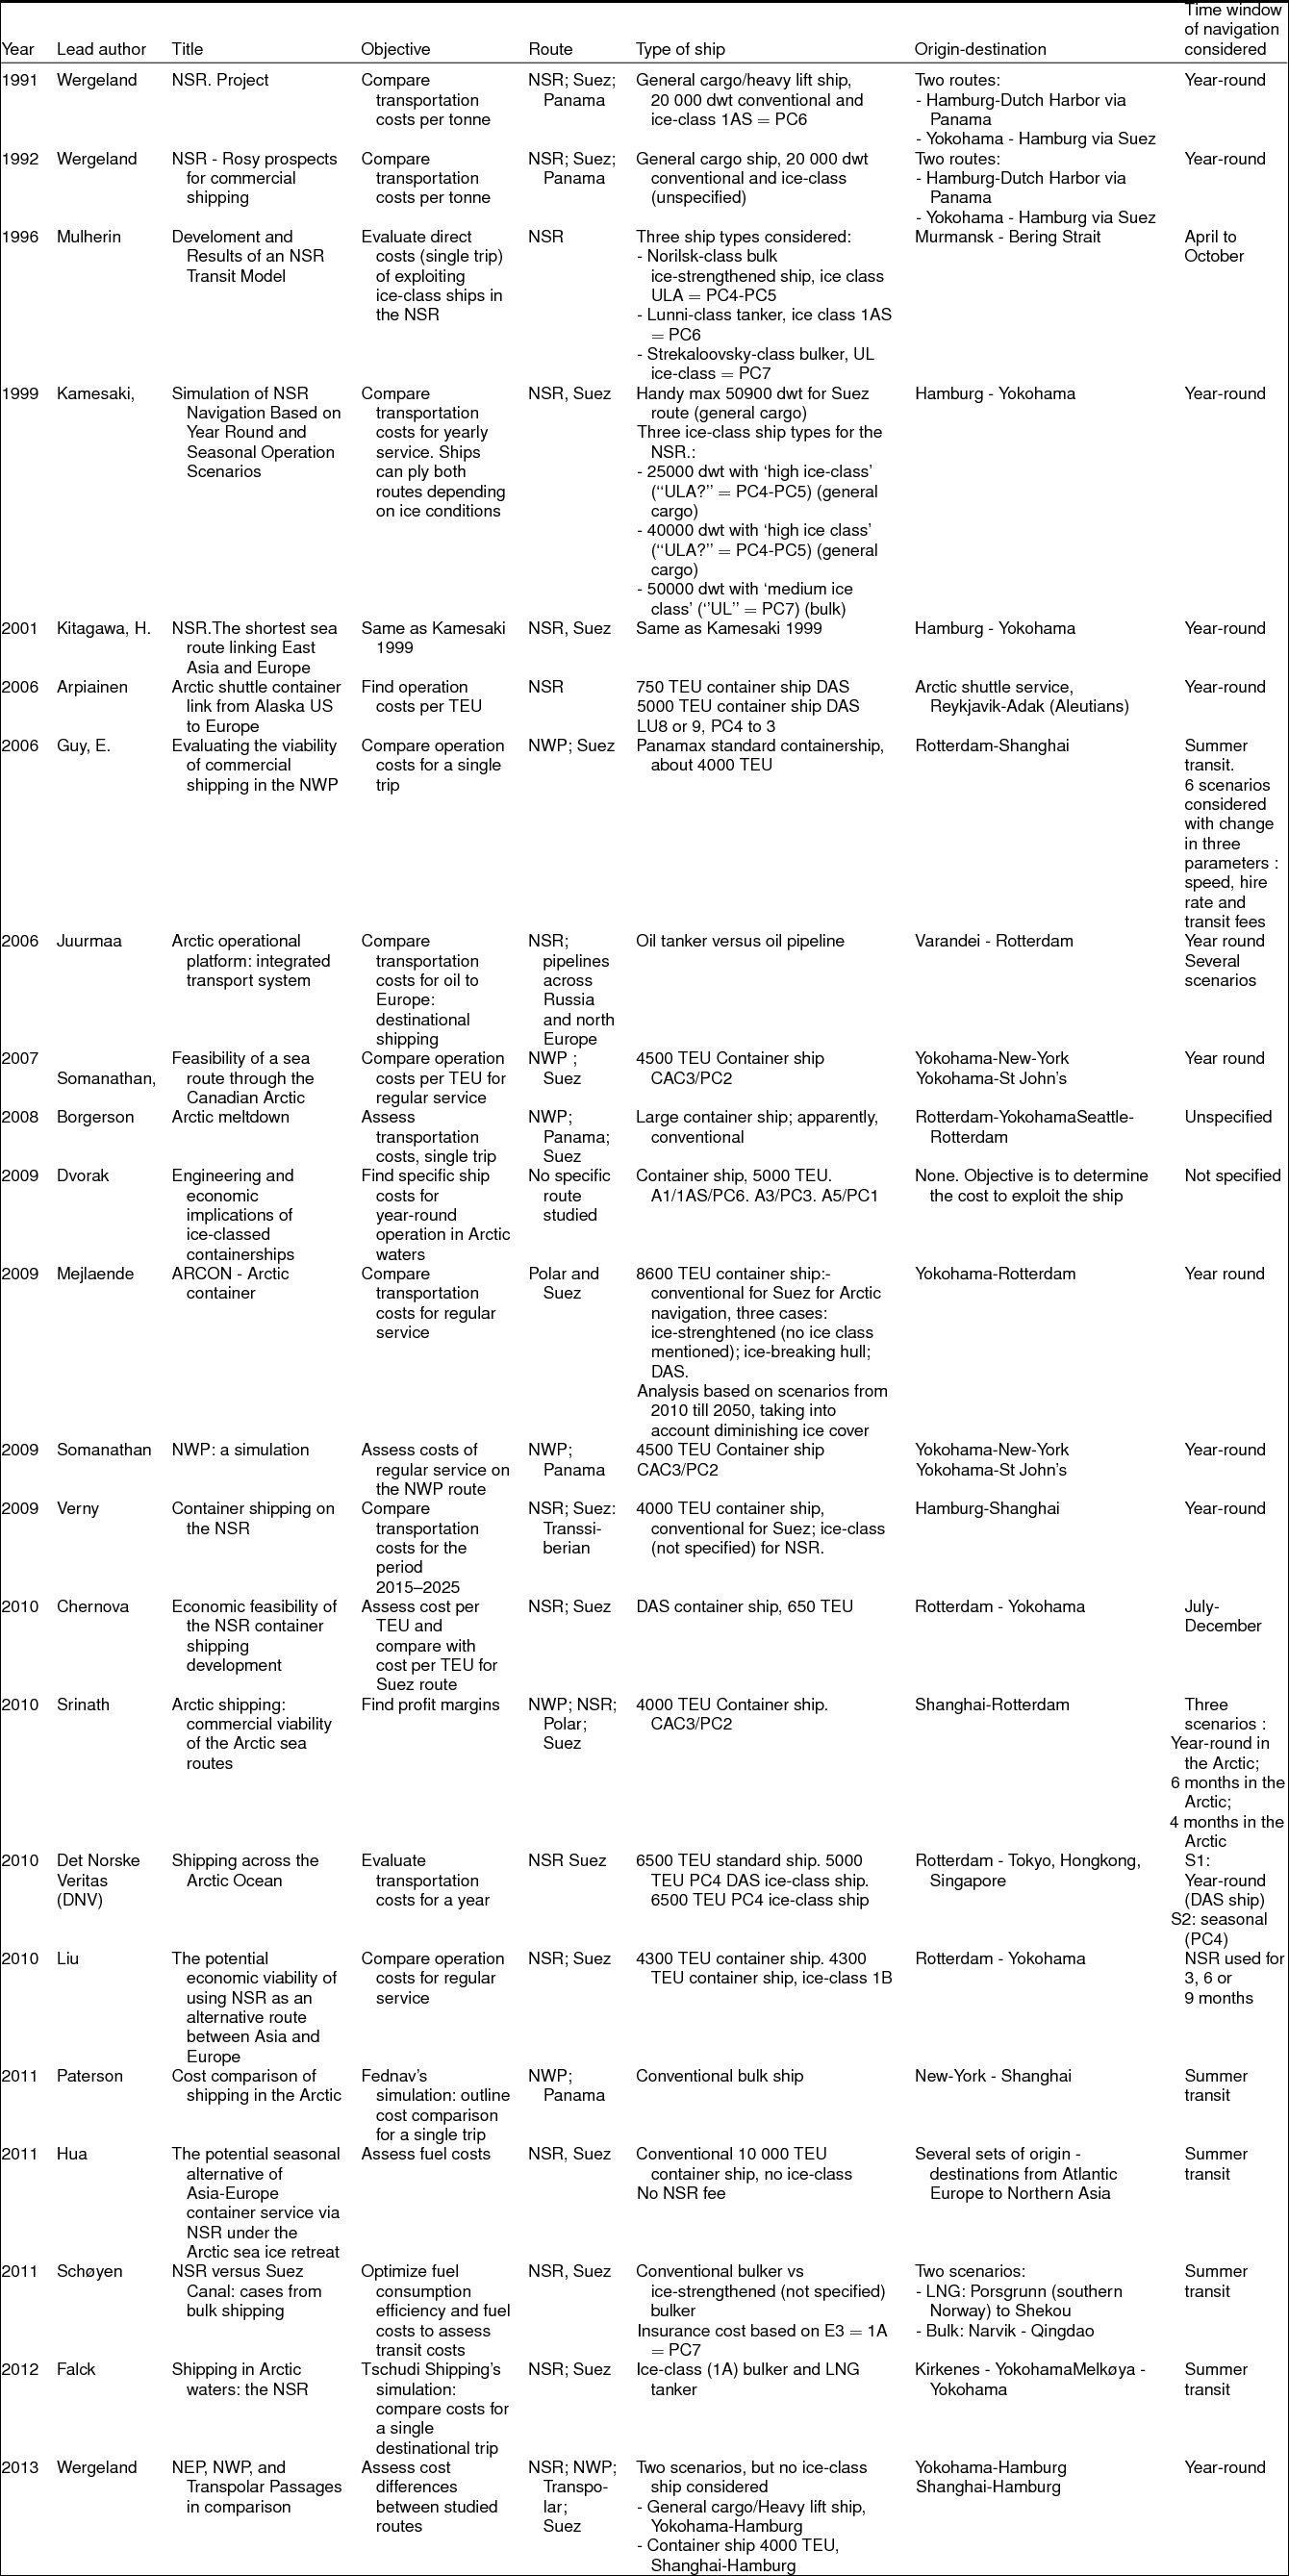
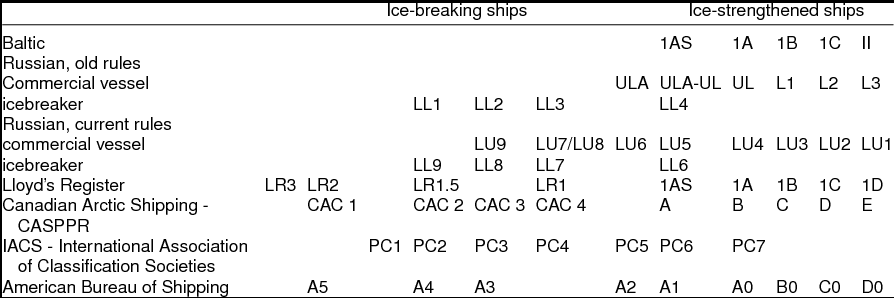
Climate change renewed interest in modeling Arctic shipping. 23 simulations have been identified and analysed: 9 articles from journals; 8 technical reports; 1 book chapter; 2 communications and 3 master's theses. They were published between 1991 and 2012, but 18 were published in or after 2006, attesting to the renewed interest in Arctic shipping in the climate change context. Two tackle destinational traffic (that is shipping going to/from the Arctic for the exploitation of natural resources: Juurmaa Reference Juurmaa2006 and Falck Reference Falck2012), while the 21 others are interested in transit shipping. The majority display the study of container traffic (15); seven address bulk shipping (LNG, tanker, dry bulk), and four are interested in general cargo. Four studies did not consider ice-class vessels; five simulated an ice-class vessel without specifying which class. One considered a 1B ice-class vessel; 5 either a 1A (PC7) or a 1AS (PC6) ice-class; one seemed to consider a PC5 vessel, and 8 envisaged a PC4 vessel or higher. 3 models considered DAS ships. These are in the Baltic ice-class system; for equivalences, see Annex 1.
Reflecting both the early development of traffic along the NSR and the presence of infrastructure to facilitate present shipping (ports, numerous icebreakers), most tackle the profitability of shipping in the NSR (18); 7 consider the northwest passage (NWP), three the transpolar route across the heart of the Arctic Ocean, and one does not specify any Arctic route. When they establish comparisons, the articles compare these Arctic sea lanes with the Suez route (16), Panama (5) and the Trans-Siberian rail link (1) (Table 1).
Models of Arctic shipping considered for the review

Main parameters used in the models: discrepancies and similarities
It is interesting to stress that the parameters used by the authors of the models differ widely, and not only for the type and ice-class of the ships considered.
For instance, fuel costs are the largest single cost factor according to all simulations. Probably for simplification reasons, the fuel consumption rate, in 14 models, is considered the same for Arctic and southern routes, whereas 7 models underline that rates are different, either because a limited speed entails a lower consumption rate, or because progressing across ice calls for more power and thus consumes more. These two parameters (type of fuel used and consumption rate) are very important, as fuel costs are the largest single operational cost, among direct costs (thus excluding general management costs but including operational and depreciation costs), they range from 36.7% (Verny and Grigentin Reference Verny and Grigentin2009) to 54.2% (Schøyen and Bråthen Reference Schøyen and Bråthen2011), 54.3% (Chernova and Volkov Reference Chernova and Volkov2010), 56% (Dvorak Reference Dvorak2009) and 61% (Srinath Reference Srinath2010). Models are thus very sensitive to the two parameters of bunker cost (independent from the author) and the average speed and consumption rate, which the author must determine, a sensitivity that several authors recognise (Guy Reference Guy2006; Somanathan Reference Somanathan, Flynn and Szymanski2009; Chernova and Volkov Reference Chernova and Volkov2010; Wergeland Reference Wergeland and Østreng2013).
All models depicting year-round Arctic navigation consider that the same type of fuel will be used in summer as in winter, usually IFO 380. In fact, IFO 380 may be widely used but it is not well-suited for very cold temperatures that will keep prevailing in winter in the Arctic. The Canadian Coast Guard requests naval distillate fuel (NATO code F75) for all its Arctic operations; in winter the CCG uses P50 as its freezing point is much lower. At Eureka Base, the fuel used for the generators is P60 with an even lower freezing point. It is therefore unlikely that shipping companies could use ships with classical IFO 380 during winter navigation (Ouellet Reference Ouellet2011; MacLeod Reference MacLeod2012). This element is important as prices reflect the specialisation of the fuel: in early October 2012, IFO 380 was worth 2.43$/gallon; naval distillate 3.267$/gal; and P50 3.322$/gal (+36,7% over IFO380). Simulations implying shipping in winter usually using the same fuel as in winter therefore underestimate the cost of fuel by a large margin.
The average cruise speed of a commercial ship differs also widely depending on the model. For year-round navigation, three models suggest an average speed between 7 and 11 kts; six consider the average speed will be between 11 and 13 kts; two opt for an average speed between 13 and 15 kts, and one estimates on an average speed of 17 kts (Verny and Grigentin Reference Verny and Grigentin2009). For summer shipping, one study has a speed slower than 10 kts; two consider the speed between 11 and 13 kts; one between 13 and 15 kts, and 3 above 15 kts (up to 25.8 kts with Hua and others Reference Hua, Yin, Jia, Jin and Ouyang2011). The difference between these models is striking, as authors modeling a summer transit do not present us with an average speed much higher than for year-round traffic, whereas it is difficult to envisage rapid transits across Arctic passages in the winter time given the prevalence of thick one-year ice, if not multiannual. As for summer navigation, it is debatable that commercial ships can achieve average speeds greater than 15 kts, not merely because of drifting ice, but also because of increasingly prevalent fog and, for the NWP, the increasing density of icebergs in Baffin Bay and lack of accuracy of charts within the Canadian archipelago (Lasserre Reference Lasserre and Lasserre2010a, Reference Lasserre and Lasserre2010c).
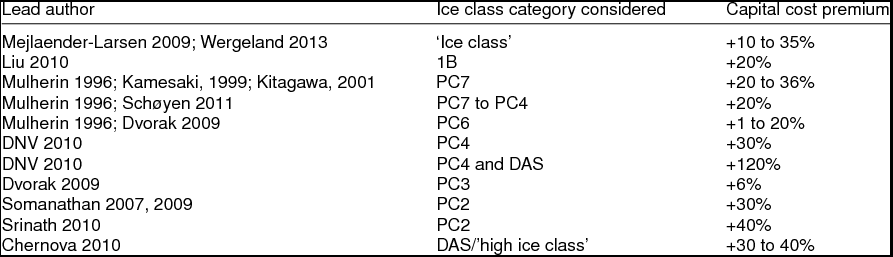
The estimates for the increased capital cost for the construction of an ice-class ship vary widely. For Arctic shipping, Laulajainen (Reference Laulajainen2009) estimates increased capital costs at 70 to 100%, a figure that seems high when compared with the models considered. In Table 2 are displayed the spectrum of values for capital cost premium for an ice-class commercial ship, with a similar capacity as the benchmark vessel, set forth among the models.
Estimates of capital cost premium for a commercial ice-class ship depending on the class, from the selected simulations.
One study (Hua and others Reference Hua, Yin, Jia, Jin and Ouyang2011) considers there will be no NSR fees, a daring assumption given Russian intent to use the NSR toll precisely to finance the maintenance of its Arctic icebreaker fleet. Eight models rest on the same cost structure for the crew, assuming wages and advantages are similar as crews operating along classic routes, whereas six mention there definitely is a need for a well-trained crew for Arctic shipping, and thus either imply or explicitly mention that crew costs are higher: experienced crews command a higher salary if the employer wants to make sure the firm will retain their services.
Insurance premiums are also the object of a wide range of estimates. Three models rely on no insurance premiums. One mentions a cargo insurance premium of 50% over standard tariffs. Three models suggest global insurance costs may be between 75% and more than 100% higher than regular fees. For P&I, insurance that covers third party liabilities encountered in the commercial operation of vessels, premiums vary from 16.7%, 25% (two), 43% 50% (three) and 100%; for H&M, (insurance protection for damage done to the ship itself or the equipment which forms part of it) premiums display a range between 25% (two), 50% (three) and 100% (three). Arpiainen and Kiili (Reference Arpiainen and Kiili2006) quote 800$/day as the average insurance cost for a ship plying Arctic waters year-round, whereas Somanathan (Reference Somanathan, Flynn and Szymanski2009) sets this cost at 1746 $/day, Wergeland (Reference Wergeland and Østreng2013) at 1150 $/day for a containership along the NSR, and Verny and Grigentin (Reference Verny and Grigentin2009) at 3344 $/day. Clearly, such a wide range of cost estimates underline the degree of uncertainty of these models.
We contacted several insurance companies and among the factors considered for the risk assessment and thus the rate, is the experience of the crew in Arctic shipping; the availability of rescue units (icebreakers or else); the distance to a port in case of damage; the ice class of the ship and the prevalence of fog and ice along the route considered. These factors indicate higher premiums along the NWP as the NSR boasts intermediate ports (Varandei, Amderma, Dickson, Tiksi, Pevek, Provideniya), more icebreakers, less drifting ice and fewer icebergs and growlers, because land glaciers that calve icebergs when entering the sea on Novaya Zemlya, Severnaya Zemlya and Zemlya Frantsa-Iosifa are much smaller than those of Greenland and Ellesmere Island (Dowdeswell and Hambrey Reference Dowdeswell and Hambrey2002: 95–96).
A diversity of models and conclusions
The models are of diverse quality and purpose. Borgerson (Reference Borgerson2008) uses his very synthetic simulation to illustrate his idea that the NWP will witness a traffic explosion, but he does not disclose his sources and his reasoning rests on a debatable hypothesis that ships will navigate the NWP with the same speed as along southern sea lanes. Paterson (Reference Paterson2011) and Falck (Reference Falck2012) displayed simplified simulations in the frame of more general presentations. Juurmaa (Reference Juurmaa2006), Mejlaender-Larsen (2006) and DNV (2010) do not disclose many details. But simulations from authors like Kitagawa (Reference Kitagawa2001), Verny and Grigentin (Reference Verny and Grigentin2009), Somanathan (Reference Somanathan, Flynn and Szymanski2009), Srinath (Reference Srinath2010), Liu and Kronbak (Reference Liu and Kronbak2010) and Wergeland (Reference Wergeland and Østreng2013) offer detailed and accounted for hypotheses with several parameters.
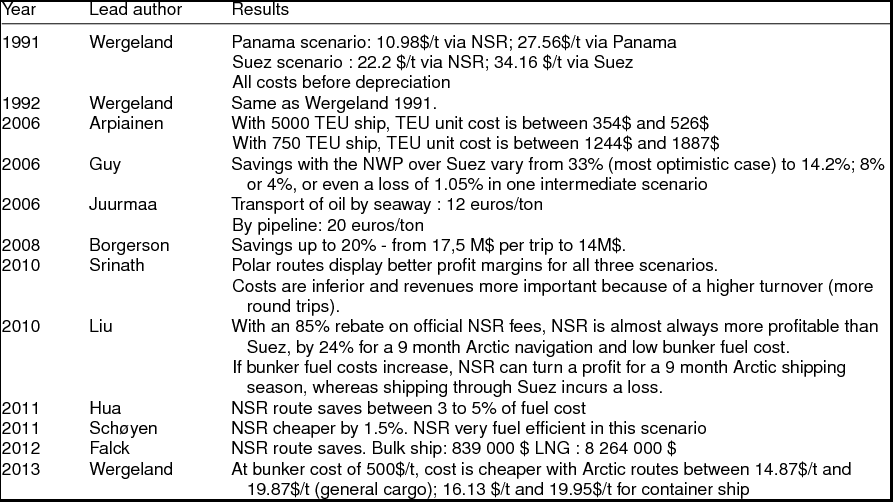
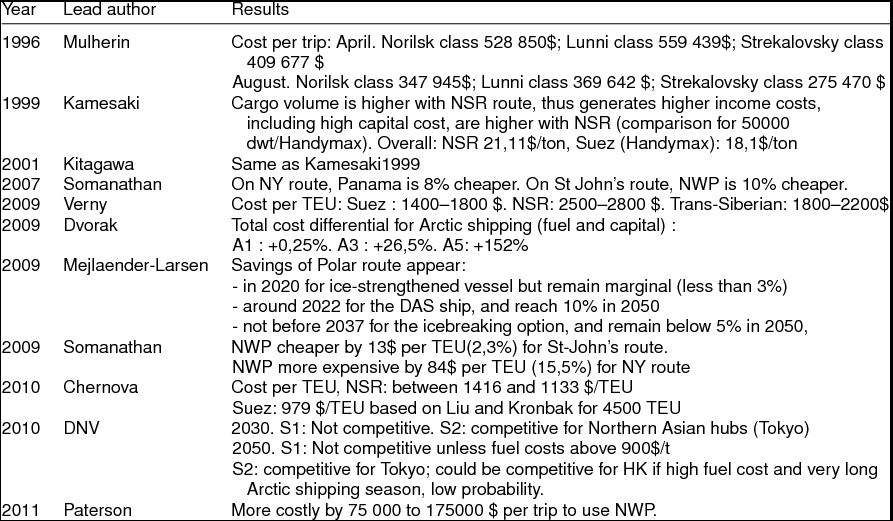
Given all the parameters involved, 13 models conclude that Arctic routes can be profitable for commercial shipping in the short term; five are more ambivalent or do not take a position, and five conclude that conditions are difficult for a profitable exploitation of these routes (Tables 3, 4).
Conclusions of the simulations that conclude Arctic routes are profitable
Conclusions of the simulations that conclude Arctic routes are not or may not be profitable.
However, as for any model, the conclusions must be handled with care. Arpiainen and Kiili, who conducted the simulation for Aker Arctic (2006), reach an overall direct cost of 354$/container on the route Iceland-Aleutians through the NSR. Combining this cost with the two transhipments Europe-Iceland and Aleutians-Asia (figures not provided), they conclude that the three segment route between Europe and Asia is profitable, but they do reckon many variables are not accounted for in the model (Arpiainen and Kiili Reference Arpiainen and Kiili2006: 28).
Guy studies the NWP under several scenarios, based on the charter cost of the ship, transit duration and possible transit fees. His calculations show that the transit through the NWP may be potentially profitable, but he underlines optimal conditions must be met: rapid transit speed; low transit fees (it is free now but this goes with the scarcity of services along the NWP); and limited premiums for Arctic shipping (ice-class ship; crew; insurance; maintenance) (Guy Reference Guy2006: 13).
The general conclusion that seems to emerge from these models is that direct costs are lower for transit shipping using Arctic routes. However, as hinted to by a few authors, the models are by definition simplifications of the reality and do not take into account all variables, and sometimes oversimplify them. They rest on simplifications of the cost structure (structural limitation) and, for most, on the choice to focus on cost issues. For instance, they never consider general cost issues like the twice yearly redesign of schedules a seasonal use of Arctic routes implies for container shipping; they rarely consider marketing issues like the load factor, and never the risk-aversion that characterises liner shipping regarding the risk of delays because of unpredictable drifting ice, especially at the beginning and the end of potential Arctic shipping seasons, as repeated delays would entail significant financial penalties (cost dimension) and damaged credibility (marketing dimension) (see Lasserre and Pelletier Reference Lasserre2011 on these perception issues). One simulation, for instance, posits the same speed for summer transit across the NSR; the absence of NSR tariffs; and does not consider other costs. No surprise it then concludes the NSR is profitable – but what did it test? (see Hua and others Reference Hua, Yin, Jia, Jin and Ouyang2011)
Some of these factors, especially the potential costs of commercial risks such as delays, are difficult to factor in in quantitative models. However, the author considered that it was possible to tailor another simulation that would capitalise on the knowledge accumulated through two decades of Arctic transit shipping modeling, and that would also try and take into account marketing constraints like the location of intermediate markets, reflected in the load factor, constraints repeatedly underlined by shipping firms (Lasserre and Pelletier Reference Lasserre and Pelletier2011).
Designing a simulation drafting on past models
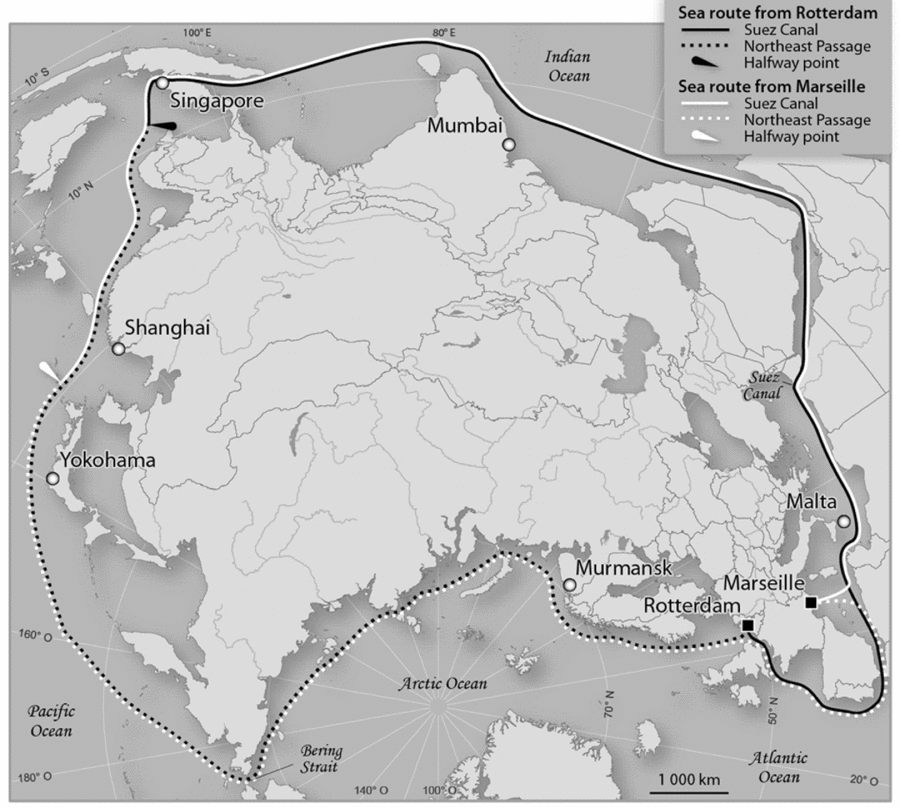
So as to capitalise on these scenarios, it is proposed to establish another simulation. As all models, it is prone to simplifications and works with estimates. I designed a scenario modelling a 4500 TEU containership based in Rotterdam and servicing Shanghai or Yokohama through the NSR or the NWP, competing with a similar ship going through Suez and stopping over at three intermediate ports, Malta, Mumbai and Singapore. Choosing a more southern destination is irrelevant, for then the distance across Arctic routes tends to surpass distances along the Suez route, depending on the origin point (see Fig. 1).
Halfway point for sea routes along the NEP and across the Suez Canal, from Rotterdam and Marseille.
The first scenario considers summer shipping for a 6-month shipping season (an optimistic scenario given the present state of sea ice in spring and autumn), and a regular ship compared with an ice strengthened 1AS-class ship (Baltic classification system) plying the NSR. The second scenario is similar but the northern ship crosses the NWP. The third scenario displays year-round shipping across the NWP, with a heavy northern ship Polar Class 4 (IACS classification system; see Annex 1), similar in ice strengthening as the bulk ships used by Fednav to service Canadian mines in Labrador and northern Quebec, the MV Arctic and the MV Umiak 1 (Nunatsiaq Online 2012). The goal of the simulation is to sketch an approximate cost of operation per transported TEU. The fourth scenario displays a 1AS ship crossing the NSR year-round: this is technically possible given the escort service provided by the Russian icebreakers.
I opted for an approach based not on the calculation of costs on a single leg: given the shorter distance, it is quite possible that these are lower than for the Suez route, although that must be checked. Such an approach emphasises a direct cost analysis per trip (as used by authors like Wergeland or Mulherin and others) but neglects the revenue issue: to what extent can a ship plying Arctic passages convert shorter distances into more revenue and/or, with lower costs, a higher profit? As a proxy for this question, I decided to study the direct costs compared with revenue-generating cargo over a whole season, or a complete year. Several authors already opted for such a methodology (Verny and Grigentin Reference Verny and Grigentin2009; Somanathan Reference Somanathan, Flynn and Szymanski2009; Srinath Reference Srinath2010; Chernova and Volkov Reference Chernova and Volkov2010, Arpiainen and Kiili Reference Arpiainen and Kiili2006).
First scenario: Rotterdam-Asia across the NSR, summer navigation
Origin-destination
We first considered the couple Rotterdam-Shanghai, especially with regard to growing debate about China's interest in Arctic shipping. With the hypothesis of an average summer transit speed of 14 kts in the NSR, the distance Rotterdam-Shanghai is traveled in 20.6 days against 22.6 days via Suez with an average speed of 20 kts. We also considered Yokohama as a final destination, a more northerly port that favours the NSR over the Suez route. I also applied the model to the NWP.
NSR tariff
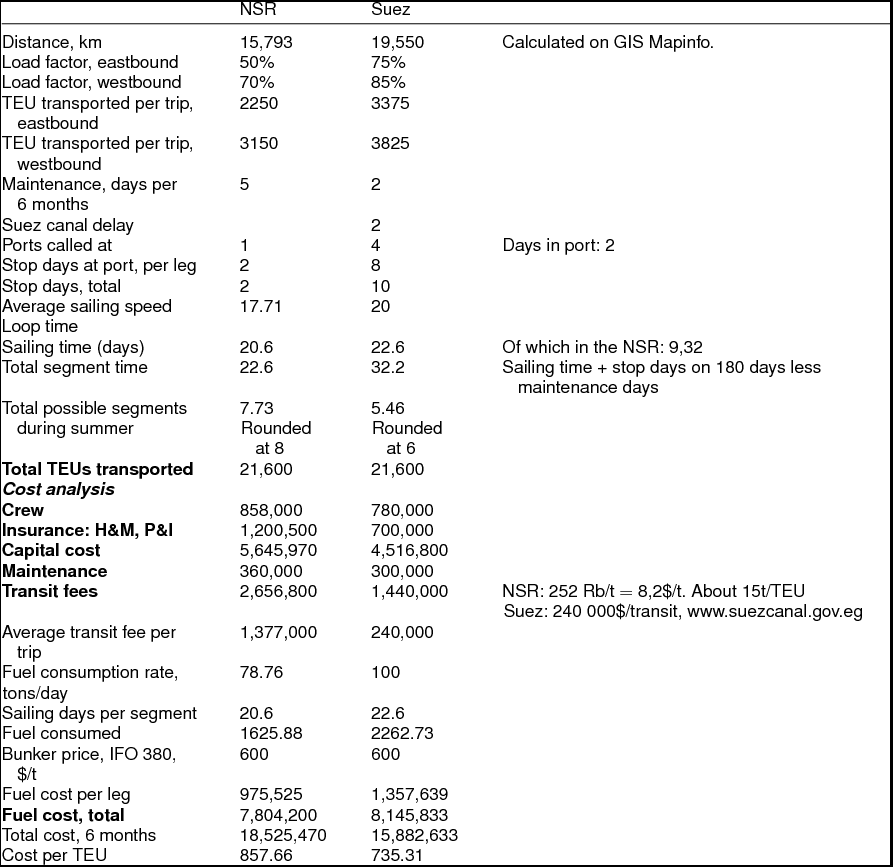
Obviously official tariffs are very restrictive for the NSR, especially for container cargo as the official rate (1048 Rb/ton, or 34$/t), is very high. Tschudi Shipping (Falck Reference Falck2012) claims it used the NSR with a tariff of 5 $/t for iron ore, but such a low tariff (170 Rb/t) is nowhere to be found in updated NSR tariffs, in which bulk cargo is rather priced at 707 Rb/t (NSR Administration 2011: it is likely Russian authorities negotiate ad hoc tariffs so as to be competitive, a hypothesis confirmed by Tschudi Shipping itself when asked about its case (Ulf Hagen, Managing Director, Tschudi Arctic Transit, personal communication, 23 October 2012). If such a policy induces a reduction in Suez traffic, it is likely that Suez Canal Authorities will lower their own tariffs so as to remain competitive. Falck also quotes the likely Suez fees at 180 000 $, but the Suez Canal authority online toll calculator gives a tariff of 90 000 $ (Suez Canal Authority 2012). Verny and Grigentin (Reference Verny and Grigentin2009) assume NSR tariffs are likely to remain double that of Suez, but this would already be an improvement over official tariffs. This assumption would be in line with the calculation I made about the Suez tariff in the Tschudi/Falck simulation. However, so as to reflect the adaptability and marketing efforts of Russian authorities, I established a variant scenario in which NSR tariffs for container cargo represent the same reduction as that applied for Tschudi Arctic Transit with bulk cargo: 252 Rb/t, or 8,2 $/t (Falck Reference Falck2012; NSR Administration 2012). Such a discounted tariff (76% discount from the official tariff) would be 38% above the official Suez rate, with a moderate hypothesis of an average container weight of 15 tons; (max. 28 t according to NYK (2012).
Load factor
Most models consider the market opportunities are the same for a ship stopping over at several busy ports along the Panama or Suez routes as for a ship loading only once: there are no intermediate ports in the Arctic. Several shipping firms mentioned this point during the survey we carried (Lasserre and Pelletier Reference Lasserre and Pelletier2011). So as to reflect this market reality, which none of the models considered tries to depict, and the fact that container traffic is much more sustained from Asia than to Asia (UNCTAD 2012: 23–24; Damas Reference Damas2012), I set the load factor at 85% (Asia to Europe) and 75% (Europe to Asia) for the Suez route, and 70% and 50% for the Arctic route.
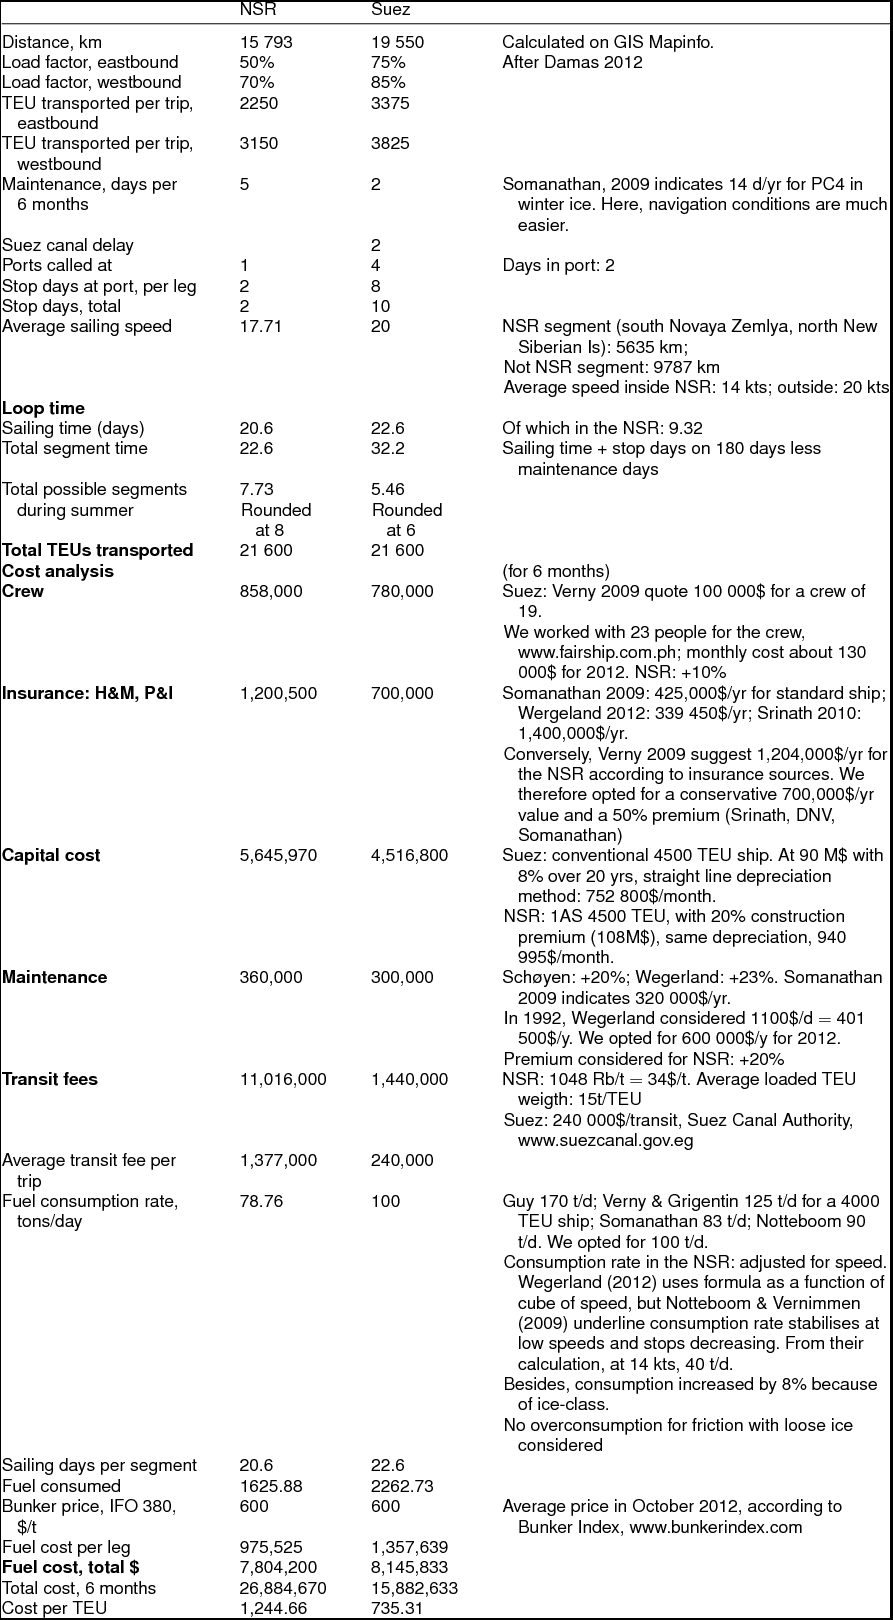
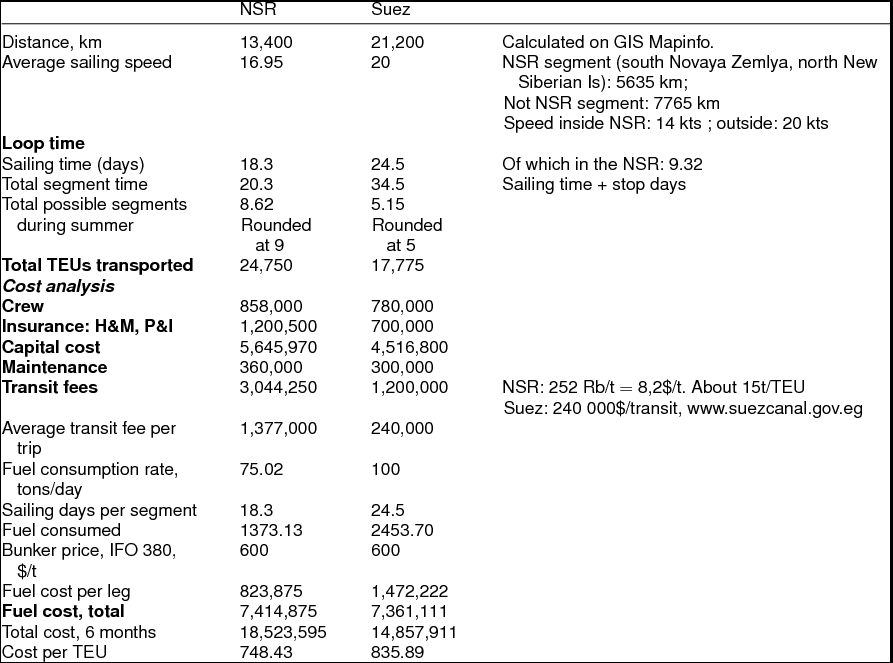
From this benchmark scenario, based on official NSR fees, it is apparent that:
Indeed the ship plying arctic waters can make more rotations, but not necessarily a lot more TEUs given the lower load factor,
Fuel consumption is much reduced per leg along the NSR. The total fuel cost may look similar, but this is because the ship plying the NSR route can make more rotations than the ship going through Suez and Malacca.
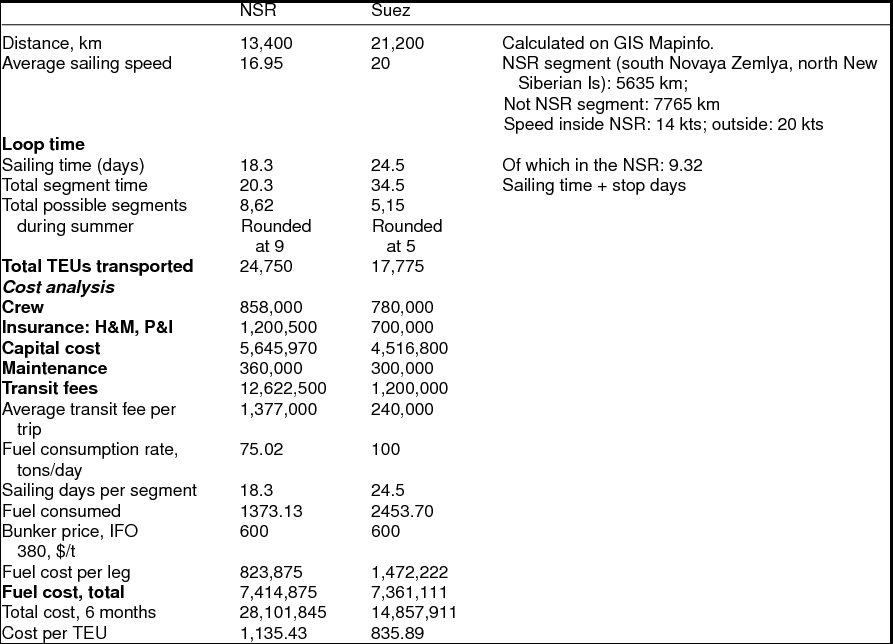
NSR tariffs make the NSR option largely unprofitable, as already mentioned by several firms (Lasserre and Pelletier Reference Lasserre2011) and confirmed by Hagen as already quoted (Table 5, 6).
First scenario, benchmark simulation. Summer transit with official NSR tariffs, Rotterdam-Shanghai. Period: 1 May – 1 November = 180 days
First scenario, benchmark simulation. Summer transit with official NSR tariffs, Rotterdam-Yokohama. Period: 1 May - 1 November = 180 days
Of course, this scenario is largely fictional as it appears that the NSR Administration is keen on offering attractive tariffs if the shipping company pledges to use the route on a regular basis, which is consistent with liner service. I therefore adapted the scenario to a situation where, as exposed above, NSR tariffs are much lower.
In this sub-scenario (Tables 7, 8), it appears that, despite a much discounted NSR tariff, the service to Shanghai is not competitive against a classical liner service through Suez; however, a service to Yokohama is, despite the lower load factor.
First scenario, summer transit with discounted NSR tariffs, Rotterdam-Shanghai. Period: 1 May – 1 November = 180 days
First scenario, summer transit with discounted NSR tariffs, Rotterdam-Yokohama. Period: 1 May – 1 November = 180 days
If the service across the NSR could manage a similar load factor as through Suez and Malacca, then the cost per TEU to Shanghai would drop to 674$, making it competitive against the classical route (8% cheaper), but this possibility, as discussed above, is seriously challenged by shipping firms themselves.
Fuel economies are often depicted as the main cost advantage of Arctic routes. The scenario works with the October 2012 IFO 380 cost of 600$/metric ton. If fuel cost was to increase to 1000$/t with the lower load factor constraint, then the total cost per TEU on the Shanghai route would be 1098.53$ with the NSR and 986,72$ through Suez, and thus remain uncompetitive: fuel cost is not, in itself, a factor so important as to be able to overcome market issues such as the load factor. This conclusion is still valid with the NWP scenario, see below.
Second scenario: Rotterdam-Asia across the NWP, summer shipping
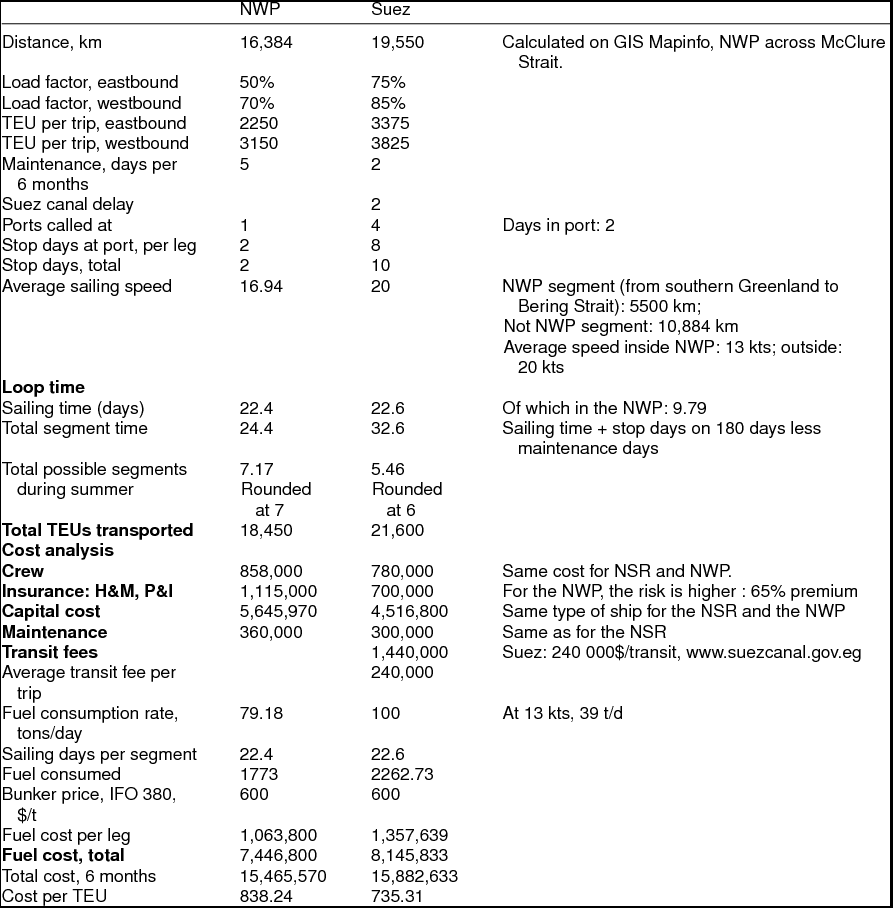
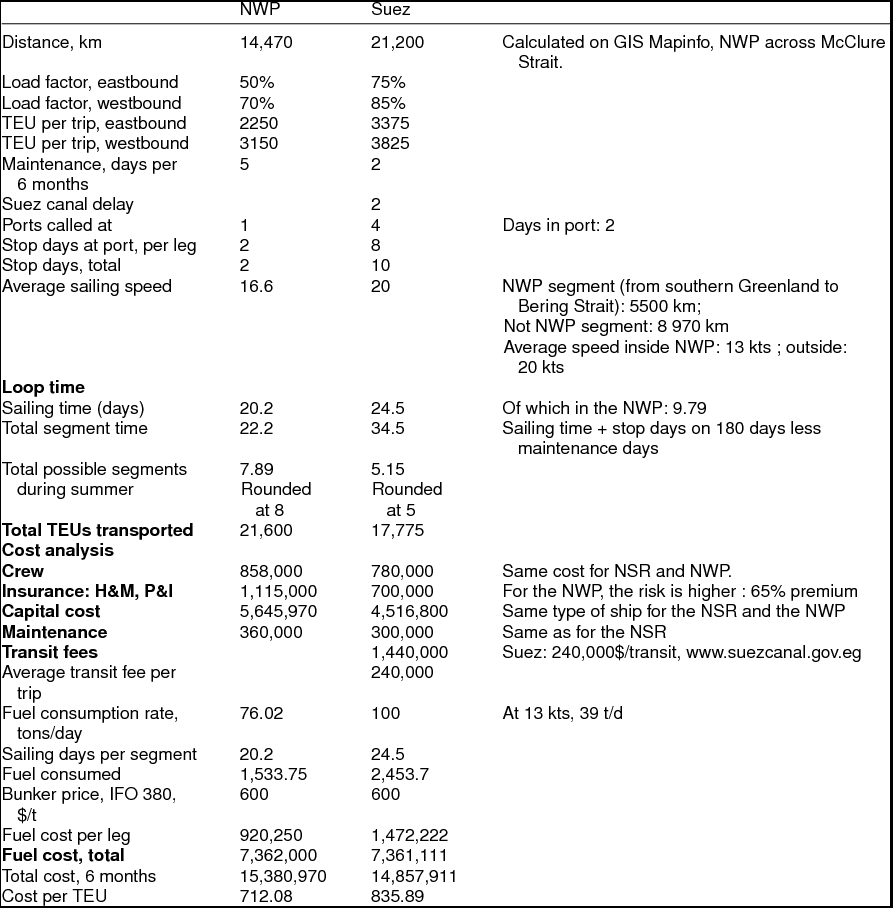
The second scenario examines summer shipping across the NWP. Most parameters remain the same. However, the distance is a longer than with the NSR; fog, icebergs and drifting ice are more prevalent than along the NSR (Lasserre Reference Lasserre and Lasserre2010) and contribute to reduce the average speed, 13 kts in this simulation in the NWP against 14 kts with the NSR, which is already optimistic for the present time given the fact the period considered lasts from May to November. There is still much ice in June; this factor as well as the absence of ports and of numerous icebreakers to assist in case of accident justify an increased insurance premium. However, I decided not to try and model the increased consumption due to friction with ice and considered that loose ice had a marginal impact on consumption rates (Tables 9, 10).
Second scenario, summer transit across the NWP, Rotterdam-Shanghai. Period: 1 May – 1 November = 180 days
Second scenario, summer transit across the NWP, Rotterdam-Yokohama. Period: 1 May - 1 November = 180 days
Despite the absence of tariffs (for the present time) on NWP transits, it appears a regular service between Rotterdam and Shanghai remains more costly to operate per TEU than via Suez and Malacca: more rotations are possible thanks to the route being shorter, but this advantage does not translate into more affordable costs per TEU since the load factor is lower for the Arctic route. If the load factor was the same as the Suez route, the cost per TEU would be 619 $/TEU, thus cheaper by 15.8% than the alternate route via Suez. The break-even point as regards the load factor could be, for instance, 61% on westbound legs (Europe to Asia) and 75% on eastbound legs (Asia to Europe), with a cost per TEU of 732.79$ compared to 735.31$.
A service to Yokohama, however, as with the NSR, displays much lower costs per TEU: it would be 14.8% cheaper despite the difference in load factor; with a load factor of 61/75%, the cost per TEU would drop to 628.31$ compared to 835.89$, thus 24.8% cheaper. However, if the average speed across the NWP dropped to 9 kts instead of 13 kts, then the cost per TEU would increase to 825.51 $, or just 1.2% cheaper than with the Suez route.
Third scenario: Rotterdam-Yokohama across the NWP, year-round shipping
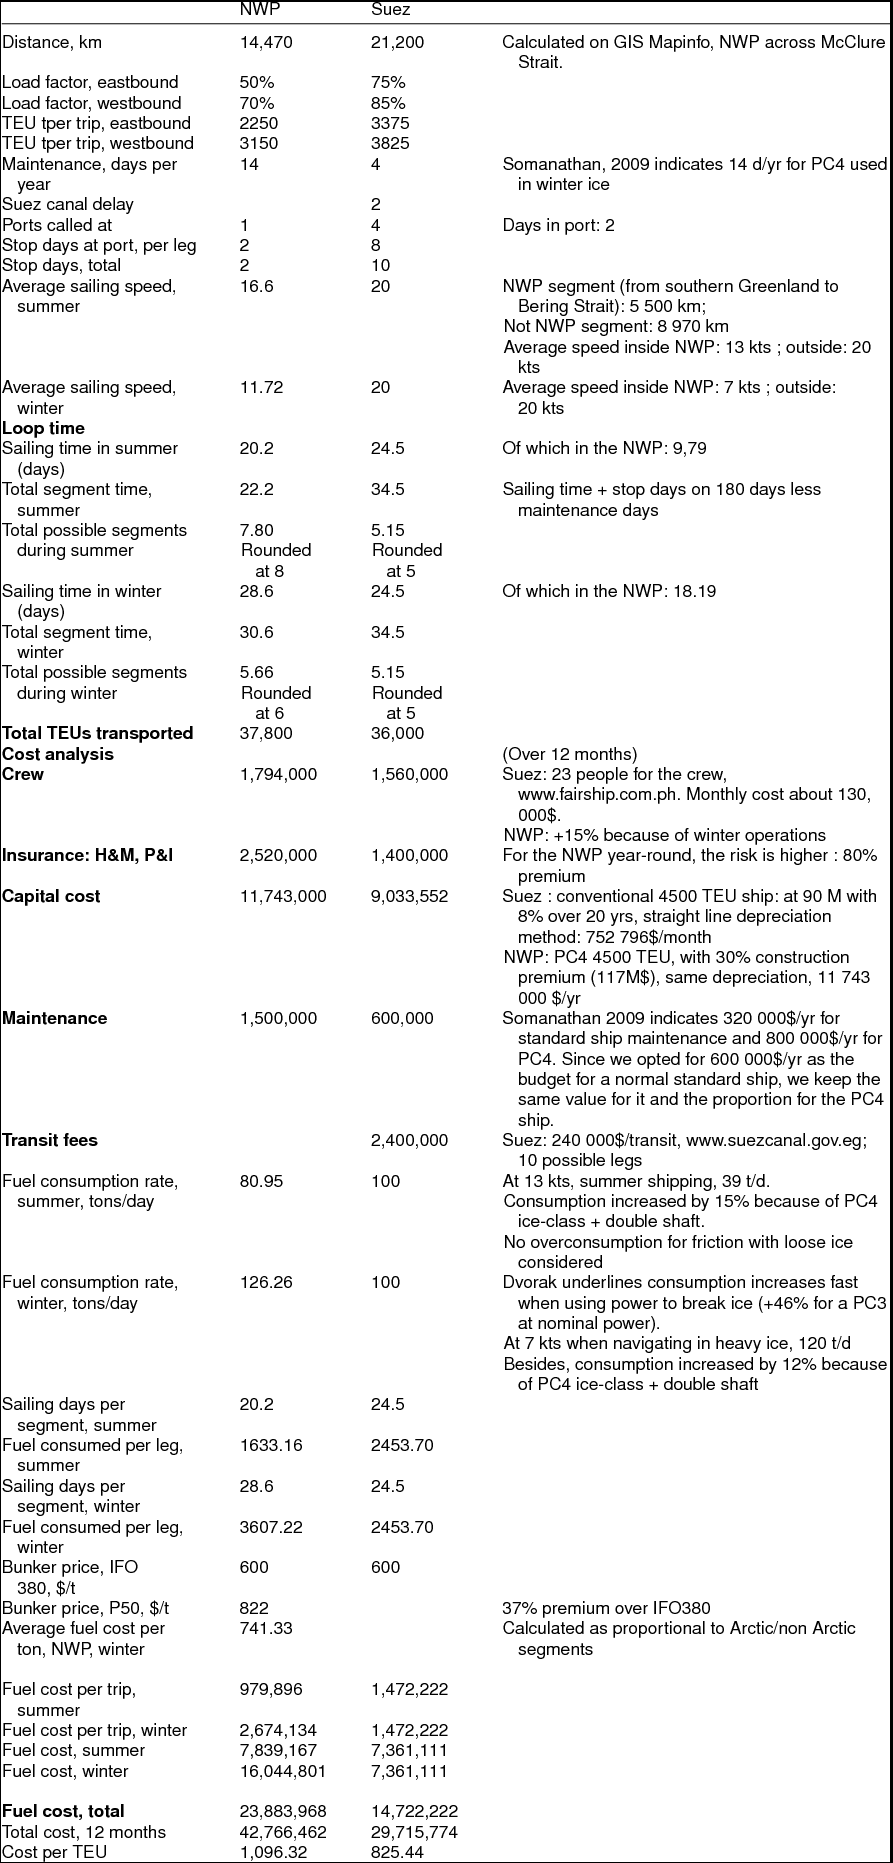
I also decided to test the assumption that year-round shipping could be profitable for a liner service across the NWP (Table 11). Parameters are more difficult to simulate here, as average speed is inherently different in winter and summer. Navigating the NWP in winter is no longer technically impossible for commercial ships, and Fednav opted for year-round shipping scenarios to service mines in the Canadian Arctic: Voisey's Bay (northern Labrador), Deception Bay (northern Quebec), and eventually Milne Inlet (Baffin Island). It however requires a higher ice class and a double shaft for more power to break ice since the scenario assumes here there is no icebreaker escort; to simulate one would probably imply tariffs as are charged for the NWP. I opted for a PC4 ship, similar to those already used by Fednav. This entails a significant increase in fuel consumption rate since breaking ice requires huge power. I tried to balance the increased fuel consumption rate due to used power and double shaft propulsion, with the reduced fuel consumption rate due to lower speed when ice is not too solid. For simplification purposes, winter was set at 1 November until 1 May. Specific fuel is mandatory in the winter season to cope with polar temperatures.
Third scenario, year-round transit across the NWP, Rotterdam-Yokohama.
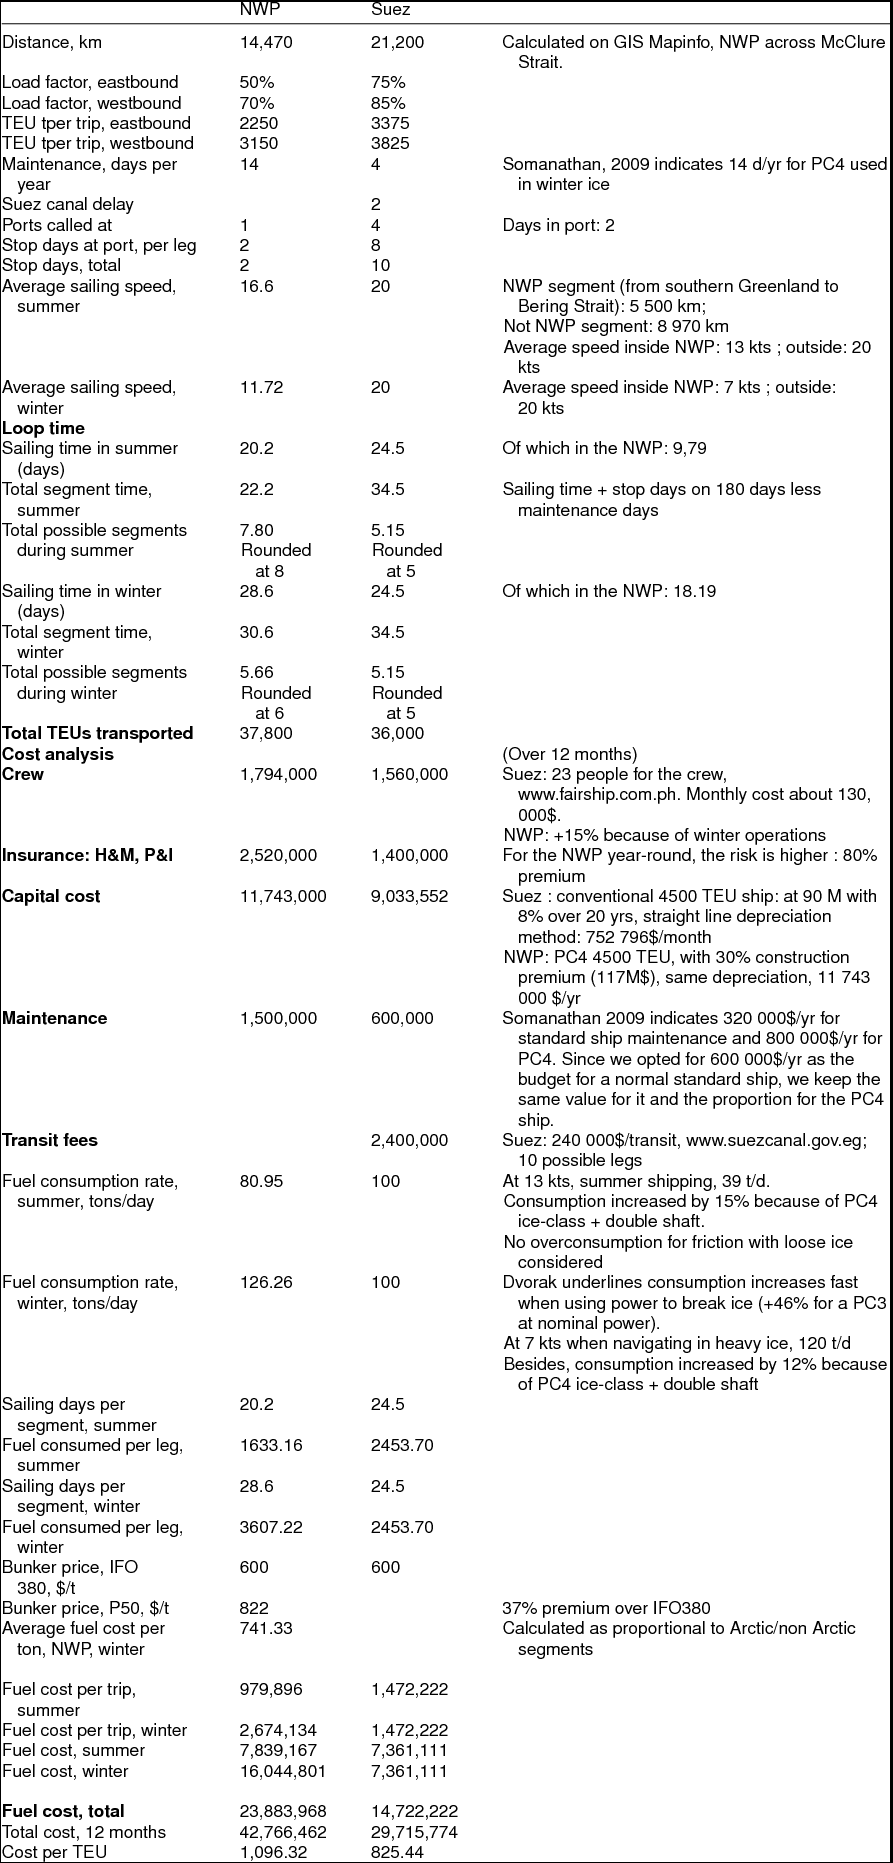
It appears that offering a liner service year-round is definitely not profitable, even across the NWP for a high ice-class container ship. The main potential advantage of the Arctic route, fuel consumption (Schøyen and Bråthen Reference Schøyen and Bråthen2011) does not materialise as winter navigation requires much more power. Insurance costs are more important, a ship navigating the NWP alone in the winter without ports to stopover bears a higher risk, and potential speed is not high enough to make more rotations that could compensate for the higher general costs (insurance, crew, maintenance). If the load factor was the same as with Suez (75/85%), then the cost per TEU would be similar, 822.24 $ or 0.4% cheaper for the NWP route. If the load factor was the same but the average winter speed dropped to 5 kts instead of 7 kts, then the average TEU cost would be 918.23 $, or 11.2% more expensive than the Suez route.
Fourth scenario: Rotterdam-Yokohama across the NSR, year-round shipping
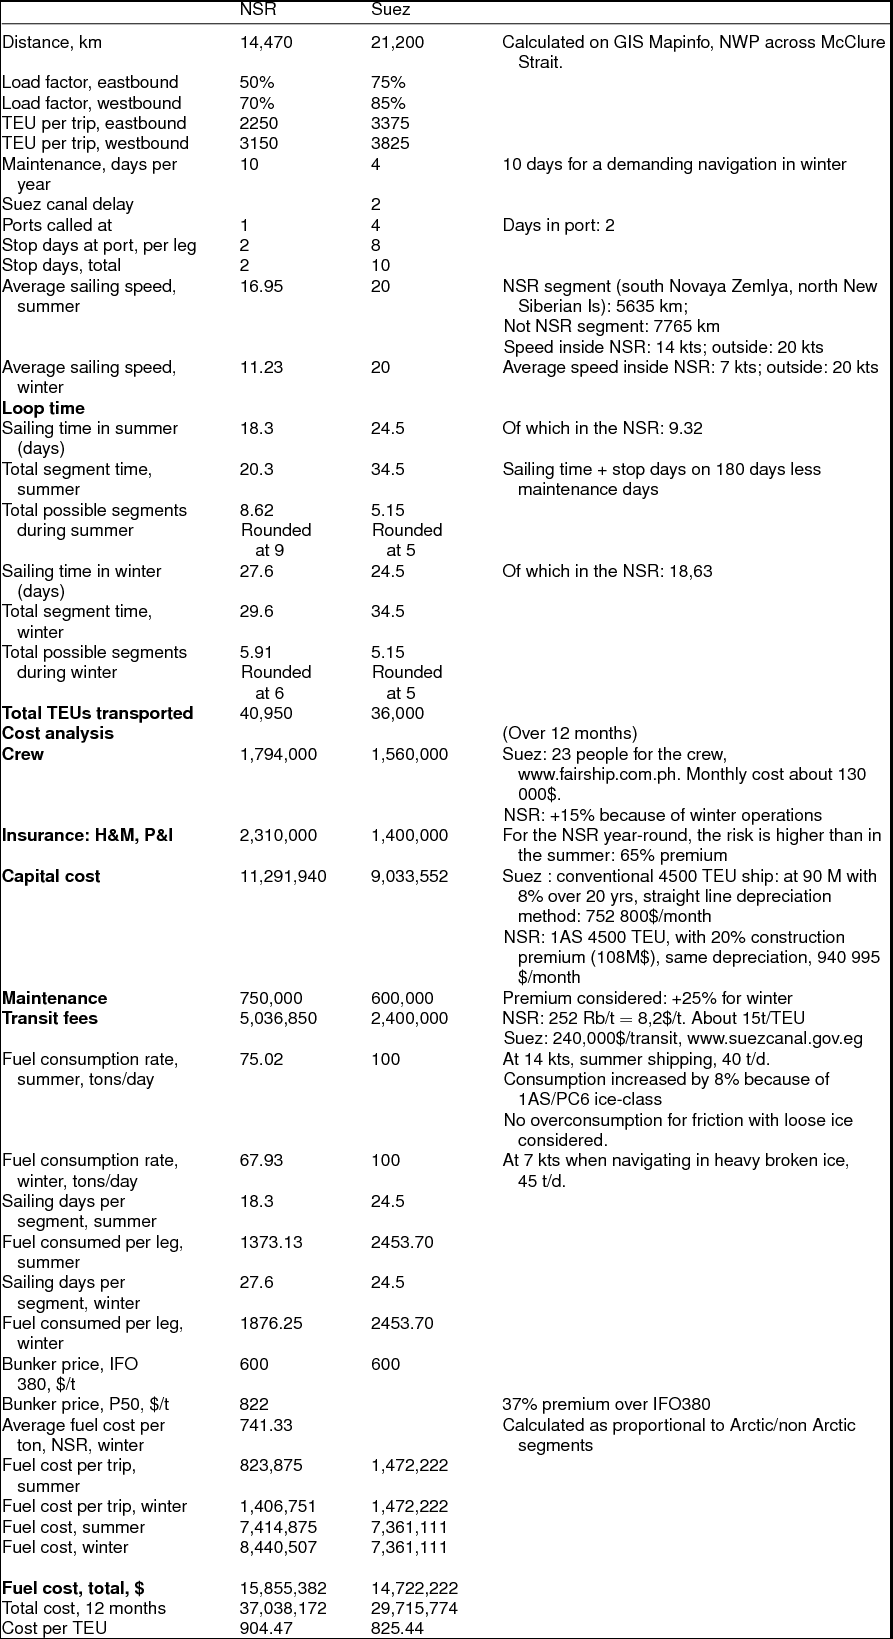
In this scenario (Table 12), because of the icebreaker service offered by the NSR administration, the same type of ship as in the summer is assumed fit for winter transit, thus reducing capital costs as well as fuel consumption, since the icebreaking is ensured by the icebreakers. Transit fees will apply however, and transit speed will remain low, for if they are powerful, the icebreakers do not necessarily progress faster than a strong PC4 commercial ship; and second, because of possible damage against huge chunks of broken ice, the 1AS ship cannot afford a much higher speed.
Fourth scenario, year-round transit across the NSR, Rotterdam-Yokohama.
It turns out the winter route along the NSR, even to Yokohama which is a profitable destination in the summer, is not when compared to the Suez route: the number of rotations is too low to make up for the increased costs due to winter shipping (crew, higher fuel cost, insurance, maintenance). The break-even point is reached if the load factor reaches 61/74% for instance. But if speed across the NSR drops to 5 kts, the break-even point will increase to a load factor couple of 66/79%.
If fuel costs increased to 1000$/t for IFO380 (and 1370$/t for P50), then the cost per TEU would still be greater for the NSR option, at 1162.60$ for the NSR with the lower load factor and 1098.07$ for Suez. Here again, higher fuel costs alone cannot ensure a profitable NSR option unless prices rocket up: prices per TEU are similar only when prices reach 2500$/t. . .
Criticism on the value of parameters
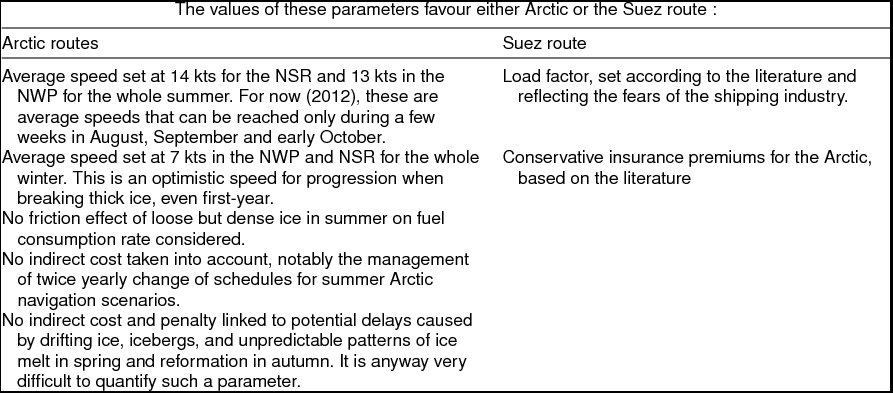
As a critical look on the proposed simulation, some parameters may favour the Arctic or the Suez routes. Table 13 summarises the main biases the chosen parameters introduce.
Parameters that favour Arctic or Suez routes in the scenarios
Conclusion
Many models have been published trying to assess the potential profitability of commercial shipping along Arctic routes, mostly to study transit shipping. A relative majority concluded the Arctic routes are likely to be profitable. However, the assumptions, simplifications inherent to any modelling differ widely.
I built up, using partial conclusions from the set of studied models, a new model in which I tried to take into account market considerations, something that is less prevalent in past models that usually focus of cost-analysis. This methodological approach is also justified by conclusions of a large survey conducted with the shipping industry (Lasserre and Pelletier Reference Lasserre and Lasserre2011).
It appears that:
1. Official Russian tariffs for the NSR make any route prohibitively expensive; but the Russian authorities do intend to enforce a very flexible real tariff so as to attract business.
2. Summer transit to Shanghai is usually not cost-competitive for a liner service, unless fuel costs are higher and, more strategically, the load factor is much improved. Fuel costs in themselves are not important enough to account for the profitability of Arctic routes.
3. Transits to Yokohama, however, are more profitable with Arctic routes, along both the NSR and the NWP, despite lower load factors. However, if transit speed along the Arctic segments proved to be slower than assumed in this simulation, it would question the profitability of the service.
4. Year-round liner service is never profitable, even to Yokohama, neither along the NWP with a dedicated powerful PC4 ship, nor with a 1AS ship along the NSR with an icebreaker escort.
5. Rather than being directly dependent on the variable of fuel cost, the profitability of Arctic routes depend on average transit speed, that determine the number of possible rotations, and on the load factor, underlining the importance for shipping companies of securing a large enough market for a direct transit route to make a profit.
The simulation thus indirectly confirms fears many expressed during the survey we conducted: without a strong load factor, Arctic routes will hardly be profitable.
Approximate equivalence of ice class classification systems