Introduction
There are size effects involved in determining the strength of materials at every level from the atomic scale to the macro-scale. A number of size effects are reviewed in the present report. We start with the Hall–Petch (H-P) relation for an inverse square root of grain size, ℓ−1/2, dependence of the unidirectional plastic flow stress, σε, at strain value, ε:
 $${\sigma _\varepsilon } = {\sigma _{0\varepsilon }} + {k_\varepsilon }{\ell ^{ - {\rm{1/2}}}} = {m_{\rm{T}}}\left[ {{\tau _{0\varepsilon }} + {k_{{\rm{S}}\varepsilon }}{\ell ^{ - 1/2}}} \right]\quad .$$
In Eq. (1), σ0ε is a Taylor-type “friction” stress for strain hardening within the grain volumes and k ε is a Griffith-type microstructural stress intensity factor that applies for local stress enhancement at an average grain boundary needed for transmission of plastic flow by slip or twinning [Reference Armstrong, Codd, Douthwaite and Petch1]. Also in Eq. (1), σ0ε is shown to connect with a resolved shear stress, τ0ε, multiplied by the Taylor orientation factor, m T, for resolution of σε onto the slip system geometry and relates k ε to the shear stress intensity, k Sε, multiplied by the same m T factor. The mention of Griffith connection for grain size dependence follows from the model of a dislocation pile-up in a slip band, when blocked at a grain boundary, behaving similarly to a shear crack.
Consideration is given in route to assessing Eq. (1) applications at several dimensional levels, first, in section “Specimen size/grain size relationship”, to strength/ductility measurements involving larger grain sizes and/or smaller test specimen dimensions for which there is transition in the mechanical properties during progression from single crystal to multi-crystal deformation and eventual true polycrystalline behaviors. The specimen thickness dependence in thin sheet material or stretched foils provides an interesting strength/ductility comparison to be made with tensile specimen measurements. In section “H-P extension to the nano-scale”, there is dislocation mechanics extension of Eq. (1) to cover additional size-dependent microstructural details associated with more complex microstructures and alloying. The importance of a subgrain structure and, when relevant in composite materials, specification of particle sizes and their separations are to be taken into account, also, with considered influence of temperature and strain rate. Connection is made on an H-P basis in section “H-P extension for more complex alloys” with a compilation of micro- and nano-scale face-centered cubic (FCC) strength levels and with upper-limiting strengths for pearlitic steel wire materials, followed in section “H-P/particle size aspects of ductility” by presentation of grain size and particle size/spacing measurements determining material ductility in spheroidized and related steel and magnesium materials. H-P grain size–dependent hardness and strain rate sensitivity (SRS) measurements in electrodeposited nickel materials are assessed for thermally activated dislocation mechanics in section “H-P extension for more complex alloys”. Size-dependent aspects of elastic, plastic, and cracking measurements made via indentation hardness testing are described for silicon crystals in section “Hardness-based indentation size or crack size relationships”, beginning from nano-scale impressions and leading to (in section “Crack size/grain size relationship”) micro- and macroscale indentation fracture mechanics description. In section “Discussion”, which focuses on experimental measurements, related fracture mechanics and dislocation pile-up models for crack size/grain size dependencies are presented in conventional and indentation fracture mechanics measurements for alumina materials, with resulting demonstration of an H-P–type relationship for the fracture mechanics stress intensity, K IC, parameter.
Specimen size/grain size relationship
Recent attention was directed to early 20th-century measurements made on single crystal and multi-crystal aluminum tensile specimens by Taylor, Polanyi, and colleagues in an attempt to answer the question of whether the presence of grain boundaries contributed to strengthening multi-crystals [Reference Armstrong, Totton, Tiryakioglu and Kessler2]. Pro and con views were given, respectively, by Polanyi and Taylor. In retrospect, Polanyi should have won the argument in favor of specific grain boundary strengthening but Taylor demonstrated at the time, and in a further important work, that the particular deformation of aluminum could be largely accounted for with the use of a suitable orientation factor, m T, to connect the slip band–controlled deformation of individual crystals to a multi-slip requirement of grain boundary–accommodated straining during polycrystal deformation. A 21st-century example of specific obstruction of slip by both grain boundaries and subgrain boundaries is given in the report by Kondo et al. of direct transmission electron microscopy (TEM) observations made of blocked dislocation pile-ups in nano-indented polycrystalline SrTiO3 material [Reference Kondo, Mitsuma, Shibata and Ikuhara3].
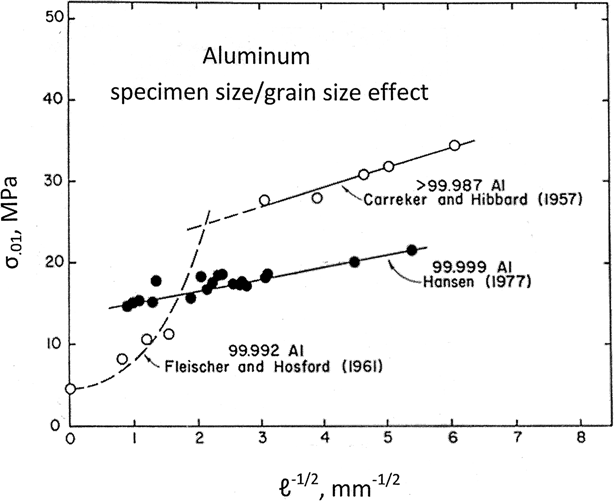
Figure 1 illustrates the transition in strength from single crystal to polycrystalline behavior for several essentially pure aluminum materials tested at ambient temperature. The figure shows, beginning from a lowest single crystal stress level, the flow stresses at ε = 0.01 of multi-crystal material having an increasing number of grains in a tensile specimen of fixed cross section in comparison with linear H-P dependencies established at smaller grain sizes [Reference Fleischer and Hosford4, Reference Armstrong5, Reference Carreker and Hibbard6, Reference Hansen7]. Fleischer and Hosford reported the measurements used to determine the lower curve beginning on the ordinate axis from σ0.01 = 2τcrss, that is, two times the critical resolved shear stress (CRSS) for a single crystal with a slip system at 45°, and shown to continue upward as an increasing number of crystals, or grains, were present in the specimen cross section [Reference Fleischer and Hosford4]. The behavior was attributed to a “specimen size effect” that was estimated to apply when ∼20 or less grains were present in a specimen cross section [Reference Armstrong5]. The highest linear dependence shown in Fig. 1 was obtained from comprehensive measurements reported earlier by Carreker and Hibbard, without H-P connection, and included additional measurements made over a range of temperatures and strain rates [Reference Carreker and Hibbard6]. The intermediate, ambient temperature, H-P dependence was reported later by Hansen in confirmation of an H-P relation, in this case, with lower k 0.01 = 1.4 MPa mm1/2 for aluminum material of greater purity [Reference Hansen7]. Hansen specifically used larger specimen sizes at the larger grain sizes used by Hosford and Fleischer to ensure that true polycrystalline material behavior was being measured.
Single crystal, multi-crystal, and polycrystalline aluminum tensile flow stress measurements.

The total measurements in Fig. 1 are included between the inequalities:
 $$2{\tau _{{\rm{crss}}}} \le {\sigma _\varepsilon } \le {m_{\rm{T}}}\left[ {{\tau _{0{\rm{M}}}} + {k_{{\rm{S}}\varepsilon }}{\ell ^{ - {\rm{1/2}}}}} \right]\quad .$$
In the H-P relationship, τ0M is the shear stress for multi-slip that was specified by Taylor and elaborated in a later important work by Kocks [Reference Kocks, Armstrong and Feltner8]. It should be noted that the higher σ0ε and k ε values reported by Carreker and Hibbard, compared with the measurements of Hansen, provide an indication of the important role of impurities or solutes in determining the deformation behavior of aluminum materials [Reference Armstrong, Totton, Tiryakioglu and Kessler2].
A similar specimen size effect on lowering the H-P dependence for large-grain, thin sheet copper material tested in tension was reported as a function of strain and temperature by Hug et al. [Reference Hug, Dubos and Keller9]. A ratio of specimen thickness to grain diameter, (t/ℓ) ≈ 5–6, was established for true polycrystalline behavior of specimens with a sheet thickness of 500 μm and a range of grain diameters of 23 ≤ ℓ ≤ 571 μm. Both lower stress and lower strain hardening behaviors were determined for the specimen size effect region, thus leading the authors to give emphasis to the grains in the specimen surface layers being “softer” than those in the interior. Previous work had been done by Keller et al. on nickel material over a range of grain size of 36 ≤ ℓ ≤ 540 μm, also with σε − ε measurements reported for a range of sheet thicknesses of 12.5 ≤ t ≤ 540 μm tested with a constant grain size of ℓ = 100 μm [Reference Keller, Hug and Feaugas10]. And similar results were found, including transition to polycrystalline H-P behavior at (t/ℓ) ≈ 4.0, with interesting measurement of an increasing strain to fracture obtained for thicker sheet material but with (t/ℓ) ≤ 1.0 for one grain of increasingly larger size in specimen thicknesses. In a later report by Keller and Hug, the same nickel results were added to include a wider range of sheet thicknesses, 50 ≤ t ≤ 3200 μm at a constant ℓ = 100 μm [Reference Keller and Hug11]. The specimen size effect was attributed also to the material surface layers being softer. A dislocation model description was presented based on TEM observations of larger dislocation cell diameters being formed on the material surface layers, which is indicative of weaker material on a Taylor-type basis.
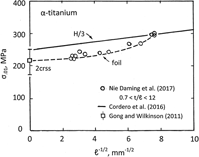
Other specimen size effect measurements have been reported for α-titanium foils by Nie et al., also including yield stress and fracturing measurements [Reference Nie, Lu and Zhang12]. Figure 2 presents a comparison of the reported titanium σ0.01 flow stress measurements and the reported single crystal CRSS and H-P measurements. The single crystal CRSS measurements shown on the ordinate axis were reported by Gong and Wilkinson [Reference Gong and Wilkinson13]. The linear H-P dependence was taken from a recent review of H-P measurements presented for relatively pure materials by Cordero et al., as determined from diamond pyramid hardness, H, measurements [Reference Cordero, Knight and Schuh14], and the H-P dependence is plotted on the basis, to be referenced later, of σε ≈ H/3. The value of σ0ε = 220 MPa and k ε = 6 MPa mm1/2 for the H-P dependence compares with a same σ0ε and somewhat higher k ε = 10 MPa mm1/2 reported very recently by Wagner et al. [Reference Wagner, Ouarem, Richeton and Toth15]. Elongation measurements for the titanium material were found also to be greater at an increasing (t/ℓ) ratio. Most importantly, an examination of the fracture surfaces among the specimens showed a combination of mixed-mode fracturing, including cleavage separations at smaller (t/ℓ) and ductile hole joining at larger (t/ℓ) ratios.
Single crystal, multi-crystal, and H-P dependence for commercial purity α-titanium.

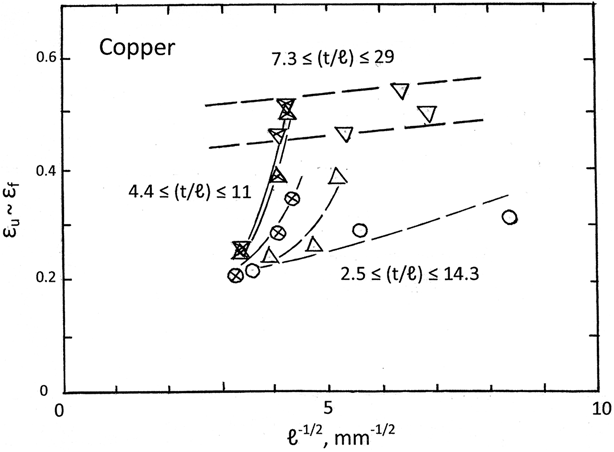
The model description of weaker surface grains in thin sheet copper material was further established in related reports by Meng and Fu [Reference Meng and Fu16] and Wang et al. [Reference Wang, Fu and Shi17]. Complete tensile test measurements were reported. Different models of H-P relations were developed for the deformation of surface grains as compared with internal grains. Figure 3 has been constructed from the two reports to illustrate that an increasing uniform strain, εu, taken equal to the fracture strain, εf, was measured at smaller grain sizes. The various εu dependencies shown in Fig. 3 bear a similarity to the σ0.01 dependence shown in Fig. 1; for example, at a higher (t/ℓ) ratio, there is indication of an H-P dependence, which has to be confirmed subsequently in the present report for other measurements in the regimen of established H-P behaviors. Also, mention is made of an interesting connection between the present description and an early 20th-century dispute between leading metallurgists of the time, Jeffries and Mathewson, concerning copper measurements showing, at relatively larger grain sizes, an increase in ductility with reduction in grain size [Reference Jeffries18].
Uniform strain, εu, preceding immediate fracture at εf, for different copper (t/ℓ) ratios.

H-P extension to the nano-scale
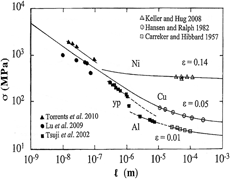
Transition from a specimen size effect for relatively few grains in a material cross section to the H-P dependence for true polycrystalline behavior leads to order-of-magnitude greater strength levels being achievable for ultrafine and nano-scale grain size materials. Such order-of-magnitude increase in yield stress levels over conventional measurements had been predicted for ultrafine grain size metals [Reference Armstrong, Burke and Weiss19]. Current examples are provided in Fig. 4 of the connection between conventional and ultrafine grain size measurements for aluminum, copper, and nickel materials [Reference Armstrong, Faester, Hansen, Huang, Juul Jensen and Ralph20]. In the log/log compilation of H-P results, the Carreker and Hibbard measurements from Fig. 1, with k 0.01 = 2.3 MPa mm1/2, are seen to extrapolate upward in stress via measurements reported by Tsuji et al. [Reference Tsuji, Ito, Saito and Minamino21]. An additional increase in the H-P dependence is shown to have occurred for material exhibiting yield point behavior, thus producing a higher k y.p. = 4.8 MPa mm1/2. A substantial increase in grain size dependence for yield point behavior is well known for steel. In Fig. 4, the conventional grain size copper material reported by Hansen and Ralph [Reference Hansen and Ralph22], with k 0.05 = 5.0 MPa mm1/2, had been correlated with the indicated smaller grain size measurements compiled by Lu et al. in a previous work also showing a favorable H-P, compared with their own measurements made on nano-twinned copper material [Reference Lu, Chen, Huang and Lu23]. And last in Fig. 4, an unusual case is shown for conventional grain size nickel material investigated by Keller and Hug [Reference Keller and Hug24], exhibiting reduction in a larger strain with k 0.14 ≈ 2.2 MPa mm1/2, which was found to be progressively lowered from an initial k 0.002 ≈ 5.2 MPa mm1/2, and is compared with ultrafine grain size nickel material exhibiting a hardness-determined flow stress of k ε ≈ 6.2 MPa mm1/2, as determined by Torrents et al. [Reference Torrents, Yang and Mohamed25].
Conventional and ultrafine grain size H-P dependencies for aluminum, copper, and nickel materials at different strain values.

Dislocation cross-slip has been proposed to facilitate transmission of plastic flow across the grain boundaries of essentially pure FCC metals, hence explaining the low k ε value for aluminum in which cross-slip is ubiquitous and accounting for the essentially equivalent values of k ε for copper and nickel materials [Reference Armstrong26]. The dislocation pile-up model description for the microstructural stress intensity, k ε, is given as follows:
 $${k_\varepsilon } = {m_{\rm{T}}}{\left[ {{{\pi {m_{\rm{S}}}Gb{\tau _{\rm{C}}}} / {2\alpha }}} \right]^{{\rm{1/2}}}}\quad .$$
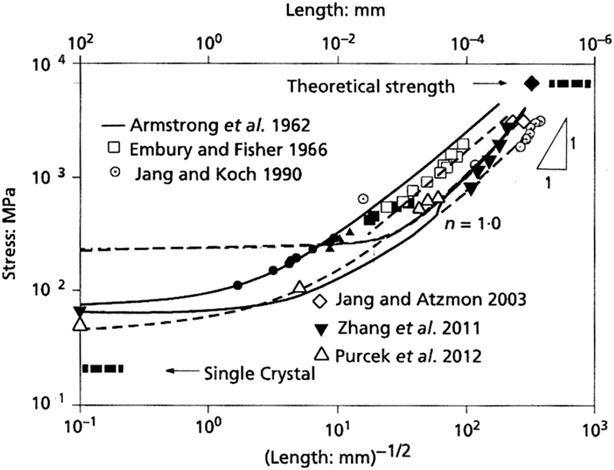
In Eq. (3), m S is a Sachs orientation factor, α ≈ 0.8 is a constant for average dislocation character, and τC is the local stress at the pile-up tip for transmission of plastic flow across the grain boundary. Measurements of k ε have been correlated with model calculations using independent single crystal cross-slip shear stresses. An interesting consequence of applying the pile-up model to ultrafine grain sizes has been prediction of transition at a sufficiently small grain size to a single dislocation loop expanding against the grain boundary resistance. Most importantly, the transition is predicted to lead to a higher stress level than predicted for the H-P dependence. Evidence for such effect was shown for aluminum [Reference Armstrong26]. Additional connection with transition to an ℓ−1 dependence is shown in Fig. 5 as part of a compilation of H-P measurements for a number of iron and steel materials, including upper-limiting strength levels achieved for several pearlitic steel wire materials [Reference Armstrong27].
Compiled H-P measurements for steel with indicated transition to an ℓ−1 dependence.

Figure 5 is an updated log/log version of H-P measurements originally reported to show a range between a lower limiting stress for a pure α-iron single crystal and an upper-limiting theoretical stress of (1/5) of Young’s modulus for perfect α-iron [Reference Smith, Armstrong, Hazzledine, Masamura, Pande, Otooni, Armstrong, Grant and Ishizaki28]. In Fig. 5, the uppermost solid H-P curve had been included for the lower yield point of mild steel from the study of Armstrong et al. [Reference Armstrong, Codd, Douthwaite and Petch1] along with additional measurements. The open square points of Embury and Fisher [Reference Embury and Fisher29] are for drawn pearlitic steel wire and the open circle measurements of Jang and Koch are for ball-milled α-iron [Reference Jang and Koch30]. Other additions include the open diamond measurements converted from hardness measurements reported for α-iron by Jang and Atzmon [Reference Jang and Atzmon31], solid inverted triangle measurements reported for drawn pearlitic steel by Zhang et al. [Reference Zhang, Godfrey, Huang, Hansen and Liu32], and open triangle measurements for interstitial free (IF) iron by Purcek et al. [Reference Purcek, Saray, Karaman and Maier33]. Most recently added, coincidentally at the previously estimated theoretical strength level, is the solid diamond point measurement reported by Li et al. [Reference Li, Raabe, Herbig, Choi, Goto, Kostka, Yarita, Borchers and Kirchheim34], which datum was also reported for heavily drawn pearlitic steel wire whose strength level was obtained for a TEM-observed dislocation subgrain structure stabilized by segregation of the total carbon content resorbed in solution.
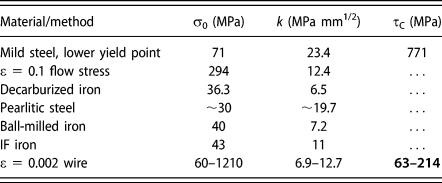
The constants for the H-P dependencies included in Fig. 5 are given in Table I, which also includes several values of the local concentrated stress, τC, calculated from the k value in Eq. (3). The mild steel lower yield point, ε = 0.1 flow stress, and decarburized (Swedish) iron σ0 and k values are from Ref. Reference Armstrong, Codd, Douthwaite and Petch1. The measurements of pearlitic steel are from Ref. Reference Embury and Fisher29, ball-milled iron from Ref. Reference Jang and Koch30, IF iron from Ref. Reference Jang and Atzmon31, and ε = 0.002 wire from Ref. Reference Purcek, Saray, Karaman and Maier33. The carbon-locked yield point k value is seen to be reduced by ∼50% or more for the flow stress of mild steel and for the carbon-free yield stress behavior of IF iron. Of particular interest for comparison in Fig. 5 are the pearlitic steel measurements of Embury and Fisher [Reference Embury and Fisher29] and the otherwise comparable ε = 0.002 (pearlitic) wire measurements of Zhang et al. [Reference Purcek, Saray, Karaman and Maier33]. On the basis of careful TEM observations, Zhang et al. accounted for relatively higher values of σ0 and lower values of k [see the corresponding reduction in calculated values of τC obtained from Eq. (3)]. The lower k values provide for the possibility of transition to single dislocation loop behavior at smaller grain sizes, as shown for the lower solid H-P curve transitioning to an ℓ−1 dependence beginning at the lower limiting dislocation pile-up number, n = 1, in Fig. 5 [Reference Armstrong27].
H-P parameters for iron and steel materials.

H-P extension for more complex alloys
Equation (1) has been extended to much more complicated microstructures than were originally developed to explain the grain size dependence of the lower yield stress of iron at ambient and liquid nitrogen temperatures and the cleavage fracturing stresses of a number of iron and steel materials at lower temperatures. The relationship was soon expanded [Reference Armstrong, Bechtold, Begley, Semchyshen and Perlmutter35] to include component stresses for alloy strengthening mechanisms in refractory metals, such as niobium and molybdenum, through separation of athermal (σ0Gε) and thermal (σ0Thε) stresses in σ0ε and with added stress components for alloying solutes (σ0GSε) and (σ0Thε). An H-P–type influence of subgrain boundary spacing, d sg, effect with k sg ≤ k ε was included for analogous transgranular obstacle effect on slip band progression:
 $$\eqalign{{\sigma _\varepsilon } = \left[ {{\sigma _{0{\rm{G}}\varepsilon }} + {\sigma _{0{\rm{GS}}\varepsilon }}} \right] + \left[ {{\sigma _{0{\rm{Th}}\varepsilon }} + {\sigma _{0{\rm{ThS}}\varepsilon }}} \right] \cr + \,{k_{{\rm{sg}}}}{d_{{\rm{sg}}}}^{ - 1/2} + {k_\varepsilon }{\ell ^{ - 1/2}}\quad .$$
The individual terms in Eq. (2) were noted to be measurable in different individual situations, for example, either in single crystals compared with polycrystals, or for selected alloy compositions at various temperatures and strain rates [Reference Armstrong, Bechtold, Begley, Semchyshen and Perlmutter35]. An early example investigation of an inverse square root of subgrain size, d sg−1/2, dependence for the flow stress of aluminum at a fixed (larger) grain size was reported by Ball [Reference Ball36].
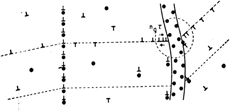
Figure 6 shows a schematic representation of the various features responsible for the expanded H-P relationship. In Fig. 6, the dislocations, as upside-down or right-side T’s, are shown along with filled circle solute atoms in solution or segregated at a vertical subgrain boundary or in a segregated zone localized within a (wider) grain boundary region. The single crystal–based contribution to yield strength and strain hardening, in σ0ε, versus polycrystal connection due to the added k εℓ−1/2 term provides for a first type of size discrimination to be made in the present report, that is, concerning the number of crystals or grains (and grain boundaries) that are required to be in a test specimen cross section for true polycrystalline behavior to be measured. An important assessment of additive size-dependent strengthening produced by grains, subgrains, and particles has been reported for iron-based alloy materials by Leseur et al. [Reference Leseur, Syn and Sherby37]. A cell or subgrain size dependence of d sg−1 was reported for ball-milled iron and several wrought iron materials, with measurements extending to much larger cell sizes than reported for the grain size results of Jang and Koch [Reference Jang and Koch30], as shown in Fig. 5. An H-P dependence on grain size was established also for other ball-milled iron, wrought IF iron, and different steel materials. In addition, a reciprocal square root of interparticle spacing, λ−1/2, was established for a large number of ball-milled iron oxide and iron carbide–strengthened alloy steel materials. The latter measurements relate very positively to early H-P–type measurements reported by Gurland and colleagues on both aluminum–silicon alloy [Reference Erginer and Gurland38] and spheroidized steel [Reference Liu and Gurland39] materials for which λ−1/2 dependencies were determined when using the mean free path between combined particles and grain boundaries. The steel measurements connect with more recent measurements reported for effective H-P dependencies established for low- and medium-carbon, eutectoid, and hypereutectoid materials by Zheng et al. [Reference Zheng, Li, Yang and Sun40]. More is to be described concerning the size dependence of ductility reported for the steel measurements.
Schematic model of a propagating slip band structure within a polycrystal.

H-P/particle size aspects of ductility
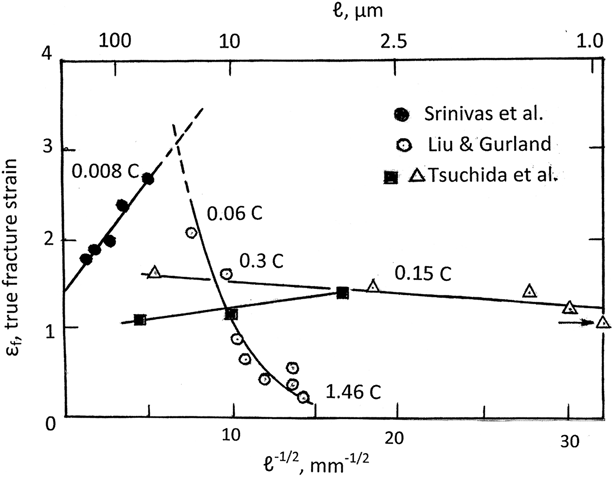
The advantage of steel materials of reducing the grain size to increase the cleavage fracture stress and lower the ductile-to-brittle transition temperature, particularly in Charpy impact tests, is well known, including improvement in fracture toughness properties [Reference Armstrong and Liebowitz41]. Although a similar H-P–type increase occurs for the ductile fracture stress and is accompanied at first by an increase in ductility, the situation is reversed at finer grain sizes. Figure 7 shows a compilation of true fracture strain, εf; dependencies on grain size; and particle size/spacing for a number of steel materials. The larger grain size, H-P type, results relate to the [specimen size/grain size] transition in measurements shown in Fig. 3 for copper.
True fracture strain, εf, dependence on grain size and particle size/spacing in steel.

In Fig. 7, the filled circle points were plotted from relatively larger grain size measurements reported by Srinivas et al. for Armco iron material (American Rolling Mill Company, Middletown, OH) of 0.008 wt% carbon [Reference Srinivas, Malakondaiah, Armstrong and Rama Rao42]. The measurements are seen to follow an H-P relationship:
 $${\varepsilon _{\rm{f}}} = \left[ {\left( {{{\Delta {\sigma _0}} / h}} \right)} \right] + \left[ {{{\left( {{k_{\rm{f}}} - {k_{\rm{y}}}} \right)} / h}} \right]{\ell ^{ - 1/2}}\quad .$$
In Eq. (5), Δσ0 = σ0f – σ0y and h is the average strain hardening coefficient normally found to be independent of grain size. The open circle measurements in Fig. 7 were taken from the spheroidized steel measurements reported by Liu and Gurland [Reference Liu and Gurland39] to apply for fracturing determined by hole joining in microstructures established over a range in mean-free-path–determined grain sizes and carbon contents of 0.06–1.46 wt%. The plotted grain size dependence for the points was obtained via the method proposed by Petch and Armstrong in which εf was determined by bringing the carbide particles to a smaller critical spacing during straining [Reference Petch and Armstrong43]. The H-P–determined improvement in ductility at larger grain sizes reflects the role of slip band stress concentrations in the promotion of cracking, while the particle size/spacing influence on ductility reduction is attributed to fracturing caused by the hole-joining failure mechanism.
The two opposing mechanisms determining material ductility have been demonstrated recently to apply also for grain size–dependent measurements reported for the creep fracturing of copper [Reference Armstrong and Rhodes44]. Also shown in the extended grain size region of Fig. 7 are εf measurements reported by Tsuchida et al. [Reference Tsuchida, Inoue, Nakano and Okamoto45] for comparative measurements made on mild steel processed to produce relatively finer grain size, either ferrite–pearlite (filled square) or ferrite–cementite (open triangle) microstructures. Tsuchida et al. had earlier reported positive σf and εf dependencies on grain size for several steel materials [Reference Tsuchida, Inoue and Enami46]. Nevertheless, the H-P–type dependence of εf for the ferrite–pearlite microstructure in Fig. 7 is associated with a smaller k f in Eq. (5), as was observed in measurements reported by Liu and Gurland [Reference Liu and Gurland39, Reference Armstrong47], while the reduction in εf for the ferrite–cementite steel is attributed to a moderated role for failure caused by ductile hole joining.
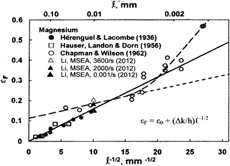
Figure 8 shows an H-P dependence for εf measurements compiled for a number of magnesium materials. The apparently texture-free (historical) measurements of Hérenguel and Lacombe [Reference Hérenguel and Lacombe48] and those of Hauser et al. [Reference Hauser, Landon and Dorn49] cover a conventional range of grain size extending down to 10 μm. The measurements by Wilson and Chapman [Reference Chapman and Wilson50], which give indication of a higher value of ε0 = Δσ0/h and lower Δk/h, are seen to increase strongly at a finer grain size in the region in which Wilson and Chapman reported evidence of superplastic behavior. In a follow up report of 300 K and lower temperature test measurements, Wilson reported that the fracturing was due to a combination of trans- and intergranular separations that were produced by the stress concentrations of dislocation pile-ups at the grain boundaries, consistent with an H-P description [Reference Wilson51]. Thus, the H-P–type εf dependence was taken to be somewhat analogous to the improvement in ductile-to-brittle transition behavior previously established for steel. Important attention was given to the thermal dependence of the needed secondary slip system operation to prevent cracking.
An H-P dependence for the true fracture strain, εf, of magnesium materials.

The most recently added (triangle) points [Reference Li52] shown in Fig. 8 are from the study of Armstrong and Li [Reference Armstrong and Li53] from a description of dislocation dynamics measurements obtained during low- to high-rate loading tests. For HCP magnesium, cadmium, and zinc materials, an increase in strain rate produces an increased ductility in the same manner exhibited by copper and other FCC metals because of a rate-dependent increase in strain hardening. An interesting connection of an exceptionally high-rate loading dependence measured as a function of grain size of copper was reported by Petit for the breakup of shaped charge jets in which greater elongation of the jets had been demonstrated for finer grain size material [Reference Petit54]. The measurements were shown to follow an H-P dependence [Reference Armstrong and Hashmi55]. He et al. have reported related higher resistance of smaller grain size, thin copper plates subjected to simulated ballistic steel ball impacts [Reference He, Dou, Guo and Liu56]. For either hexagonal close-packed (HCP) or FCC metals, there is an important grain size dependence of the material hardening because the H-P k ε values for secondary slip system activation [Reference Prasad and Armstrong57] or cross-slip [Reference Armstrong and Rodriguez58], respectively, are small enough in magnitude to have a thermal dependence in τC [see Eq. (3)].
Nano-scale thermally dependent fcc/hcp deformations
The grain size dependence of SRS measurements obtained for nano-scale FCC and HCP metals provides another avenue for investigation of operative plastic deformation mechanisms. Grain size–dependent SRS measurements had been interpreted first for HCP polycrystalline cadmium measurements, with thermal activation in τC leading to an H-P dependence for the inverse activation volume [Reference Prasad and Armstrong57]. Thermal dependence in the H-P flow stress measurements of magnesium had been established in the pioneering measurements reported by Hauser et al. [Reference Hauser, Landon and Dorn49, Reference Armstrong and Li53].
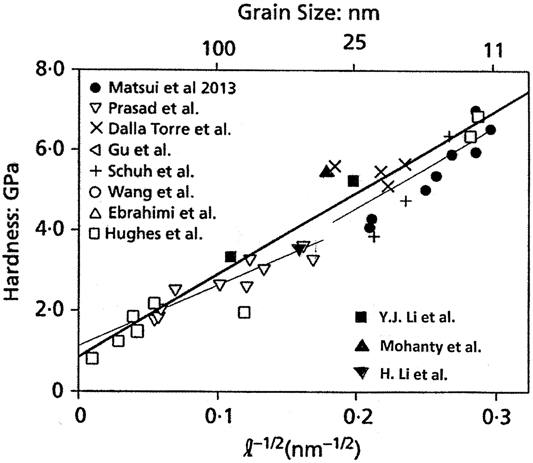
We begin here with Fig. 9 as a reference ambient temperature hardness basis for assessing the H-P dependence of nickel materials. Matsui et al. had originally plotted the measurements listed on the left side of Fig. 9 to draw a comparison between sulfur (weaker) and carbon (stronger) influences on determining the strength properties of electrodeposited material [Reference Matsui, Uesugi, Takigawa and Higashi59]. The drawn-in heavier line for an encompassing H-P dependence was originally reported by Hughes et al., in accordance with the following relation [Reference Hughes, Smith, Pande, Johnson and Armstrong60]:
 $$H = {H_0} + {k_{\rm{H}}}{\ell ^{ - {\rm{1/2}}}}\quad .$$
A hardness H-P relationship for electrodeposited nickel materials.

Hughes et al. had correlated the hardness H 0 and k H parameters given in Fig. 9 with single crystal resolved shear stress (in σ0ε) and cross-slip shear stresses (in k ε), respectively, in the latter case, taking k H = 3k 0.075. For our present purpose of considering the implicit SRS, focus is on the added hardness values indicated by the filled symbols identified on the lower right side of Fig. 9.
Li et al. had investigated the strain hardening and SRS in compression of pulsed electrodeposited nickel at two grain sizes: 25 and 80 nm. Tests were conducted at 298–473 K and strain rates between 10−4 and 10−3 s−1. Representative hardness values as filled square points, taken as H = 3σε, show agreement with the results given in Fig. 9 [Reference Li, Mueller, Höppel, Göken and Blum61]. Corresponding activation volume, v* = A*b, for SRS, in which A* is the activation area containing b, was able to be obtained in accordance with the following relationship:
 $${v^*} = {A^*}b = {k_{\rm{B}}}T{\left[ {\Delta \ln {{\left( {{{{\rm{d}}\gamma } / {{\rm{d}}t}}} \right)} / {\Delta \tau }}} \right]_{\rm{T}}}\quad .$$
In Eq. (7), k B is Boltzmann’s constant, (dγ/dt) = m T(dε/dt), and Δτ = ΔσTh/m T, as described, for example, in Eqs. (1) and (3). A tabulation of σε and v* values determined from the measurements of Li et al. is given in Ref. Reference Armstrong and Balasubramanian62.
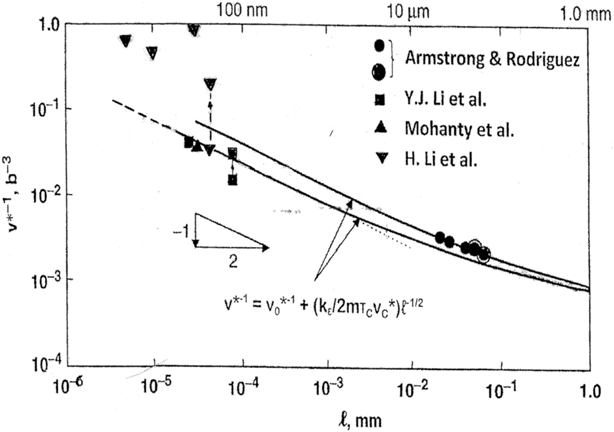
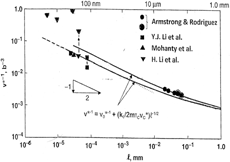
Figure 10 shows the previously reported v* measurements plotted on the basis of an extended H-P relationship for v*−1, that is,
 $$\left( {{1 / {{v^*}}}} \right) = {\left( {{1 / {{v^*}}}} \right)_0} + \left( {{{{k_\varepsilon }} / {2{m_{\rm{T}}}{\tau _{\rm{C}}}{V_{\rm{C}}}^ * }}} \right){\ell ^{ - 1/2}}\quad .$$
SRS type, v*−1, measurements for nickel covering grain size strengthening and weakening.

In Eq. (8), (1/v*)0 is the counterpart grain volume term from the SRS of σ0 and v C* is the activation volume determined from a thermally dependent stress component in τC [Reference Prasad and Armstrong57, Reference Armstrong and Rodriguez58].
The upper and lower H-P–type curves shown for Eq. (8) apply for the temperatures 195 and 300 K, respectively. A linear H-P dependence is obtained because the product τCThv C* is constant.
Agreement is shown in Fig. 10 with an independent filled, right-side up triangle measurement of v*−1 determined at 298 K from micropillar compression test measurements reported by Mohanty et al. (see also the converted hardness point in Fig. 9) [Reference Mohanty, Wheeler, Raghavan, Wehrs, Hasgawa, Mischler, Phillipe and Michler63]. Mohanty et al. reported evidence of grain boundary sliding in their deformed material. Such behavior is to be associated with grain size weakening and possibly enhanced material ductility, as will be discussed. Agreement is also shown in Fig. 10 for determination of a lower inverted triangle v* value at 40 nm, as determined from measurements in tension reported by Li et al. over a range of strain rate between 10−4 and 1 s−1 [Reference Li, Liang, Zhao, Hu, Han and Lian64].
In addition, Li et al. extended their stress–strain measurements to cover exceptionally low, creep-type strain rates from 10−10 to 10−6 s−1 for which grain size weakening was observed in the stress–strain behavior of the 40-nm material. Consequently, a “jump” in the v*−1 value to atomic-scale dimension is shown in Fig. 10 at 40 nm and also for smaller grain sizes of 6, 13, and 20 nm. The weakening behavior was attributed to a mechanism of grain boundary diffusion. Figure 10 illustrates the important grain size sensitivity of v* in the ultrafine grain size region and shows special merit of using v*−1 measurements to monitor, if not interpret, both grain size strengthening and weakening behaviors.
Hardness-based indentation size or crack size relationships
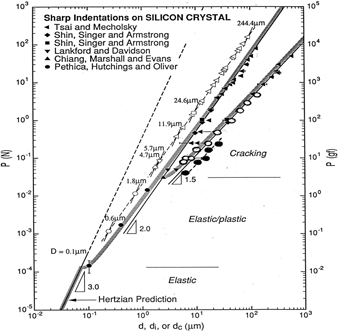
Beyond correlation of micro- and macrohardness measurements with conventional plastic stress–strain behaviors, there are modern considerations of size-scale influences, at lower loads, for nano-indentation plasticity and, at higher loads, for micro-cracking behaviors; in the latter case, particularly for more brittle materials [Reference Armstrong, Walley and Elban65]. Figure 11 provides an example of both considerations for hardness indentations spanning a large range in load values applied to indentations made on silicon single crystals [Reference Armstrong, Ruff and Shin66].
Log/log representation of load versus spherical ball diameter, or indentation diagonal length, or crack extension for sharp (diamond pyramid) indentations on silicon crystal surfaces. [Reference Armstrong, Mecholsky, Shin and Tsai67]

For a spherical ball indentation or spherically rounded tip of a sharp indenter, either one being of diameter, D, there is elastic contact that is describable on a Hertzian basis. Such behavior is shown in the lower left corner of Fig. 11 at the elastic plastic transition calculated for the load, P, versus elastic contact diameter, d, that is obtained from measurement of the vertical contact displacement, d e = [2h eD]1/2. A value of D = 0.1 μm is shown to apply for the calculation. The load dependence on D −1 and d e3 follows the Hertzian relationship:
 $$\eqalign{P = \,\left( {1 / {3D}} \right)\left[ \left\{ \left( {1 - {\nu _{\rm{B}}\hskip-1pt^2}} \right / {E_{\rm{B}}}\} \right\right \cr\quad+ \left\{ \left( {1 - {\nu _{\rm{S}}\hskip-1pt^2}} \right) / {E_{\rm{S}}} \right\} \right]^{ - 1}{d_{\rm{e}}}^3\quad .$$
In Eq. (9), the reciprocal factor in square brackets is known as the resultant elastic modulus, E r, and is determined by the Poisson ratio, νB for ball or νS for specimen, and Young’s modulus, E B for ball or E S for specimen. In the noted elastic/plastic region of Fig. 11, a decreasing hardness is seen to be measured relative to a line of slope 2 for several larger plastic d values. Such lower hardness at greater P values for a fixed-shape indenter has been termed an “indentation size effect” and appears to be attributable to more widely spread dislocations being initiated at greater indentation sizes.
At higher P values applied to the larger effective D values associated with diamond pyramid indentations in Fig. 11, cracking occurs and P follows an indentation fracture mechanics (3/2) dependence for the tip-to-tip crack diameter, d C, across the plastic indentation diagonal length, d i [Reference Armstrong, Mecholsky, Shin and Tsai67]. In this case that is to be described subsequently, there is an ultimate connection to be established with the H-P relationship. The ellipsoidal open and filled points in Fig. 11 are recently added from important diamond pyramid and Berkovich or cube corner indenter measurements, respectively, reported by Wan et al. [Reference Wan, Shen, Chen and Chen68]. The filled points are displaced to the right in Fig. 11 because of the cube corner indenter having a correspondingly greater effective (Tabor) strain, (d/D) = 0.82, compared with 0.375 for the diamond pyramid indenter and 0.42 for the Berkovich one [Reference Armstrong, Ruff and Shin66]. A (indentation) fracture mechanics stress intensity value of K C ≈ 1.0 MPa mm1/2 was determined by Wan et al. from the crack size dependence, d C3/2.
Crack size/grain size relationship
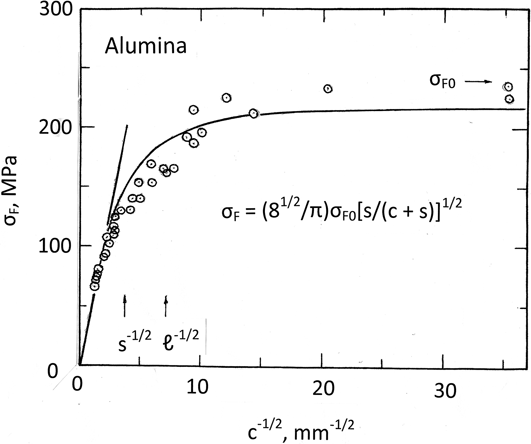
There is an analogous connection, as indicated in Eq. (1), between the Griffith-based fracture mechanics description of an inverse square root of crack size dependence for the brittle fracture stress of precracked material and the H-P–based pile-up model for an inverse square root of grain size dependence for the plastic flow and fracture stresses of crack-free material [Reference Armstrong, Armstrong, Antolovich, Griffiths and Knott69]. Also, it is now recognized that even the most brittle fracturing involves some degree of plasticity at a crack tip, no matter how sharp the crack tip might be [Reference Armstrong70]. Irwin appears to have been the first in modeling brittle crack growth in plane stress with a circular plastic zone of radius, r, at the crack tip [Reference Irwin, Burke, Reed and Weiss71]. Bilby, Cottrell, and Swinden (BCS) followed up with the description of the same problem but involving continuous distributions of dislocations to model both the crack stress and a strip-type plastic zone of size s [Reference Bilby, Cottrell and Swinden72]. The model description of a dislocation pile-up often involves using a continuous distribution of dislocations. The two descriptions are related through s = 2r. Knott has provided a review of dimensional size-scale considerations spanning fracture results from the atomic scale to macro-scale [Reference Knott, Armstrong, Antolovich, Griffiths and Knott73].
The BCS results for fracture stress, σF; dependence on crack size, c; and plastic zone size, s, were derived as a transcendental relationship that has been shown to be extremely well approximated by a modified inverse square root of crack size dependence given by [Reference Armstrong70]
 $$\eqalign{{\sigma _{\rm{F}}} = {\sigma _{{\rm{F}}0}}\left( {{2 / \pi }} \right){{\rm{s}}^{ - 1}}\left[ {\left( {{{c + s} / c}} \right)} \right] \cr\approx \left( {{{{8^{1/2}}} / \pi }} \right){\sigma _{{\rm{F0}}}}{\left[ {{s / {\left( {c + s} \right)}}} \right]^{1/2}}\quad .$$
In Eq. (10), σF0 was originally specified in the model description as the material yield stress, but in a later work, it was taken as a reference crack-free plastic fracture stress.
Figure 12 shows a comparison of experimental measurements reported for the tensile brittle fracture stress of polycrystalline alumina material reported by Zhang et al. [Reference Zhang, Hu, Sercombe, Li, Wu and Lu74], as fitted with Eq. (10). The material grain size was reported as ℓ = 20 μm and the parameters used in Fig. 12 are s = 66 μm and σF0 = 240 MPa. The value of s compares with a different estimation made by Zhang et al. of s = 60 μm on the basis of a log/log plot of σF versus c. One might also note that deviation from the Griffith inverse square root of crack size dependence occurs at a relatively low stress level just greater than 100 MPa. For the linear slope of the Zhang et al. dependence, a value of K C = 3.11 MPa mm1/2 is obtained. Hu and Liang [Reference Hu, Liang, Hsueh, Schmauder, Chen and Chawla75] have presented a related fracture mechanics review of elastic–plastic and quasi-brittle fracturing behaviors for a wide variety of structural materials, including an analogous σF−c description to that of Zhang et al. for AISI 1040 steel material (American Iron and Steel Institute, Washington, DC).
Tensile brittle fracture stress of polycrystalline alumina as a function of crack size.

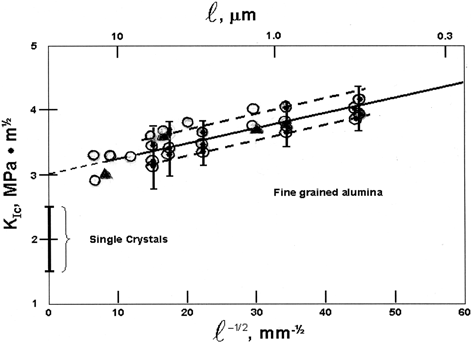
Equation (10) provides for the H-P–type grain size dependence of K C through σF0 [Reference Armstrong70]. A previous description had been given of other indentation-determined fracture mechanics measurements in plane strain reported for polycrystalline alumina material over a range of crack sizes and grain sizes [Reference Armstrong76]. Armstrong and Cazacu had followed up the work with a detailed description of the BCS result and application of the analysis to alumina and WC-Co measurements of K C [Reference Armstrong and Cazacu77]. Figure 13 shows the previous compilation of alumina indentation measurements on an H-P–type basis with additional updated inclusion of open circle K IC measurements reported for plane strain bend test experiments done by Usami et al. [Reference Usami, Kimoto, Takahashi and Shida78].
Compilation of K IC measurements for single crystal and polycrystalline alumina.

The range in K IC shown in Fig. 13 for single crystal measurements was obtained from the study by Rice [Reference Rice79]. Recently, Wang et al. have reported a complementary value of K IC = 1.63 MPa m1/2 for cracking at diamond pyramid indentations put into the (0001) plane of a sapphire crystal [Reference Wang, Jiang, Xu and Lu80]. The previously plotted centered circle and filled triangle measurements had been determined from measurements reported by Muchtar and Lim [Reference Muchtar and Lim81] and by Franco et al., respectively [Reference Franco, Roberts and Warren82]. The K C = 3.11 MPa m1/2 value at ℓ−1/2 = 7.1 mm−1/2 measurement reported by Zhang et al. [Reference Zhang, Hu, Sercombe, Li, Wu and Lu74] from the results in Fig. 12 is in agreement with the previous results. The H-P–type dependence for K IC determined on the basis of Eq. (10) is as follows:
 $${K_{{\rm{IC}}}} = {\left( {{8 / {3\pi }}} \right)^{1/2}}\left[ {{\sigma _{0{\rm{F}}}} + {k_{\rm{F}}}{\ell ^{ - 1/2}}} \right]{{\rm{s}}^{1/2}}\quad .$$
The linear H-P–type dependence in Fig. 13 gives an indication that s is a relatively constant parameter and seems to have been found to be relatively constant for a number of other cases [Reference Armstrong70].
Discussion
The effects of test specimen/grain size (crystal)/particle size and spacing/indentation probe/crack size on the strength, deformation, and fracturing of mostly metal and semiconductor silicon plus alumina (sapphire) ceramic materials have been presented in the foregoing description. Strength issues associated with one or only a few crystals in a test specimen cross section are becoming increasingly important for one reason because of the miniaturization of electronic and structural devices. Fu et al. have extended the size effect considerations presented by Meng and Fu [Reference Meng and Fu16] for processing copper sheet material by providing a review of geometrical and microscale size effects on current workpiece developments involved in manufacturing, including the use of an H-P description for grain size effect and taking into account weaker surface grains [Reference Fu, Wang and Korsunsky83]. For related purposes, Chen et al. have investigated the combined (weaker) surface layer model and H-P effect for a Cu–3 wt%–0.5 wt% Zr alloy, with the addition of precipitation hardening [Reference Chen, Yi, Xu, Zhang, Zhang and Wang84].
Armstrong had pointed out that the plane stress consideration of yielding through the thickness of thin film material produced the interesting condition of screw dislocation pile-ups spreading across the foil and being mainly obstructed by grain boundaries traversing the specimen thickness [Reference Armstrong85]. Lee et al. have reported somewhat reduced H-P k values for thin copper films tested at ambient temperatures and 398 and 423 K [Reference Lee, Ha, Park and Lee86]. Wu et al. have reported relatively high H-P k values determined by hardness testing of deposited thin nanocrystalline titanium films containing a high density of stacking faults [Reference Wu, Zhang, Li, Wang, Cui, Liu and Sun87]. An et al. investigated the specimen thickness effect for low temperature–rolled ultrafine copper material processed by equal channel angular pressing (ECAP) and subjected to tensile testing [Reference An, Wang, Wang, Cao and Huang88].
Experimental measurements were reported also for the grain size–dependent SRS that was found to be increased at smaller grain sizes because of the dislocation pile-up/grain boundary interaction, which is in general agreement with Eq. (8). Otherwise, the specimen thickness effect was attributed to the weaker strength of surface grains. Okamoto et al. investigated the combined specimen size and grain size effect in compression tests of nanocrystalline copper pillars to find H-P–extrapolated grain size strengthening at ℓ = 360 and 100 nm and weakening at ℓ = 34 nm [Reference Okamoto, Kashioka, Hirato and Inui89]. The grain size–induced softening was attributed to diffusional creep. Such observation of grain size weakening possibly provides an explanation of the findings of Ghosh and Chokshi [Reference Ghosh and Chokshi90]. for compiled measurements on a number of metal systems showing an increase or decrease in strength as the number of grains in test specimen cross section is increased; this appears to contradict generally the specimen size effect shown for aluminum in Fig. 1.
Such results that have been presented show that material processing to obtain a fine grain size for the advantage of H-P strengthening is an important activity. Severe plastic deformation (SPD) is foremost among the procedures utilized for metals and alloys. Vinogradov and Estrin have produced a seminal review on SPD, including a detailed description of the ECAP method [Reference Vinogradov and Estrin91]. The resultant material structures relate to the structural parameters described in Eq. (4) and schematically illustrated in Fig. 6. Example metal ECAP measurements have been reported for aluminum [Reference Koizumi and Kurado92], Al-5483 alloy [Reference Bazarnik, Huang, Lewandowska and Langdon93], AA6063 aluminum alloy [Reference Najafi, Eivani, Samaee, Jafarian and Zhou94], Armco iron [Reference Muñoz, Higuera and Cabrera95], and α-titanium [Reference Luo, Hu and Wu96]. Connection with H-P description has been made in all of the referenced cases, including measurements of both components of subgrain and grain boundary strengthening associated with low-angle and high-angle grain boundaries. Cao et al. have produced a comprehensive review on microstructural evolution during SPD processing [Reference Cao, Ni, Liao, Song and Zhu97]. In the extensive review, an empirical addition of strengthening terms is described, especially including evaluation of H-P grain size influence.
The patented eutectoid steel wire measurements given in Fig. 5 and the H-P description included in Table I constitutes an historical example of SPD first described in the late 19th century by Percy [Reference Percy98]. Reasonably current investigations of SPD-processed pearlite have been reported by Kammerhofer et al. [Reference Kammerhofer, Hohenwarter, Scheriau, Brantner and Pippan99] and by Mishra and Singh [Reference Mishra and Singh100], each with nano-scale strength measurements commensurate with those shown in Fig. 5. Zhao et al. [Reference Zhao, Park, Tian, Chen, Shibata and Tsuji101] have achieved ultra-grain size refinement comparable to that achieved via SPD in a 10Ni–0.1C steel by means of thermomechanical processing, and Field and van Aiken [Reference Field and van Aiken102] have achieved comparable strength levels in a 11.5Mn–0.11C steel subjected to transformation-induced plasticity processing via cold rolling.
In most cases, such strengthening via SPD is achieved at the expense of reducing the material ductility. Two studies on alleviating the problem have been recently reported: first, for steel by He et al. [Reference He, Hu, Yen, Cheng, Wang, Luo and Huang103] and, second, for aluminum strengthened with nano-TiB2 particles by Liu et al. [Reference Liu, Chen, Zhang, Ji, Wang, Ma, Ji, Zhong, Wu and Wang104]. In the first case, He et al. accomplished the purpose for a medium manganese steel with a partitioned martensitic and retained austenitic nano-structure. In the second case, an enhanced local increase in dislocation density associated with the presence of nano-particles added to the material strengthening while retarding the onset of fracturing by hole joining of the reasonably dispersed particles. Mukai and Higashi had earlier reported H-P and improved ductility results for an ultrafine-grained Al–14 wt% Ni–14 wt% Mm alloy subjected to dynamic tensile deformation [Reference Mukai and Higashi105]. The alloy also failed by transgranular fracturing with associated ductile dimples. Such improvement in ductility through reduction in importance of the hole-joining mechanism relates to the very significant grain-size enhancement of ductility shown for the transgranular failure mechanism described for magnesium in Fig. 8. Ovid’ko et al. have reviewed the issue of attempting to achieve superior strength and ductility in metallic nano-structured materials [Reference Ovid’ko, Valiev and Zhu106].
The method of material processing influences the crystal orientation–dependent texture of the resultant material as well as the material grain size. Pioneering work had been done by Wilson and Chapman on texture development in magnesium and the resultant H-P consequences [Reference Wilson and Chapman107]. Two recent reports have provided important updated reviews for magnesium, especially including a comprehensive compilation of H-P measurements for AZ31 alloy material [Reference Wang and Choo108, Reference Yu, Xin, Wang and Liu109]. Yu et al. have reported on the texture and H-P aspects of slip versus twinning [Reference Yu, Li, Xin, Chapuis, Huang and Liu110]. Yuan et al. have reported on coupled H-P and texture influences on the yield strength of nano-grain copper and nickel materials [Reference Yuan, Beyerlein and Zhou111].
While the present report on size effects has dealt largely with demonstrations of ongoing experimental connections, it should be mentioned that considerable developments have been underway on the dislocation mechanisms responsible for determining the respective material constitutive behaviors and fracturing processes. Realistic modeling is being pursued of the dislocation pile-up mechanism proposed for slip band behavior in accounting for the H-P relation; see, for example, the transition from an ℓ−1/2 to an ℓ−1 dependence for the steel results shown in Fig. 5 compared with earlier prediction of the transition for ultrafine-grained copper behavior [Reference Armstrong, Smith, Suryanarayana, Singh and Froes112], as well as the predicted grain size enhancement of the activation volume, v*, parameter, first for monitoring grain size strengthening and then for further enhancing for grain size weakening, as shown in Fig. 10 [Reference Armstrong27]. Reasonably strong correlation has been established for the FCC k values being controlled by cross-slip [Reference Armstrong26]. The connection between dislocation pile-up and crack behavior, first described in accordance with the original Petch measurements for cleavage fracturing of steel materials, was extended to account for grain size influence in fracture mechanics stress intensity, K IC, measurements [Reference Armstrong and Liebowitz41, Reference Armstrong76, Reference Petch and Armstrong113], as now updated in Fig. 13. The physical basis for a larger stress intensity being measured for a reasonably ductile material at smaller grain size comes from the yield stress in the plastic zone being raised by grain size refinement but the fracture stress being raised more because of its stronger H-P dependence, and therefore leading to the requirement of greater plastic work hardening being associated with brittle crack growth.
Summary
Multi-crystal specimen size and microstructural size effects have been described for the improvement of mechanical strength and plastic deformation properties obtained for a number of FCC, body-centered cubic (BCC), and HCP metal and alloy systems, especially including consideration of specimen size and grain size effects on material ductility. The material strength properties include, for example, hardness test measurements compiled on electrodeposited nickel materials. H-P–related SRS measurements are shown to provide a sensitive marker for grain size–dependent material strengthening and weakening behaviors. A compilation of silicon crystal hardness measurements illustrates at low loads a “nano-indentation size effect” and, at higher microloads, it is used to characterize indentation fracture mechanics behavior. Special attention is given to the connection between the H-P grain size dependence for brittle fracturing and the Griffith crack size dependence. The Griffith-connected dislocation pile-up mechanics description for the H-P relationship is extended past description of polycrystal plastic stress–strain behavior to describe the fracture mechanics stress intensity, K IC, of (sapphire) alumina material, also with the inclusion of an important dependence attributed to the omnipresent crack tip plastic zone size.
Acknowledgments
Appreciation is expressed to Professor Irene Beyerlein and fellow guest editors for the invitation to contribute to the Special Focus Issue on “Intrinsic and Extrinsic Size Effects in Materials.”