The speech signal simultaneously presents listeners with two sources of information: linguistic and indexical (Abercrombie, Reference Abercrombie1967). Linguistic properties of the speech signal include the sounds and morphosyntactic patterns that make up the intended message of the utterance. In contrast, indexical properties of the speech signal transmit information about the talker, such as emotion, age, gender, and regional dialect. Variation in speech arises from both sources of information in the signal. Listeners, however, have the ability to quickly adapt to such across-talker pronunciation variation (Marslen-Wilson, Moss, & van Halen, Reference Marslen-Wilson, Moss and van Halen1996; Maye, Aslin, & Tanenhaus, Reference Maye, Aslin and Tanenhaus2008), which is an ability that is essential for successful speech communication. For efficient speech processing, listeners must be able to recognize words even when their acoustic–phonetic realizations differ due to indexical talker characteristics. This principle, known as phonological constancy, begins developing in the second year of life (Best, Tyler, Gooding, Orlando, & Quann, Reference Best, Tyler, Gooding, Orlando and Quann2009). Developing robust word recognition skills involves acquiring the phonological contrasts that differentiate word meanings as well as knowledge of how indexical and sociocultural phonetic variation can alter the acoustic–phonetic realization of words without changing their meaning.
The ability to distinguish among varieties of a language is a sociocultural and metalinguistic skill that starts to develop early in the course of first language acquisition. Very early in development, infants are able to discriminate between native and nonnative speakers of the ambient language, as well as between familiar and unfamiliar native regional varieties (Butler, Floccia, & Panneton, Reference Butler, Floccia, Goslin and Panneton2011; Kinzler, Dupoux, & Spelke, Reference Kinzler, Dupoux and Spelke2007). By 5 years of age, children can explicitly categorize native and nonnative speakers; and by 7, they can also explicitly categorize talkers of regional varieties (Floccia, Butler, Girard, & Goslin, Reference Floccia, Butler, Girard and Goslin2009; Girard, Floccia, & Goslin, Reference Girard, Floccia and Goslin2008; Wagner, Clopper, & Pate, Reference Wagner, Clopper and Pate2013). By adulthood, familiarity with specific language varieties plays a significant role in shaping listeners’ interpretation of phonological information during speech processing tasks (Floccia, Goslin, Girard, & Konopczynski, Reference Floccia, Goslin, Girard and Konopczynski2006; Sumner & Samuel, Reference Sumner and Samuel2009; Witteman, Weber, & McQueen, Reference Witteman, Weber and McQueen2013). For example, listeners are faster at processing their home accent than an unfamiliar accent (Adank, Evans, Stuart-Smith, & Scott, Reference Adank, Evans, Stuart-Smith and Scott2009). Moreover, the processing delays observed with unfamiliar accents can lessen as the listeners’ exposure to the unfamiliar accent increases (Floccia et al., Reference Floccia, Goslin, Girard and Konopczynski2006). Similarly, listeners do not show semantic priming effects to words produced in an unfamiliar dialect, whereas listeners who are familiar with the regional dialect show robust semantic priming effects for primes produced in both the regional and the general dialect (Sumner & Samuel, Reference Sumner and Samuel2009).
For native listeners, familiarity with regional dialects improves recognition of the linguistic information in speech intelligibility tasks. Despite this recognized significance of experience with specific linguistic varieties for linguistic processing in a listener's native language, most of the research on and models of second language perception have primarily focused on the perception of phonetic or phonological contrasts in the second language (e.g., Best, McRoberts, & Goodell, Reference Best, McRoberts and Goodell2001; Flege, Reference Flege and Strange1995; Kuhl et al., Reference Kuhl, Conboy, Coffey-Corina, Padden, Rivera-Gaxiola and Nelson2008). In addition to learning to distinguish phonological contrasts, second language learners must also acquire robust perceptual strategies to recognize words that contain high acoustic–phonetic variability, as native listeners do automatically in first language development. However, the possibility that second language learners’ experience with indexical variation could also play a role in their linguistic processing skills in the second language has not yet been extensively explored. One study has shown that nonnative listeners do not always exhibit the same linguistic processing benefit for the familiar or local regional dialect as native listeners do (Fox & McGory, Reference Fox, McGory, Bohn and Munro2007). Specifically, Japanese learners of English living in Alabama (local dialect: Southern American) were not better at identifying Southern American vowels than were their counterparts living in Ohio (local dialect: General American); among native listeners, in contrast, those living in Alabama significantly outperformed those living in Ohio (Fox & McGory, Reference Fox, McGory, Bohn and Munro2007).
Despite the lack of a familiarity-based speech intelligibility benefit with regional dialects (Fox & McGory, Reference Fox, McGory, Bohn and Munro2007), nonnative listeners show a linguistic processing advantage for familiar nonnative accents. The interlanguage speech intelligibility benefit (ISIB) is a description of situations in which second language learners understand foreign-accented speech as well as or better than native speech (Bent & Bradlow, Reference Bent and Bradlow2003). In particular, many studies have found that nonnative listeners outperform native listeners in foreign-accented speech intelligibility tasks, a phenomenon known as the ISIB for listeners, when the talker and listener shared a native language (Bent & Bradlow, Reference Bent and Bradlow2003; Hayes-Harb, Smith, Bent, & Goslin, Reference Hayes-Harb, Smith, Bent and Bradlow2008; Stibbard & Lee, Reference Stibbard and Lee2006; Xie & Fowler, Reference Xie and Fowler2013). The ISIB is modulated by listener proficiency in the second language, such that lower proficiency listeners show a greater ISIB than their higher proficiency counterparts (Hayes-Harb et al., Reference Hayes-Harb, Smith, Bent and Bradlow2008; Pinet, Iverson, & Huckvale, Reference Pinet, Iverson and Huckvale2011; Xie & Fowler, Reference Xie and Fowler2013). Furthermore, the listeners’ language environment can modulate the ISIB. Specifically, native Mandarin speakers living in Beijing (nonimmersion English learners) found Mandarin-accented English to be more intelligible than native English. Native Mandarin speakers living in the United States (immersion learners), in contrast, found both Mandarin-accented and native English to be similarly intelligible (Xie & Fowler, Reference Xie and Fowler2013).
The amount of experience and familiarity with specific accents has been shown to enhance nonnative listeners’ performance on metalinguistic tasks, such as accent identification. For example, when tested on their ability to identify native accents in an open-set identification task (Ladegaard, Reference Ladegaard1998) or a four-alternative forced-choice task (Jarvella, Bang, Jakobsen, & Mees, Reference Jarvella, Bang, Jakobsen and Mees2001), Danish listeners were more accurate at identifying American and British English talkers compared to other native varieties such as Irish, Scottish, Cockney, or Australian. Cockney and Australian talkers, speakers of the least familiar varieties, were rarely correctly identified (Ladegaard, Reference Ladegaard1998). Similarly, in an open-set accent identification task, South Korean listeners were most successful at identifying American and British accents and least successful in identifying the less familiar Australian English and African American Vernacular English (Yook & Lindemann, Reference Yook and Lindemann2012). More than half of these South Korean listeners did not identify the African American Vernacular English talker in the study as a native speaker of English. Yook and Lindemann (Reference Yook and Lindemann2012) included a nonnative variety (Korean-accented English) as one of the accents to be identified. They found that listeners were just as accurate at identifying the Korean talker's accent as they were with the British accent. Accent familiarity, therefore, benefits nonnative listeners’ ability to identify English spoken with their own accent, as well as the specific native varieties to which they have been exposed.
Two studies have compared nonnative listeners’ accent classification performance with that of native listeners; both examined the classification of regional accents (Clopper & Bradlow, Reference Clopper and Bradlow2009; Ikeno & Hansen, Reference Ikeno and Hansen2007). In both studies, nonnative listeners were consistently less accurate than were native listeners at classifying native talkers by regional accent. Specifically, in an accent matching paradigm in which listeners matched novel talkers of three UK accents (Irish, British, and Welsh) to a set of training talkers, British and American listeners were both found to be significantly more accurate than nonnative listeners (Ikeno & Hansen, Reference Ikeno and Hansen2007). Similarly, when grouping American talkers by regional accent in an auditory free classification task, nonnative listeners were less accurate in their accent classification than were native listeners (Clopper & Bradlow, Reference Clopper and Bradlow2009). Nevertheless, cluster analysis revealed similar perceptual dialect similarity spaces between native and nonnative listeners, suggesting that native and nonnative listener groups applied a similar classification strategy. In both of these studies, listeners were not provided with explicit accent labels, nor were they asked to identify the accents. These tasks can be interpreted to be more representative of the listeners’ ability to recognize the relevant acoustic–phonetic features that index across-category differences, rather than their knowledge of accurate category labels. Nonnative listeners, therefore, appear to have insufficient knowledge of the fine details of accent features that are relevant for making nativelike judgments of the similarity between different native regional accents.
The decrement found for nonnative listeners’ perception of native English varieties could be because relative to native listeners, nonnative listeners are likely to have had less exposure to the full range of sociocultural phonetic variations in English. For native listeners, lack of experience with regional varieties has been shown to negatively affect their ability to accurately categorize regional dialects (Clopper & Pisoni, Reference Clopper and Pisoni2004a). Specifically, native listeners who lived in at least three dialect regions in the United States performed more accurately on a dialect categorization task than did those who had only lived in one dialect region. It may be the case that nonnative listeners have not had the necessary experiences to create robust representations for the phonetic and phonological characteristics of multiple, native English varieties (Clopper & Bradlow, Reference Clopper and Bradlow2009). Unlike experiences with native varieties of English, however, nonnative listeners would have at least as much experience with nonnative speech as would native listeners. Therefore, similar to the ISIB for listeners effects discussed above (Bent & Bradlow, Reference Bent and Bradlow2003; Hayes-Harb et al., Reference Hayes-Harb, Smith, Bent and Bradlow2008; Stibbard & Lee, Reference Stibbard and Lee2006; Xie & Fowler, Reference Xie and Fowler2013), nonnative listeners may show equivalent or better accuracy for classification of nonnative talkers with whom they share a native language compared to native listeners. Such a result would further suggest that the lower performance on regional dialect classification tasks by nonnative listeners reported in past studies may simply have been due to nonnative listeners’ lack of experience with specific varieties of English.
It is difficult to make direct comparisons of the results reported in the previous studies on nonnative listeners’ accent classification because of the different methodologies employed. Specifically, studies that used open-set responses to assess listeners’ perception of talkers’ nationality or country of origin varied widely in the leniency with which identification responses were counted as correct (Ladegaard, Reference Ladegaard1998; Yook & Lindemann, Reference Yook and Lindemann2012). Studies also differed on the number of accents tested, ranging from three (Ikeno & Hansen, Reference Ikeno and Hansen2007) to five (Ladegaard, Reference Ladegaard1998); as well as the number of unique talkers representing each accent, from one talker per accent (Ladegaard, Reference Ladegaard1998) to five talkers per accent (Clopper & Bradlow, Reference Clopper and Bradlow2009). Furthermore, only two studies have compared the performance of native and nonnative listeners (Clopper & Bradlow, Reference Clopper and Bradlow2009; Ikeno & Hansen, Reference Ikeno and Hansen2007). In the current study, an auditory free classification task was used to examine both native and nonnative listeners’ classification of one native and multiple nonnative accents.
Auditory free classification tasks allow listeners to classify multiple accents without providing explicit response labels (Clopper, Reference Clopper2008). Unlike identification or categorization tasks, a free classification task does not require listeners to be able to accurately label the perceived accent groups. Listeners simply need to recognize when there are shared accent characteristics across talkers. Application of the free classification task to study the perceptual representations of regional dialects among native listeners found that listeners made more fine-grained distinctions between dialects in free classification tasks than in conventional forced-choice categorization tasks (Clopper & Pisoni, Reference Clopper and Pisoni2007). Moreover, the results of free classification tasks can be analyzed for both classification accuracies and perceptual similarity structures.
Native listeners are highly sensitive to the presence of a nonnative accent and can distinguish between native and nonnative speech with very little phonetic information (Flege, Reference Flege1984; Park, Reference Park2013). Native listeners, however, do not have the same level of sensitivity for distinguishing among nonnative accents (Atagi & Bent, Reference Atagi and Bent2013; Derwing & Munro, Reference Derwing and Munro1997; Vieru, Boula de Mareüil, & Adda-Decker, 2011), using instead the nonnative talkers’ degree of accentedness as an organizational scheme (Atagi & Bent, Reference Atagi and Bent2013). Native listeners’ lack of subdivisions among nonnative accent categories may result from listeners evaluating nonnative speech relative to their own speech. Specifically, listeners may perceptually scale accents based on the extent of phonological deviation from their own speech, rather than attending to the specific acoustic–phonetic features that distinguish among particular nonnative accents (Atagi & Bent, Reference Atagi and Bent2013). For this explanation to be supported, nonnative listeners’ perceptual representation for nonnative accents would need to have a different pattern of perceptual organization compared to native listeners and nonnative listeners with different native languages. That is, if a general mechanism for perceiving dialects and accents is to scale the perceived speech with respect to the listeners’ own speech, then nonnative listeners’ perceptual scale will have a nonnative variant as the baseline. With a nonnative baseline, accents closest to the baseline would be the nonnative accents of talkers with whom the listener shares a native language; the perceptual scale of nonnative listeners would, therefore, have a fundamentally different starting point than the baseline of native listeners.
In summary, the existing literature on nonnative listeners’ perception of indexical variation in their second language suggests that nonnative listeners’ skills are less developed relative to native listeners. Nonnative listeners demonstrate poor performance in accent identification, categorization, and classification tasks, most of which have included regional varieties (Clopper & Bradlow, Reference Clopper and Bradlow2009; Ikeno & Hansen, Reference Ikeno and Hansen2007; Ladegaard, Reference Ladegaard1998; Yook & Lindemann, Reference Yook and Lindemann2012). However, nonnative listeners’ underlying representation for variation in their second language remains unclear. The current study was designed to further investigate listeners’ perception and representations of indexical variation in a second language, using the auditory free classification paradigm. Moreover, in contrast to the previously described study in which only one nonnative talker was included (Yook & Lindemann, Reference Yook and Lindemann2012), the classification stimuli in the current study consisted of six nonnative varieties as well as one native variety, with four talkers representing each variety. Furthermore, to assess the role of linguistic background and experience on accent classification, the current study compared two groups of nonnative listeners’ performance to that of native listeners. The previous finding that native listeners scale their perception of nonnative speech to their own speech (Atagi & Bent, Reference Atagi and Bent2013) suggests that both native and nonnative listeners may differentiate the accent corresponding to their native language from all other accents. Therefore, to assess this account, the current study tested the following three hypotheses.
First, native and nonnative listeners are predicted to show a classification benefit for the accent group that matches their own native language in both classification accuracy and perceptual distinctiveness. Specifically, in classification accuracy, each listener group is predicted to be more accurate than the other listener groups in classifying the accent group that matches their native language background. Furthermore, the perceptual similarity spaces for each listener group are expected to contain a group of talkers with the same native language background as the listener group that is differentiated from all other talkers.
Second, the nonnative listeners are hypothesized to find two accents to be perceptually distinct: those of talkers with whom they share a native language background (first hypothesis, above) and those of the native talkers. Native talkers in the current study spoke the dialect that is local to the listeners’ current residence. For the nonnative listener groups, therefore, analysis of the perceptual similarity space for talkers is predicted to also exhibit a distinct group of native talkers. In contrast to nonnative listeners, native listeners without extensive or systematic exposure to nonnative speakers would not be expected to have distinct representations for any of the nonnative accents.
Third, nonnative listeners’ overall classification accuracy may reflect their perceptual sensitivities, both to the accents of talkers with whom they share a native language and to the native talkers. Even if native listeners are more accurate than the nonnative listeners in specifically classifying native talkers (as predicted in the first hypothesis), nonnative listeners may show an advantage in classification accuracy across all talkers, due to their familiarity with two accents. Therefore, if nonnative listeners find both of these accent groups to be perceptually distinct (as predicted in the second hypothesis), their overall classification accuracy may be relatively higher than that of the native listeners. The current study, therefore, compared the listener groups’ overall accuracies on the free classification task to test the third hypothesis, that nonnative listeners’ overall classification accuracy will be better than that of native listeners.
METHODS
Listeners
Three groups of listeners were recruited in Bloomington, Indiana: monolingual native speakers of English (native listeners, N = 28), native speakers of Korean (Korean listeners, N = 25), and native speakers of Spanish (Spanish listeners, N = 24). All listeners were paid for their participation. Two groups of nonnative listeners were selected to test the effects of specific native language backgrounds on nonnative accent perception, rather than a broad difference between native and nonnative listeners. By testing two groups of nonnative listeners, the current study could examine the differences between native and nonnative listeners as well as the differences between two nonnative listener groups with different language backgrounds. Specifically, speakers from the two largest language communities in Bloomington, native speakers of Korean and Spanish, were selected to be the nonnative listener groups. These two native languages also have distinct phonologies, typologies, and histories, as well as sociocultural backgrounds.
All listeners were screened for normal hearing thresholds and reported no history of speech or hearing impairment. The data from the native listeners presented here were a part of a separate study (Atagi & Bent, Reference Atagi and Bent2013). The mean age of the native listeners (21 female, 7 male) was 22.6 years with a range of 19–38 years. All native listeners reported being raised in the United States, mostly in the Midwest: Indiana (N = 17), Illinois (N = 3), Ohio (N = 2), Michigan (N = 2), Missouri (N = 1), Massachusetts (N = 1), and Nevada (N = 1). Although none of the native listeners were conversationally proficient in any language other than English, 26 reported having studied one to five of the following languages: Spanish (N = 20); French (N = 6); German (N = 4); Japanese (N = 4); Russian (N = 2); and Portuguese, Italian, Polish, Turkish, Finnish, Akan, and Modern Hebrew (N = 1 for each).
The mean age of the Korean listeners (16 female, 9 male) was 25.0 years with a range of 20–33 years. All Korean listeners were born and raised in South Korea. On average, they started studying English in South Korea at the age of 11.3 years (range = 5–18 years) and had resided in English-speaking countries for 2.8 years (range = 0.2–7 years). All but one Korean listener had had at least 1 year of formal English instruction in South Korea (mean = 8 years, range = 0–12 years). Though none of the Korean listeners reported proficiency in a language other than Korean and English, 17 had studied one to four languages other than English: Mandarin (N = 11), Japanese (N = 7), French (N = 5), Spanish (N = 2), German (N = 1), and Arabic (N = 1).
The mean age of the Spanish listeners (9 female, 15 male) was 28.8 years with a range of 20–41 years. The Spanish listeners’ places of origin spanned nine Spanish-speaking countries/regions: Spain (N = 4), Mexico (N = 7), Chile (N = 3), Colombia (N = 3), Puerto Rico (N = 3), Ecuador (N = 1), Nicaragua (N = 1), Costa Rica (N = 1), and Peru (N = 1). Spanish listeners had on average started studying English in their home country at the age of 11.4 years (range = 4–19 years) and resided in English-speaking countries for 2.7 years (range = 0.1–10 years). All but 2 of the Spanish listeners had had at least 1 year of formal English instruction in their home countries (mean = 7 years, range = 0–20 years). Though none of the Spanish listeners reported proficiency in a language other than Spanish and English, 10 had studied one or two languages other than English: French (N = 7), Italian (N = 2), Modern Hebrew (N = 2), German (N = 1), and Yiddish (N = 1).
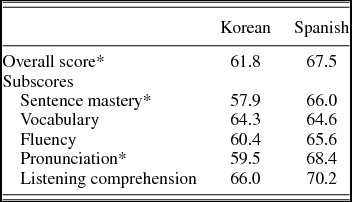
The Korean and Spanish listener groups did not differ significantly in the age at which they started studying English, t (32.88) = 0.11, p = .92, or in their length of residency in English-speaking countries, t (38.32) = –0.11, p = .92. In addition, after the completion of the experiment, the Korean and Spanish listeners completed a commercial, standardized English proficiency test, Pearson Education's VERSANT Test of Spoken English (Pearson Education, 2011). The VERSANT test is an automated evaluation of spoken English that is conducted over the telephone. The results of the VERSANT test, which are reported as standard T scores (i.e., normal distribution scale of 20–80 with 50 as the mean), revealed that the nonnative listeners who participated in this study were intermediate to very high proficiency learners of English. For the Korean listeners, the range of overall proficiency was 54–78, and for the Spanish listeners it was 50–80. Table 1 shows the average overall scores and subscores for each area tested. A two-tailed Welch t test revealed that the Korean listeners were overall less proficient than the Spanish listeners, t (44.02) = –2.73, p = .009, d = 0.78. Two-tailed Welch t tests were also applied on the subscores, which indicated that the Spanish listeners received significantly higher scores than the Korean listeners in two areas: sentence mastery, t (41.87) = –3.43, p = .001, d = 0.99, and pronunciation, t (46.98) = –3.24, p = .002, d = 0.93. The two nonnative listener groups’ levels of vocabulary, fluency, and listening comprehension did not differ significantly.
Mean VERSANT scores (standard T scores) for the two nonnative listener group
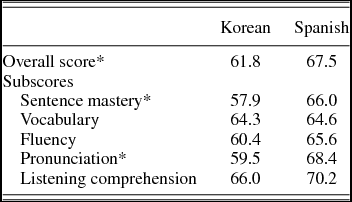
*Significantly different (p < .01) scores between the two listener groups.
Stimuli
Stimuli for the current study were selected from the Hoosier Database of Native and Nonnative Speech for Children (Atagi & Bent, Reference Atagi and Bent2013; Bent, Reference Bent2014), which is a database that contains recordings of words, sentences, and paragraphs that are lexically and syntactically at the appropriate level for use with children. Specifically, the current paper reports the results from two free classification tasks that used two sentences from the Hearing in Noise Test—Children's Version (Nilsson, Soli, & Gelnett, Reference Nilsson, Soli and Gelnett1996): “The ice cream is melting” and “The grocer sells butter.” These sentences were selected to represent the range of intelligibility exhibited by these nonnative talkers (according to native listeners’ orthographic transcription of key words), such that the first sentence was highly intelligible across all talkers and the second sentence was on average a less intelligible sentence (for more details about these intelligibility scores, see Atagi & Bent, Reference Atagi and Bent2013). Within each classification set, all talkers produced the same sentence. By using the same sentence across all talkers for each classification set, effects of intelligibility on task performance are reduced.
The stimuli were read by a total of 28 talkers, including 24 nonnative talkers from six native language backgrounds and 4 native talkers (two females and two males from each language background). The native languages of these talkers were American English (Midland dialect), French (from France), German (from Germany), Spanish (from Colombia), Japanese, Korean (Seoul dialect), and Mandarin (Beijing dialect). At the time of recording, all nonnative talkers had spent 4 years or less in the United States or any other English-speaking country, and they were only proficient in their native language and English (as a second language).
Procedure
Before the start of the experiment, listeners completed a language background questionnaire and a hearing screening. In addition to instructions given on the computer screen, the experimenter gave verbal instructions to all listeners. Custom software designed in Python and run through a Mac Mini was used for stimulus presentation and data collection. Listeners were seated in front of a Viewsonic 20-in. VX2033wm widescreen liquid-crystal display monitor in a sound-treated booth, and stimulus items were presented binaurally in quiet at approximately 68 dB SPL through Sennheiser HD 280 pro headphones.
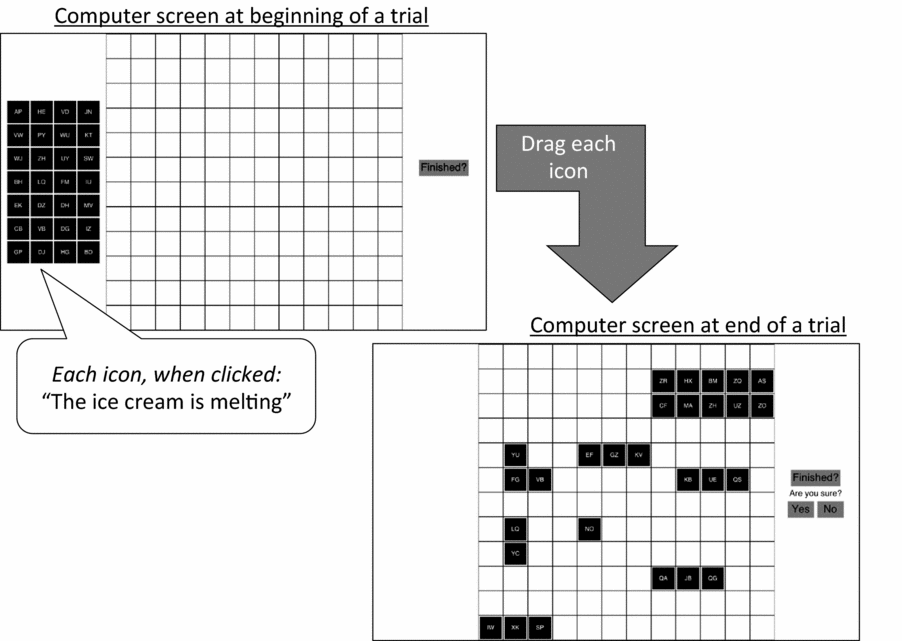
The current paper reports on the results from two auditory free classification task sets, completed as part of a larger study for which listeners completed a total of eight (native listeners) or six (Korean and Spanish listeners) free classification task sets. These free classification tasks were designed following the descriptions given in Clopper (Reference Clopper2008; Figure 1). In each set, listeners were presented with an empty 12 × 12 grid, with 28 “icons” to the left of the grid. These icons, when clicked, played a sentence produced by 1 of the 28 talkers. Listeners were able to listen to these speech samples in any order, as many times as they needed. All listeners were given both verbal and written instructions prior to starting the task. For nonnative listeners, visual aids paralleling the verbal instructions were also provided to ensure comprehension of the task procedure. The visual aids were created with a screenshot of the free classification task at the beginning of a set, as well as a few examples of completed classifications.
Auditory free classification task procedure (one set).

Within each free classification set, all talkers produced the same sentence; the order in which the sentence was presented was counterbalanced across listeners. Listeners were instructed to group the talkers by perceived native language by dragging each icon onto the grid and making groups of icons on the grid. Listeners could take as long as they liked to complete each classification task and were able to form as many groups with as many speakers in each group as they wished.
RESULTS
Free classification accuracy
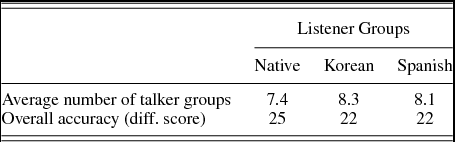
Descriptive results for the number of talker groups created and overall classification accuracy for each listener group are presented in Table 2 (averaged across the two instances of free classification completed by each listener). The three listener groups did not significantly differ in the number of talker groups created, F (2, 74) = 0.86, p = .43. Overall classification accuracy for each listener group was measured by its mean overall difference score, which takes into account the number of talker groups that each listener created. This difference score is calculated by taking the difference of mean percent correct pairings and mean percent pairwise errors for each listener (Clopper & Bradlow, Reference Clopper and Bradlow2009). Percent correct pairings are the correct talker pairings by native language background out of the total possible number of correct talker pairings. Talker pairings were considered correct when two talkers with the same native language background were grouped together. Percent pairwise error is calculated based on the number of pairwise talker language background mismatches out of the total possible number of incorrect pairings. Talker pairings were considered an error when two talkers with different native language backgrounds were grouped together. The difference score is on a scale of –100 to 100, where a negative difference score indicates a higher percentage of pairwise errors and a positive difference score indicates a higher percentage of correct pairings. The three listener groups did not differ significantly in their overall classification accuracy as measured by their overall difference scores, F (2, 74) = 0.87, p = .42.
Summary of overall classification performance across listener groups
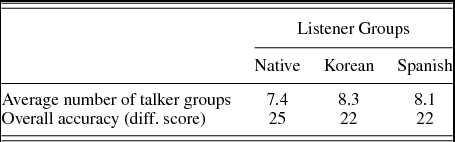
Note: The average number of talker groups created by each listener group and overall classification accuracy as measured by the mean difference score (i.e., difference score = mean percent correct pairings – mean percent pairwise errors) are shown.
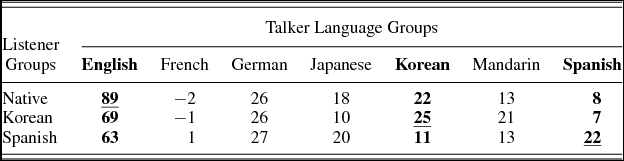
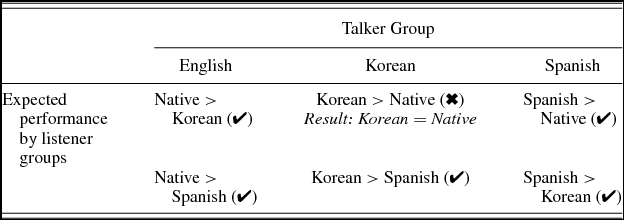
Classification accuracy was further calculated for each listener group by each of the talker native language backgrounds using the same calculation method described above (Table 3). To test the hypothesis that each listener group is more accurate at classifying its own accent than the other listener groups (Table 4), three one-way analyses of variance were conducted to compare the effect of the listeners’ native language on their classification accuracy of native, Korean, and Spanish talkers. There was a significant effect of native language on the classification of native talkers, F (2, 74) = 15.40, p < .001, η2p = 0.29, Korean talkers, F (2, 74) = 4.39, p = .016, η2p = 0.11, and Spanish talkers, F (2, 74) = 5.76, p = .005, η2p = 0.13. Post hoc comparisons using the Tukey honestly significant difference test indicated that native listeners’ classification of native talkers (M = 89, SD = 9) was significantly more accurate than both the Korean listeners’ (M = 69, SD = 21) and the Spanish listeners’ (M = 63, SD = 22) at p < .001. Similarly, Spanish listeners’ classification of Spanish talkers (M = 22, SD = 21) was significantly more accurate than those of native listeners (M = 8, SD = 17, p < .05) and Korean listeners (M = 7, SD = 10, p < .01), confirming the hypothesis. Korean listeners’ performance on the classification of Korean talkers (M = 25, SD = 21), however, did not differ significantly from that of native listeners (M = 22, SD = 17, p = .78); but it was more accurate than that of Spanish listeners (M = 11, SD = 14, p < .05).
Difference scores across listener groups
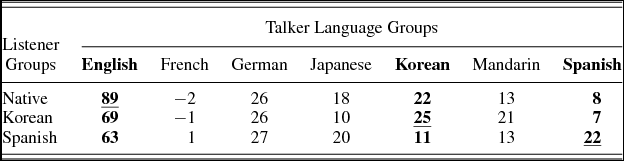
Note: Talker language groups that share their native language background with that of a listener group are in bold; matches in native language between listener and talker groups are also underscored.
Summary of each listener group's hypothesized classification accuracies (and corresponding results) for the three talker groups for which native language backgrounds match that of the listeners
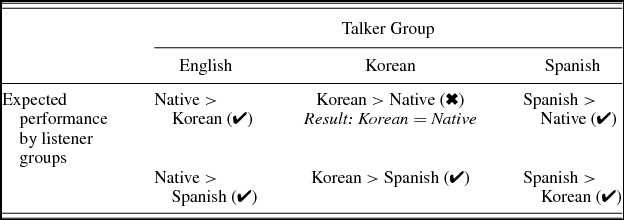
Note: Each cell indicates how each listener group is expected to perform relative to each other on the classification of the talker group specified in each column. Confirmed hypotheses are indicated with a check mark (✔); the unconfirmed hypothesis is indicated with an x (✖), followed by the observed result in italics.
Cluster analysis
To examine the underlying perceptual similarity structure and organization of talkers for the three listener groups, results were analyzed using an additive cluster analysis (Sattath & Tversky, Reference Sattath and Tversky1977). Whereas the difference score shows the overall pattern of classification accuracy across or within talker native language groups, the cluster analysis visually depicts the classification pattern as a set of perceptual similarities. By finding the best fit of the perceptual similarities as distances between all possible pairs of talkers, the cluster analysis visually illustrates the relationship of the talkers to each other. Therefore, the cluster analysis automatically takes into account the correct pairings and pairwise errors, as well as shows if a particular talker is perceptually distinct from other talkers with the same native language background.
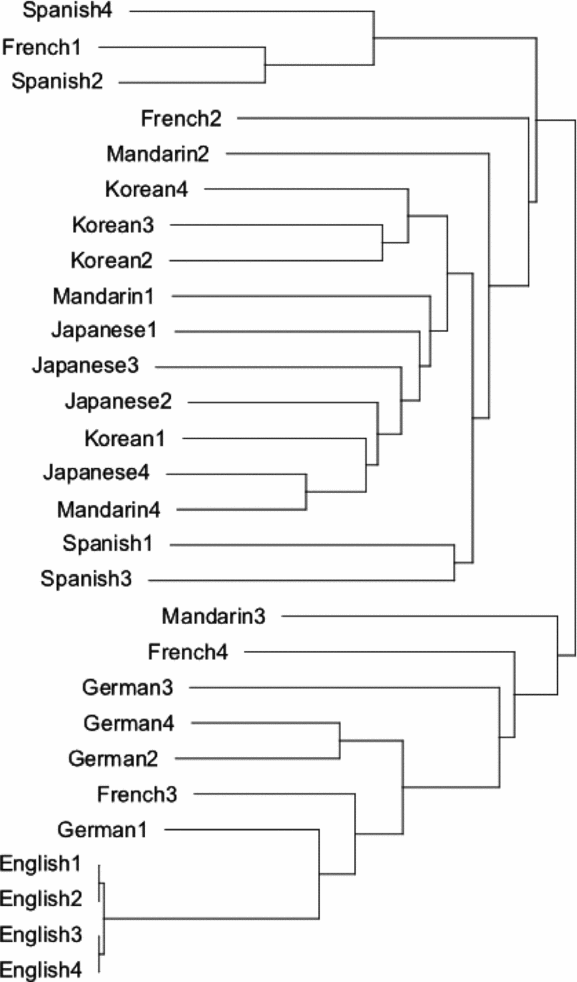
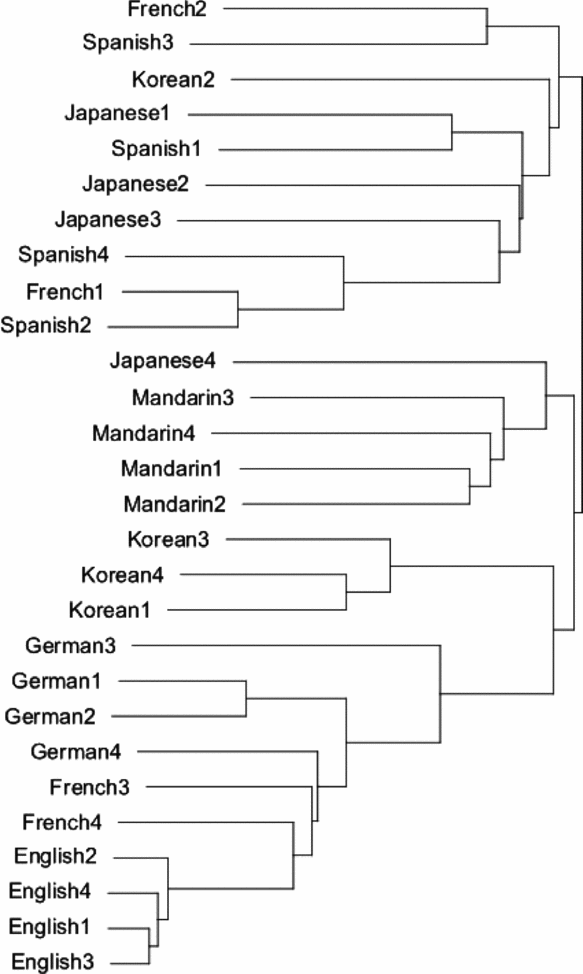
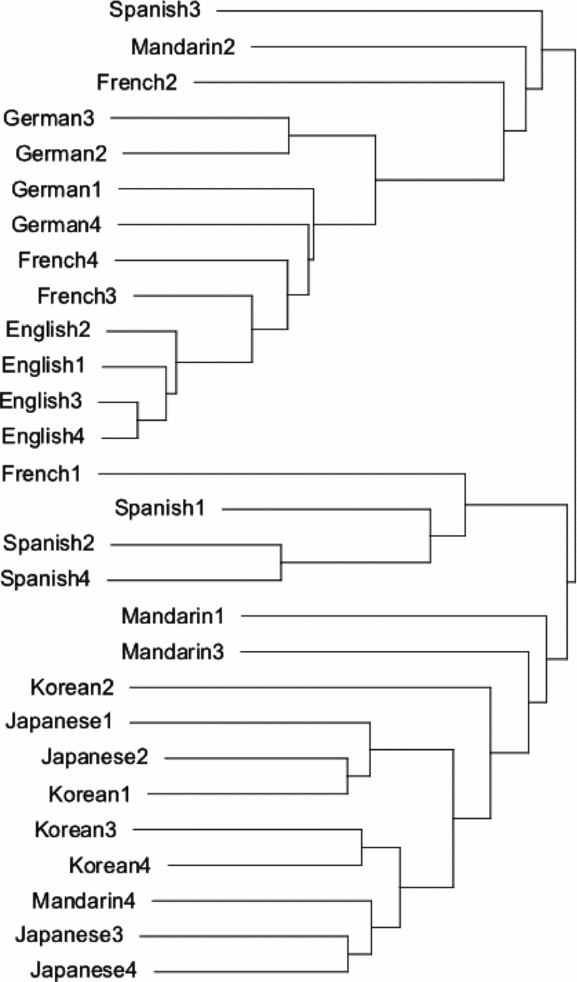
Specifically, the current data were analyzed using ADDTREE, an additive cluster analysis program (Sattath & Tversky, Reference Sattath and Tversky1977). Unlike ultrametric trees, such as those produced by hierarchical clustering, in an additive tree the intracluster distances may exceed intercluster distances. This feature of additive trees allows for a correspondence to a two-dimensional spatial solution for psychological distances (such as a two-dimensional multidimensional scaling) in the number of parameters incorporated in the representation (Sattath & Tversky, Reference Sattath and Tversky1977). The benefit of using an additive cluster analysis here, therefore, is that the result is an interpretable, visually represented model that illustrates both psychological distances and classification patterns (Sattath & Tversky, Reference Sattath and Tversky1977). In the tree representations produced by this additive clustering model (Figures 2–4), the total length of the horizontal branches between any two nodes represents degree of perceptual similarity; vertical distance and position are irrelevant. The perceptual similarity between any pair of talkers, therefore, is represented as the summed lengths of all horizontal branches between the two talkers, such that two talkers who were frequently classified together have a shorter summed length of branches between them. To conduct the cluster analysis, a 28 × 28 talker similarity matrix was calculated for each listener group. Each cell of a matrix was computed by taking the total number of times listeners within a listener group classified together a given talker with another talker, then averaging across the two classification tasks. Each of these similarity matrices was then submitted to ADDTREE, which produces a graphical tree model representing distances of best fit between all of the nodes (talkers).
Additive cluster tree model depicting perceptual similarities of the talkers for the native listeners. Each node is labeled with the talker's native language and number, which uniquely identifies the talker. Talker ID numbers 1 and 2 are male; 3 and 4, female. Total length of the horizontal branches between any two nodes represents varying degrees of perceptual similarity; vertical distance is irrelevant.
Additive cluster tree model depicting perceptual similarities of the talkers for the Korean listeners. Each node is labeled using the system described in Figure 2.
Additive cluster tree model depicting perceptual similarities of the talkers for the Spanish listeners. Each node is labeled using the system described in Figure 2.
Comparing across all three clustering solutions (Figures 2, 3, and 4), it becomes evident that for all three listener groups, the four native talkers are most closely clustered compared to the talkers from the other native language backgrounds. For native listeners, there is almost no distance between each native talker (Figure 2). This very tight clustering of native talkers by the native listeners is in contrast to the Korean and Spanish listeners’ similarity structures, which indicate some perceptual distance between the native talkers (Figures 3 and 4).
In addition, moving toward the root of the clustering solutions, all three listener groups found the same six nonnative talkers (four German and two French female talkers) to be most similar to the native talkers. This consistency across all groups’ perceptual structures for the most nativelike nonnative talkers indicates that the same nonnative talkers were most frequently misclassified with native talkers by all three listener groups. In other words, all listener groups agreed on which nonnative talkers were closest in perceptual distance to the native talkers.
In contrast, the Korean and Spanish listener groups differed from the native listener group in their perception of the Korean and Spanish talkers, respectively. For the Korean listener group (Figure 3), three of the four Korean talkers (Korean1, Korean3, and Korean4) are on their own distinctive branch of the tree, which in turn clusters with the subbranch containing the native talkers and the nonnative talkers who are more similar to native talkers. A Korean cluster consisting of three Korean talkers also appears in the native listeners’ solution (Figure 2); however, the location of this Korean branch differs markedly from the Korean solution. The Korean cluster in the native and Spanish listeners’ solutions is part of a larger branch that consists of most of the native talkers of Asian languages and is clearly separated from the branch containing the native talkers.
For the Spanish listener group (Figure 4), three of the four Spanish talkers (Spanish1, Spanish2, and Spanish4) are on their own branch, which in turn, distantly clusters with the Asian language talkers. The fourth Spanish talker (Spanish3) loosely clustered with the native talkers and nonnative talkers who are closer to the native talkers. In contrast, Spanish talkers in the native and Korean listeners’ solutions show a less cohesive structure, indicating that these talkers were not consistently perceived to have the same language background. In summary, Korean and Spanish listener groups found Korean and Spanish talkers, respectively, to be more perceptually distinct groups than the native listeners did.
Finally, an additional distinctive cluster was found in the perceptual similarity structure for the Korean listener group: a Mandarin branch, on which all four Mandarin talkers clustered. The existence of a Mandarin branch for the Korean listener group is in stark contrast to the native and Spanish listener groups’ clustering solution, in which the Mandarin talkers are found clustering with a variety of different native language backgrounds and two Mandarin talkers are never directly paired with one another. Moreover, no other cluster of four nonnative talkers with the same language background was found for any of the listener groups. This clustering of Mandarin talkers in the Korean listener group's solution, however, does not reflect significantly higher classification accuracy. Although Korean listeners’ classification accuracy of Mandarin talkers was numerically higher than that of the native and Spanish listeners (Table 3), this difference in classification accuracies was not significant, Spanish: t (36.44) = 1.39, p = .09; Native: t (42.54) = 1.41, p = .08. Nevertheless, the distinctiveness of both the Korean and the Mandarin talkers in the cluster solution for the Korean listener group results in a perceptual space that is unlike the Spanish and native listeners’ perceptual spaces. The perceptual space of the Korean listener group clearly differentiates the Korean, Mandarin, and Japanese talkers from one another (Figure 3). In contrast, both the Spanish and the native listener groups do not differentiate among talkers from these three talker native language backgrounds.
In summary, while all three groups created a cluster of native and nativelike nonnative talkers, only the nonnative listener groups had systematic subdivisions of the remaining nonnative talkers. The solutions for both nonnative listener groups indicate that the listeners found talkers with whom they shared a native language to be perceptually distinctive. Specifically, the Spanish listener group's solution displays a cluster of Spanish talkers, and the solution for the Korean listener group indicates the presence of a Korean cluster. In addition, the Korean cluster computed for the Korean listener group shows a high degree of similarity to the native and nativelike talkers. Furthermore, the solution computed for the Korean listener group exhibits a Mandarin talker cluster, resulting in distinct groups for the Korean, Mandarin, and Japanese talkers; this organization pattern is quite different from both the native and the Spanish listeners’ solutions.
DISCUSSION
The current study investigated how linguistic experience affects listeners’ representation of nonnative accents. The study examined native and nonnative listeners’ perceptual organization for the local native dialect (Midland) and six nonnative accents, which included the native language backgrounds of the two nonnative listener groups (Korean and Spanish). It was first hypothesized that each listener group would find the accent group that matched their own native language background, the accent with which listeners have the most familiarity, to be perceptually differentiated from the other accents. This hypothesis was confirmed through the cluster analyses. Each listener group exhibited a cluster of talkers whose native language background matched their own. Moreover, this finding parallels the classification accuracy results, which overall showed that each listener group was more accurate at classifying their own accent group compared to the other two listener groups.
Because the local native dialect for all nonnative listeners in the current study was the Midland dialect, it was also hypothesized that the nonnative listeners would show an effect of familiarity for the native accent. Examination of the Korean and the Spanish listener groups’ perceptual similarity spaces using additive clustering analysis revealed that the native talkers were more closely clustered together than were any other talker group. This clustering pattern suggests that these nonnative listeners found the native accent perceptually distinct in addition to the accent group that matched their own native language background.
Finally, the current study investigated whether nonnative listeners would show any decrement in overall nonnative accent classification accuracy relative to native listeners. With two familiar accents in the classification set, nonnative listeners may demonstrate equal ability to or even an advantage over the native listeners, who are primarily familiar with the native accent only, in overall accent classification accuracy. Comparison of the overall accuracy scores across the three listener groups showed no significant differences. The nonnative listeners, therefore, exhibited neither an overall advantage nor a disadvantage when classifying the current set of native and nonnative accents.
The results of the current study suggest that linguistic experience plays a significant role in shaping listeners’ classification of native and nonnative varieties of English. Native listeners in the current study were significantly more accurate at classifying the native talkers than either of the nonnative listener groups. Similarly, Spanish listeners were significantly more accurate at classifying Spanish talkers than were the native and Korean listeners. In contrast to the Spanish listeners, Korean listeners performed at a similar level of accuracy as native listeners in classifying Korean talkers, but they still were more accurate than the Spanish listeners. The lack of difference in classification accuracy between Korean and native listeners, however, may be driven by the surprisingly high accuracy with which native listeners classified Korean talkers (Table 3). Native listeners in the current study were all students at Indiana University, where, when data from native listeners were collected for this study, South Koreans represented the largest population of international students. The high accuracy demonstrated by these native listeners, therefore, may be due to native listeners’ exposure to Korean-accented English on campus. The assessment of a population of native listeners with different experiences with specific nonnative accents would allow for the explicit testing of this possibility.
The classification benefit observed in the current listener groups’ classification accuracies was also evident in their clustering solutions. The native listeners’ solution showed more perceptual distinctiveness of native talkers as a group than either the Spanish or the Korean listeners’ solutions. Similarly, in the Spanish listeners’ clustering solution, Spanish talkers were more distinct than they were in the native or the Korean listeners’ solutions. In the cluster solution for the Korean listener group, Korean talkers were a group that was distinct from other nonnative talkers, unlike in the cluster solutions for the native or the Spanish listener groups. These clustering analysis solutions suggest that nonnative listeners may have a heightened perceptual sensitivity for features that index a familiar accent (i.e., their own).
The nonnative listeners’ clustering solutions reflected their lower classification accuracy for the native talkers. Both the Korean and the Spanish listeners’ solutions indicated some perceptual distance among the native talkers, whereas there was very little distance between native talkers in the native listeners’ solution. The three listener groups’ classification pattern of native talkers likely reflected the difference in experience with native speech between nonnative and native listeners. Nonnative listeners’ poorer classification accuracy for native talkers suggests that there is a decrement in their ability to accurately perceive the acoustic–phonetic features that are indicative of native-talker status. Nevertheless, both nonnative and native listeners perceived the same group of nonnative talkers to be most similar to native talkers. This result indicates that there is a strong similarity between nonnative and native listeners’ representation of nonnative talkers who were most nativelike.
Although the current study specifically examined listeners’ perception of talkers’ native language backgrounds, there are other features with which nonnative speech could be characterized (Atagi & Bent, Reference Atagi and Bent2013; Derwing & Munro, Reference Derwing and Munro1997). Strength of foreign accent, for example, is a feature of nonnative speech that is highly salient to native listeners (Atagi & Bent, Reference Atagi and Bent2013). Nonnative listeners’ ratings of accent strength for nonnative talkers with whom they share a native language are generally comparable to the accent ratings by native listeners (Flege, Reference Flege1988; Munro, Derwing, & Morton, Reference Munro, Derwing and Morton2006). Furthermore, Munro et al. (Reference Munro, Derwing and Morton2006) found that most nonnative listeners do not perceive nonnative talkers with whom they share a native language to be less accented than other nonnative talkers. These previous results suggest that nonnative listeners can judge nonnative accent strength independent of their familiarity with the particular accent. Similarly, in the cluster solutions of the nonnative listeners, representation of nativelike speech appeared to be a separate process from recognizing the features that index a familiar (i.e., their own) accent. Specifically, both nonnative listener groups’ cluster solutions show a cluster of native and nativelike accents, a cluster of the familiar accent, and a cluster of all other nonnative accents. In terms of perceptual similarities, these three clusters seem to indicate two simultaneous processes: similarity to native speech and similarity to their own speech. The third cluster was made up of talkers whose pronunciation patterns were not perceptually similar to native speech or to the listeners’ own speech. The native listeners’ cluster solution, in contrast, appears to only have two primary clusters: talkers who sound most nativelike and those who do not sound nativelike. This different perceptual organization of nonnative talkers by native and nonnative listeners may reflect that the two perceptual processes that are distinct for nonnative listeners (i.e., assessing similarity to native speech and similarity to the listener's own speech) are one and the same process for native listeners. The current results suggest that, like native listeners, nonnative listeners also scale their perception of nonnative varieties relative to their own speech (Atagi & Bent, Reference Atagi and Bent2013). The nonnative listeners in the current study also appeared to scale their perception relative to native English.
Talkers’ strengths of foreign accent and native language background both appear to have influenced listeners’ perceived similarity for the talkers. The six talkers that all three listener groups found to be most similar to the native talkers consisted of all four native speakers of German and two native speakers of French, who were previously rated by a group of native listeners as being relatively less accented (Atagi & Bent, Reference Atagi and Bent2013). Furthermore, in classification accuracy, all three groups of listeners were relatively accurate in their classification of German talkers. It is important to note, however, that this accuracy in classifying German talkers may not be due to the listeners’ ability to correctly identify these talkers as having a German accent. Instead, listeners may have accurately grouped these talkers as being the least accented nonnative talkers. However, foreign-accent strength alone cannot account for the classification pattern observed in the cluster analyses, because accent ratings for all four Mandarin talkers fell within the German talkers’ range of accent ratings. Listeners’ successful classification of some accents, but not others, highlights the multiplicity of perceptual dimensions in accented speech.
Although the nonnative listeners in the current study ranged in proficiency from intermediate to advanced, the sample size was not sufficient to group participants by proficiency in the analyses. Proficiency in the second language is likely to be relevant to the development of second language metalinguistic awareness (Eisenstein, Reference Eisenstein1982). A change in the underlying similarity structure for accents may parallel changes in linguistic processing abilities for different accents. For example, Pinet et al. (Reference Pinet, Iverson and Huckvale2011) showed that there is a correlation between talker intelligibility and talker–listener accent similarity. Nonnative listeners who were less proficient in their production of English showed an intelligibility benefit for more accented nonnative talkers, while more proficient nonnative listeners showed an intelligibility benefit for native and nativelike nonnative talkers. Accordingly, with the current accent classification tasks, as nonnative listeners increase in second language proficiency, their perceptual similarity structure for accents may look more like that of native listeners. An analysis of the relationship between listeners’ and talkers’ proficiency levels in the current study, however, is not possible without recordings of the listeners’ speech and without proficiency data from the talkers. Although within-group comparisons based on English proficiency were not possible in the current study, the nonnative listener groups exhibited across-group differences. The Spanish listeners in the current study received higher overall proficiency scores on a standardized English language assessment than did the Korean listeners, largely due to the Spanish listeners scoring higher in the two production-based measures (sentence mastery and pronunciation; Table 1). Spanish listeners also had an overall perceptual organization of talkers that was more similar to that of native listeners; in contrast, there was little resemblance between Korean and native listeners’ perceptual organizations. The difference in proficiency between the Korean and the Spanish listener groups in the current study, therefore, may have contributed to the difference of perceptual organization between the two nonnative listener groups. Because the effects of native language and proficiency cannot be separated in the current study, future studies should evaluate listeners with different proficiency levels within one native language background. A design of this type would allow for an understanding of the interplay between a listener's proficiency and language experience. Further study is also necessary to examine the role of talker–listener accent similarities in listeners’ accent classification and categorization.
Overall, the current study found similar rates of classification accuracy across native, Korean, and Spanish listener groups when they classified 4 native and 24 nonnative talkers by native language background. Nonnative listeners did not show a decrement in their classification accuracy compared to native listeners nor did they show an overall advantage. This result contrasts with that of a previous auditory free classification study with nonnative listeners, in which nonnative listeners were less accurate than native listeners at classifying American regional dialects (Clopper & Bradlow, Reference Clopper and Bradlow2009). Nonnative listeners’ similar level of classification accuracy to native listeners in the current study may derive from their familiarity with two of the included accents: the accent matching their language background and the native accent, which was the dialect spoken in the listeners’ residential environment at the time of the study. In contrast, nonnative listeners in Clopper and Bradlow (Reference Clopper and Bradlow2009), most of whom had been in the United States for less than 1 month at the time of study, likely had less extensive exposure to multiple native dialects of English compared to the native listeners. The similar classification accuracy between native and nonnative listeners in the current study highlights the contribution of listeners’ degree of familiarity and experience with particular varieties for a task such as accent classification.
The difference between nonnative listeners’ accuracy on regional dialect classification (Clopper & Bradlow, Reference Clopper and Bradlow2009) and on nonnative accents in the current study may also be due to differences in the types of acoustic–phonetic variation present in regional dialects versus nonnative accents. These two types of variation differ in the types of acoustic–phonetic variation they introduce. For example, regional dialects of American English tend to differ from each other in the realization of specific vowels (Clopper & Pisoni, Reference Clopper and Pisoni2004b; Labov, Ash, & Boberg, Reference Labov, Ash and Boberg2006), whereas differences across nonnative accents are frequently manifested in both vowels and consonants, as well as in suprasegmental features (Adank et al., Reference Adank, Evans, Stuart-Smith and Scott2009; Floccia, Butler, Goslin, & Ellis, Reference Floccia, Butler, Girard and Goslin2009; Floccia et al., Reference Floccia, Goslin, Girard and Konopczynski2006). Such differences in the acoustic–phonetic cues that are present in nonnative accents may have enhanced nonnative listeners’ performance in the current task. Future studies will need to examine second language learners’ ability to make use of specific phonetic features to index variation in both regional dialects and nonnative accents.
While the current study found distinct perceptual organizations across listener groups, Clopper and Bradlow (Reference Clopper and Bradlow2009) found nonnative listeners’ perceptual organization of regional accents to be similar to that of native listeners. As discussed above, nonnative listeners in the current study appeared to scale their perception of accents to their own speech. When a stimulus set clearly lacks talkers who sound similar to a nonnative listener's own production of English, the only strategy available to nonnative listeners may be to scale their perception of accents relative to a familiar native accent, such as the General American dialect. Therefore, when presented with a set of American regional dialects in Clopper and Bradlow (Reference Clopper and Bradlow2009), both nonnative and native listeners may have scaled their perception to the most familiar dialect, General American English. As a result of this shared accent classification strategy, nonnative and native listeners’ perceptual organizations of American regional dialects were similar to each other. To systematically explore how the types of accents in a given talker set may affect accent classification strategies, future studies in which listeners classify multiple sets of nonnative and native accents (including regional dialects both in American English and international English) will be necessary. A comparison between classification of talker sets with and without the accent group that matches the listener's native language would be particularly informative for examining the possibility of multiple classification strategies.
Conclusion
In summary, the current study showed that listeners’ linguistic background and experience had a significant effect on their perceptual representation of nonnative variation. Specifically, when presented with six nonnative varieties of English and one native English variety, native, Korean, and Spanish listener groups found talkers with whom they shared a native language to be perceptually distinct from talkers of other accent groups. Further, the cluster analysis solutions revealed that the nonnative and the native listeners found the same nonnative talkers to be most similar to the native talkers. Thus, for nonnative listeners, the current classification results could be accounted for by inferring that listeners are sensitive to two types of perceptual similarity: similarity to one's own speech (or most familiar nonnative accent) and similarity to native speech. In contrast, for native listeners, the application of these two types of similarity collapses into one classification process, which results in a notably different perceptual organization of nonnative speech variation. Furthermore, although nonnative listeners were less accurate in native talker classification than were native listeners, nonnative listeners’ ability to successfully classify talkers with whom they share a native language resulted in similar overall classification accuracies between native and nonnative listeners. The current results highlight the substantial impact that experience with specific accents has on the underlying perceptual organization of speech variation, in both native and nonnative listeners.
ACKNOWLEDGMENTS
This work was supported by National Institutes of Health Grants R21 DC010027 (to T.B.) and T32 DC00012 (to E.A.) from the National Institute of Deafness and Other Communication Disorders, and Grant T32 NS007292 (to E.A.) from the National Institute of Neurological Disorder and Stroke. Portions of this work were presented at the 165th meeting of the Acoustical Society of America and the 21st International Congress on Acoustics in 2013. The authors thank Jessica Copperman, Marissa Ganeku, and Matti Rhodes for their assistance with data collection; Charles Brandt for programming the experiment; and Rob Nosofsky for feedback on analyses and interpretation of results.