





Impact Statement
This research makes significant progress in tire manufacturing through a data-driven Digital Twin approach with three key impacts. Firstly, it studies a dynamic manufacturing problem with an approach capable of adapting to production changes, significantly enhancing efficiency and quality in the tire manufacturing process. Secondly, the proposal is human-centered, ensuring that the technology not only adapts to production variations but also meets the needs of process workers by an “ethics by design” strategy. Thirdly, by investigating and integrating model’s degradation and quality, this approach offers a reliable solution that addresses an interesting area of the literature.
1. Introduction
The design of optimal products has been one of the most studied fields in the manufacturing industry because of its economic impact, resource saving, efficiency, and environmental repercussions.
Historically, the optimal design of products has often relied on a trial-and-error methodology (Zhang et al., Reference Zhang, Chen, Zhou, Cheng, Chen, Guo, Han and Lu2020) or the insights of experts. In many cases, the configuration of machinery and industrial plants has been heavily dependent on the knowledge and experience of workers, and this knowledge has not been standardized across the workforce (Singh et al., Reference Singh, Cascini and McComb2021). This approach has required significant years of expertise to develop, and it has often been subject to variations in design and operation due to the differences in workers’ individual knowledge and experience.
Through the integration of Industry 4.0 technologies, new approaches for achieving optimal products in manufacturing have emerged (Amjad et al., Reference Amjad, Rafique and Khan2021). One suggested approach has been the use of Digital Twins. Digital Twins are defined as a physical system’s virtual replicas, which are continuously updated by the physical system’s real-time data (VanDerHorn and Mahadevan, Reference VanDerHorn and Mahadevan2021). In this context, real-time refers to the system’s ability to process data and provide outputs fast enough to remain synchronized with the physical process, ensuring its state does not change before a response is delivered (Knebel et al., Reference Knebel, Wickboldt and de Freitas2020). Digital Twins enable the simulation of different scenarios more efficiently so that the optimization can be carried out without the need to work with the real system (Liu et al., Reference Liu, Zhang, Wan, Zhou and Gao2022a).
Depending on the level of integration with the physical system, Digital Twins can be implemented through virtual, semi-physical, or physical commissioning strategies (Leng et al., Reference Leng, Wang, Shen, Li, Liu and Chen2021). While semi-physical approaches combine real and simulated components, this work focuses on a physical commissioning Digital Twin, in which all models and decision-support mechanisms are validated directly on the real manufacturing process and are used to continuously optimize the manufacturing process whenever production is (re)launched (Leng et al., Reference Leng, Guo, Xie, Zhou, Liu, Gu, Mourtzis, Qi, Liu, Shen and Wang2024).
The problem studied in this work is the optimization of a rubber extrusion plant. Extrusion is a physicochemical process used in the polymers industry, food industry, and pharmacology (Hyvärinen et al., Reference Hyvärinen, Jabeen and Kärki2020; Zhang et al., Reference Zhang, Haghiashtiani, Hübscher, Kelly, Lee, Lutolf, McAlpine, Yeong, Zenobi-Wong and Malda2021). Within desirable physical conditions, extruders shape cross-sectional profiles with desirable mechanical and physical properties (Abeykoon et al., Reference Abeykoon, McMillan and Nguyen2021).
The plant under study uses multiple extruders, which are used depending on the products that are manufactured. For each product type, the optimal settings of the machinery are needed in order to get high-quality products. Furthermore, because of the strict quality conditions of the products, the extrusion process has to be stopped over and over again, which means a loss in the optimal physical properties. After that kind of stop, the workers need to reconfigure the process, which can be slow and knowledge-dependent.
A quick restart of the extruders, which could guarantee high product quality, can therefore reduce material waste, production times, and costs. Ideally, a Digital Twin could provide the operators with suggestions and guidelines on how to restart production correctly, based on the actual state of the extruders.
1.1. Related work in manufacturing Digital Twins
Several studies have demonstrated the ability of Digital Twins to optimize industrial processes, reducing production time and economic costs such as those associated with process readjustments (Jiang et al., Reference Jiang, Yin, Li, Luo and Kaynak2021; Pylianidis et al., Reference Pylianidis, Osinga and Athanasiadis2021).
Although many articles related to theoretical Digital Twins have been published in recent years, there is still a need to ground the concept and face the problems that implementation can bring (Tao et al., Reference Tao, Xiao, Qi, Cheng and Ji2022). These are related to human–machine interaction, as well as the dynamic ability of the models to adapt to changes that may occur in the actual process (Leng et al., Reference Leng, Wang, Shen, Li, Liu and Chen2021), data quality, and model precision and efficiency (Huang et al., Reference Huang, Fey, Liu, Beysel, Xu and Brecher2023). Emphasizing the importance of accurately modeling a process, Rasor et al. (Reference Rasor, Göllner, Bernijazov, Kaiser and Dumitrescu2021) highlight its fundamental role in adapting to the actual process and considering human interactions.
In general, three ways of modeling have been considered in Digital Twins: simulation models, data-driven models (Song et al., Reference Song, Song and Liu2022), and hybrid models. In the first case, theoretical models are used to describe the actual process, and real-time data is used to update the state of the theoretical model (Cao et al., Reference Cao, Tang, Gaidai and Wang2022). In the second case, machine learning (ML) models can be used, where the process’ historical data are used to train models and real-time data are used to predict some aspect of the process (Zayed et al., Reference Zayed, Attiya, El-Sayed and Hemdan2023). Due to their reduced computational requirements, ML models have been proposed as a preferable approach, particularly when high-fidelity physical models are computationally expensive (Gong et al., Reference Gong, Cheng, Chen and Li2022; He et al., Reference He, Wu, Liu, Jin and Zhao2023). As explained in Song et al. (Reference Song, Song and Liu2022) and Pylianidis et al. (Reference Pylianidis, Snow, Overweg, Osinga, Kean and Athanasiadis2022), a primary reason for employing Digital Twins is to achieve real-time results. However, this can entail challenges when the modeling relies on high-fidelity models with significant computational costs. In this context, a third alternative has emerged in the form of hybrid models, which combine physics-based representations with ML components (Catti et al., Reference Catti, Nikolakis, Sipsas, Picco and Alexopoulos2024), leveraging physical consistency while retaining computational efficiency (Lee et al., Reference Lee, Chua, Liu, Moon and Lopez2025).
Even if it is clear that ML is a promising approach to optimize production systems, there are some aspects to consider. Lugaresi et al. (Reference Lugaresi, Gangemi, Gazzoni and Matta2023) studied the model validation and error correction during the whole lifecycle of the ML model, emphasizing the need for real-time updating of the model when real-time data deviates considerably from the training data. Friederich et al. (Reference Friederich, Francis, Lazarova-Molnar and Mohamed2022) discussed that working with a ML approach means that modeling relies on data. Consequently, special attention should be paid to data quality, event detection, data size, and labeling.
Several recent works have studied the possibility of using Digital Twins for the optimization of extrusion processes. Rossi et al. (Reference Rossi, Moretti and Senin2022) used a complex simulation model to create a synthetic dataset to train an autoregressive model using neural networks. Their work focuses on the virtual representation of the process and the generation of training data, without addressing the challenges associated with real commissioning and online integration of Digital Twins in operational environments. Su et al. (Reference Su, Hicks and Nassehi2023) employed an image processing model to detect material and surface errors in extruded products, identifying the variables related to these effects and highlighting the importance of model reliability when dealing with real processes. However, the proposed approach is not framed within a fully integrated Digital Twin architecture operating in real time. Matić et al. (Reference Matić, Stanković-Brandl, Bauer, Lovey, Martel, Herkenne, Paudel and Khinast2023) studied a case with similarities to the one addressed in this paper, although applied to the pharmaceutical industry. They proposed a simulation model aligned with the real process, but the work does not consider the integration requirements needed for continuous operation and interaction with the actual manufacturing system. Rossi et al. (Reference Rossi, Moretti and Senin2024) discussed the difficulty of assessing optimal machine configurations when dealing with different product shapes, materials, and production requirements. Although a ML-based Digital Twin was proposed, its validation was not performed under real-time production conditions. Liu et al. (Reference Liu, Kan and Ye2022b) investigated an extrusion-based 3D printing process, presenting a physics-based multiscale model for real-time defect reduction through adaptive process adjustments. While effective from a modeling perspective, the study does not address broader manufacturing integration aspects such as operator interaction or system interoperability. Li et al. (Reference Li, Yang, Cao, Ge, Chen, Wen and Li2022) presented a data-driven approach to reduce carbon emissions in extrusion processes using a Kernel Extreme Learning Machine Neural Network combined with a Petri Net model. Finally, Burr et al. (Reference Burr, Sarishvili, Just, Katsaouni and Moser2023) proposed an Autoencoder-based solution to determine initial machine settings under quality constraints; however, the training relies mainly on synthetic data, and the work does not address the requirements of real commissioning, continuous model adaptation, or human-centered operation in industrial environments.
Recent works have pointed out that Digital Twins aimed at virtual commissioning and Industry 5.0 should go beyond a purely technological perspective and explicitly incorporate human-centered design principles. This includes the use of dedicated human–machine interfaces (HMIs) to effectively communicate Digital Twin insights to operators, as well as the integration of adaptability and continuous model improvement mechanisms to ensure reliable operation over time.
In this context, Villani et al. (Reference Villani, Picone, Mamei and Sabattini2025) argue that Digital Twins should support plant workers rather than replace them and stress the importance of continuous model adaptation to sustain trust and reliability, although no validation in a real industrial setting is provided. Similar conceptual perspectives are presented in Papacharalampopoulos et al. (Reference Papacharalampopoulos, Foteinopoulos and Stavropoulos2023), which emphasizes interpretability, context awareness, and continuous improvement, and in broader reviews such as Massaro (Reference Massaro2025) and Lv (Reference Lv2023), which highlight the growing relevance of human interaction and adaptability in Industry 5.0-oriented Digital Twins while also noting the limited number of works that address their technical realization and validation in real manufacturing environments.
This study advances the concept of Digital Twin beyond theoretical conjecture, proposing an architecture specifically applicable to tire manufacturing processes with the use of ML models. The principal goal is to enhance manufacturing operations by facilitating real-time identification and control of critical physical parameters essential for precise machine initialization and optimal process settings. Leveraging state-of-the-art practices from the literature, this work aims to develop a Digital Twin approach for complex manufacturing industries that involve operators and variable demand. The approach empowers operators to optimize machine initialization and process settings, enhancing product quality and cost efficiency in the tire manufacturing domain. To achieve these objectives, a Digital Twin embodying the following essential characteristics is sought:
-
1. Real-time computation: Digital Twin should be in constant interaction with the actual process in real time. Every delay between the virtual replica and the real process has an impact on the loss of optimal properties and the time needed to restart the process appropriately.
-
2. Process integration and usability: The proposal should detect process status and predict and suggest information based on the process and employee needs. Optimization of restarts should take into account how workers interact with the actual process and know when assistance is needed.
-
3. Production adaptability: The virtual replica should be able to adapt to changes in production, such as changes in quality constraints, use of extruders, or products being manufactured.
-
4. Human in the loop. All predictions and suggestions that are provided to the workers should be understandable, easy to get, reliable, and should not increase their workload.
Below is an outline of this study. The problem is contextualized from the perspective of the system’s users in Section 2, while the data used in the study is presented in Section 2.1. Section 3 describes the Digital Twin Architecture proposed in this article, with all the connections between the different layers and functionalities. Section 4 shows the results of the experimentation made in order to measure the compliance of the proposal with the described scientific aim and hypothesis. Finally, Section 5 concludes with the research conclusions and possible future research paths and system improvements related to this work.
2. Users
The Digital Twin developed in this study is specifically intended for use by process operators within the tire manufacturing environment. These users include both process engineers and, more directly, process technicians—the personnel responsible for preparing the materials, overseeing machine operation, and ensuring smooth and efficient production. Their daily tasks require constant attention to process conditions and quick responses to potential disruptions. The Digital Twin is designed to support these roles by offering targeted insights that help operators maintain process continuity, reduce inefficiencies, and support consistent product quality.
To be effective in this context, the system emphasizes usability, clarity, and seamless integration with existing operational workflows. It provides real-time information that assists users in configuring the process under varying conditions, helping them to make decisions that minimize production losses and enhance output quality. The design prioritizes transparency and simplicity, ensuring that the insights delivered are immediately understandable and actionable. By doing so, the Digital Twin empowers operators without increasing their cognitive load, reinforcing their role as key decision-makers on the factory floor.
2.1. Data sources
This study is based on real-world data collected over a period of 3 years from a tire manufacturing process at the Continental SAS France plant located in Sarreguemines. The dataset includes a wide range of process parameters such as pressures and temperatures recorded along the extruders, setpoint temperatures, product types, extruder combinations used, production interruptions, material cuts, and both commanded and actual angular screw speeds of the extruders. Additionally, quality inspection data was incorporated, including instances where material was discarded and profile measurements obtained from a profilometer. These data provide a comprehensive view of the process, capturing both operational conditions and resulting product quality.
The historical dataset was used to train the ML models integrated into the Digital Twin and to guide the overall system design. In the deployment phase, incoming real-time data was used to validate the system’s performance and assess whether the proposed hypotheses were fulfilled. By relying on extensive and high-resolution production data, the developed Digital Twin is firmly grounded in the actual behavior of the manufacturing process, ensuring both realism and relevance in its predictions and suggestions.
3. Methods
The subsequent section delineates the implementation and integration of the Digital Twin within the extrusion process. The architecture has been defined to fulfill predefined objectives explained in the preceding section.
Every time the extrusion process is stopped due to strict quality restrictions, production requirements, maintenance checks, or other interruptions related to the manufacturing process. Optimal extrusion properties are lost in the machines. Furthermore, a real manufacturing plant may produce over a 100 varying products with different physical, mechanical, and shape requirements, making the search for optimal parameters a challenging task.
To respond optimally to the need for real-time reconfiguration of extruders, minimizing restart time and maximizing product quality, it is essential to consider various implementation features explored in the current literature. The approach presented in this work aims to address these implementation challenges. In the following sections, an explanation for each layer of the approach studied is provided, along with a concise summary of the architecture illustrated in Figure 1.
Digital Twin Scheme of the architecture adopted in the presented approach.

Figure 1. Long description
The diagram is organized into several functional blocks.
1. Physical System: At the top, a conveyor belt with sensors and a worker icon represents the industrial environment, labeled with the Continental logo.
2. Central data storage: Below the physical system, a layer labeled Storage of raw data as time series features the influxdb logo. A bidirectional arrow connects this to the physical system.
3. Digital Twin: This central block receives data from storage. On the left, a Data processing system using R flows into an Indicators database using M y S Q L. To the right, two parallel modules, Extrusion status predictor and Recommendation engine, both utilize brain icons and Python logos.
4. Human-Machine Interface: To the right of the Digital Twin, a monitor icon and worker icon represent the interface.
5. Feedback Module: Below the interface, a block contains a Feedback database using M y S Q L and a speech bubble icon.
6. Retraining Module: At the bottom, a horizontal bar with R, Python, and a chip icon connects the Feedback Module back to the Digital Twin, completing a closed loop for system resilience.
3.1. Physical system description
In order to achieve an extrusion with the required extrudate quality, different variables are configured. This process starts with the selection of raw materials introduced into the feeder. Once the material is introduced into the machine, various physical properties such as temperature, pressure, and viscosity are required in the barrel, which are usually controlled and monitored. Upon ensuring suitable physical properties in stoppage, speed setpoints are chosen, and the extrusion process is initialized. During this process, the material is pushed through the barrel ((6) in Figure 2) by a screw ((5) in Figure 2) until it reaches the die ((7) in Figure 2), where it is shaped during ejection. In the case of multiple extrusion, as in this scenario, optimal setpoints and characteristics are required in each of the extruders used, and coordination among them is essential.
Diagram of an extruder.

After the extruded material is released, a quality measurement is done. Quality measurement is computed by the worker and a profilometer, which measures the geometrical compliance of the extrudate. The worker ensures that product quality is good enough to continue with the production, if not, the extruded material is cut using the scrap button ((11) in Figure 3). When the extruded material reaches the profilometer ((12) in Figure 3), it assesses whether the shape of the material meets the quality standards, and if not, it is also cut. Generally, it takes some time to get a good product, so in all extrusions, an initial piece of the extruded material is cutoff. If this steadiness is not achieved, production is stopped completely, all material is cut, and the process is reverted to the starting point, where again, properties and setpoints have to be defined.
Diagram of the quality measurement after an extrusion.

Each time the process is stopped, and the extrusion has to be restarted. The operator has to decide the optimal time to start the process, considering the optimal physical properties of the extruders, as well as determining the optimal speed setpoints for each of the extruders that are needed for the given product.
To gather information about the process at any given time, sensors are placed along the entire process. Firstly, to know the status of the extruders, the temperatures and pressures of the system are measured at various points along the process and at all the extruders. Secondly, the speed setpoints at which the extruders are initialized and the actual obtained values for each of the extruders are measured. Finally, for quality measurement, the actual and target values of the profilometer are also recorded, as well as the quantity of rejected or cut material.
3.2. Central data storage
This layer of the architecture is responsible for storing all the information collected during the process, enabling its utilization by the Digital Twin.
Different data types are required for the variables measured in the physical process. Pressure, temperature, actual speed, speed setpoint, real profilometer value, and target profilometer value are real-numbered variables. The two variables related to product type, namely the raw material identifier in each of the extruders and die shape identifier, are qualitative variables. Each variable has as many labels as there are raw materials and shapes that the production plant works with. Finally, the variable related to the rejected or cut material in the quality measurement is a binary variable, where 1 indicates that the material is cut, while 0 indicates the opposite.
The frequency of acquisition of each of the variables mentioned is defined by its variability in the actual process. In the case of the pressure, the frequency of acquisition is 1 Hz. In the case of the temperature, a new value is recorded only if the process temperature has changed by 1°C or more compared to the last measurement. For the actual speed value, a measurement is recorded every 10 s, resulting in an acquisition frequency of 0.1 Hz. In the case of raw materials and dies, there is a record every time the final product type is changed. The same applies to the target value of the profilometer, and there is a new registry when the final product type is changed. Finally, the real profilometer value is recorded every second, resulting in an acquisition frequency of 1 Hz.
All the data is collected continuously in the process; that is, data are stored regardless of whether the production status is active or not. Although the data collected at the actual process are not defined in regular time intervals, these data are temporally correlated and ordered, so that, through appropriate signal processing methods, it is possible to obtain a time series structure. It is therefore interesting to select database architectures designed to handle these types of data. Compared with relational databases, time series databases are designed to store data taking into account their temporal relationship and their increasing cardinality. In addition to the efficient design of such databases, they often offer preprocessing functions typical of time series, such as missing data imputation, timeliness, or windowed aggregations.
In this work, the central data storage is an InfluxDB database, one of the most popular open-source time series database. Apart from being designed for storage time series data efficiently, InfluxDB works with a Grafana interface, being a database that is easy to use and visualize.
3.3. Digital Twin
The Digital Twin presented in this work aims to assist the operators in making the best decision whenever their intervention is needed in production. For that task, the Digital Twins need to be connected continuously to the central data storage, so that it can remain aware of the status of the physical system in real time. Through the combination of feature extraction from historical data and expert knowledge, supervised ML models (e.g., XGBoost and Random Forests) are used to approximate the extrusion process and predict readiness and quality, while a metaheuristic optimization finds parameter recommendations for quality maximization during restarts.
The production plant studied in this work requires decision-making by the operator every time the extrusion is restarted. When a new restart is required, the operator needs to assess whether the physical properties of the extruders are satisfactory and determine the best speed setups. The properties and configurations of the extruders are good if and only if the extruded material is not completely cut, and the material cut at the beginning of the process, related to the necessary stabilization time, is as short as possible.
To make this possible through continuous communication between the actual process, the operators, and the Digital Twin layer, the latter is divided into three sublayers:
-
• Data processing system: It extracts indicators from the central data storage to be used in the following sublayers.
-
• Extrusion status predictor: It predicts whether the extruders’ physical properties are good to initialize.
-
• Recommendation engine: It gives optimal parameters to initialize the process.
A more detailed description of the Digital Twin architecture, models, and implementation can be found in our previous work (Garate-Perez et al., Reference Garate-Perez, de Calle-Etxabe and Ferreiro2025), where the technical foundations of the proposed Digital Twin are presented in depth.
3.3.1. Data processing system
This layer is responsible for querying the central data storage, restructuring and imputing raw data, extracting indicators, and processing the data that is used by the extrusion status predictor and recommendation engine.
This layer contributes to two services of the proposal, which can be seen in Figure 4.
Workflows of the data processing system.

Figure 4. Long description
The flowchart is framed by two horizontal arrows spanning the top and bottom. The top arrow is labeled Every 5 s and the bottom arrow is labeled Every 2 h.
On the left, within a green background zone, is a cylinder icon labeled Central Data Storage with the Influx D B logo. An arrow points right through a purple square labeled Data cleaning and imputing to a rounded light blue rectangle labeled Data Processing System.
From the Data Processing System, the flow splits into two rightward paths.
1. The top path enters a light blue zone where an arrow bifurcates to point to two rounded rectangles: Extrusion Status Predictor in purple and Recommendation Engine in orange.
2. The bottom path enters a light yellow zone where an arrow points to a cylinder icon labeled Indicator database with the My S Q L logo.
The first service is to determine the physical conditions of the extruders at any given moment, with which the readiness predictor and the recommendation engine would be used to determine the predictions and recommendations of the extruders at any given moment. For this purpose, this service performs a query to the database every 5s, as shown in the upper part of Figure 4. Afterward, it checks whether the extruders are running or not, determining the need for decision support. If the extruders are not running, decision support is required. In such cases, the data processing system takes care of retrieving all the data from the central data storage related to this stoppage, performs data cleaning and imputation, and generates the corresponding indicators for the stoppage.
The second service is to store the indicators of all extrusion processes in a database, which would be used to train and retrain the data-based models proposed, as well as to have a representative history of what has happened in the plant. This workflow is represented in the lower part of Figure 4. In that case, the central data storage is queried by a programmed CRON service every 2 hours, where the indicators corresponding to that time interval are stored in a MySQL database, which is also integrated and accessible within the Digital Twin, as can be seen in Figure 1. To initiate this database and store the historical data available at the beginning of the project, the same methodology of cleaning, imputation, restructuring, and extraction of indicators has been applied.
Regarding the restructuring and imputing data, which is used in both of the workflows, InfluxDB functionalities were used. To analyze and select the best methods, historical data from 3 years was used. It was seen that the maximum frequency of acquisition was 1 Hz, and since the variables with lower frequencies were collected in that way because of their lower variability in the process, missing recordings were imputed with the last observation carried forward method, and data were restructured to equal time spaced time intervals of 1 Hz.
Once the raw data has been cleaned and imputed, it has to be processed to extract indicators to determine the status of the extruders before and during restarts and summarize the adopted configurations. This is the core of the data processing system. For this purpose, statistics are taken for the different physical properties measured, materials and dies, and quality measurements. For the temperature and pressure, mean, min, max, standard deviation, and first and last values were computed for all the extruders. For the speed, two indicators were taken; the selected speed setpoint and the acceleration needed to get the speed setpoint when starting from a stationary point. Regarding the extrusion quality variable, a good extrusion achieves the standard quality in the shortest possible time, minimizing waste. This is determined by calculating the time it takes for an extrusion to first reach the acceptable quality range in the longitudinal profilometer measurement and stay within it during the extrusion. For the variable indicating if the material is rejected or cut, the time it remains switched on is computed. Finally, for the variables related to the raw material and die identifiers, the initial and final material and die identifiers are computed, as the product type can be changed either at a standstill or during operation.
To differentiate between the conditions before and after relaunching the extruders, screw speeds are used. It is considered the process to be at a standstill if these speeds are null and in production otherwise. Therefore, by this differentiation for each restart and property statistic, there will be two variables, one indicating or summarizing the conditions just before the restart. In contrast, the other would indicate the conditions during the extrusion.
This way, the Digital Twin would have an overview of the properties of the extruders at all times, before and during extrusion. The variables or indicators that summarize the status of the extruders before a restart inform about the status and would help to find out, through the other components of this layer of the Digital Twin, whether it is a good time to restart the extrusion process. Meanwhile, the variables that determine the status of the extruders do not contribute to the decision-making, since the system configurations are decided before the start of the process. Nonetheless, storing this information is important so that process engineers have a comprehensive database containing indicators for all processes carried out in the plant.
3.3.2. Extrusion status predictor
This layer ensures that the properties and configurations of the process do not lead to a defective product that should be completely cutoff.
The model predicts whether the extruders are in the right status to restart the process whenever the data processing system requires it. For that, a prediction is made every 5s when the extruders are stopped. This avoids restarts, which leads to a process stoppage and an unavoidable waste of material. The workflow of this part of the layer is clarified in Figure 5.
Workflows of the extrusion status predictor.

For extrusion status prediction, a classification model is proposed that can differentiate between processes that are completely cutoff (class 2), processes that are not completely cutoff but do not reach the limits set in the profilometer (class 1), and processes that are not completely cutoff and stay within the limits set in the profilometer (class 0) with the information of the physical properties before extrusion restarts.
This discretization of the quality variable was motivated by the analysis of historical data. It was observed that a significant number of extrusion attempts were completely cutoff before any measurement could be obtained from the profilometer, as the extruded material was inspected and rejected by the operator at an early stage of the process. In addition, among the extrusions that passed the operator’s inspection, many did not reach the minimum quality thresholds established, resulting in the rejection of the entire extruded material despite operator approval. Therefore, before assessing the quality of an extrusion, it was necessary to distinguish between these qualitatively different failure modes. This categorization enables the training of a classification model that determines whether the physical conditions prior to restarting the process are sufficient to ensure a successful extrusion that meets the required quality standards.
In this way, by continuously reading the central data storage and processing the data by the data processing system, the classifier can determine when the right physical properties are present to launch a new process that reaches the required quality.
The classification is carried out with a Random Forest Classifier (Breiman, Reference Breiman2001). This is trained with the historical data of 3 years, which has the same data structure achieved in the data processing system. For the training, a train-test split of 80%–20% was done, and a 3-fold stratified cross-validation strategy was performed in the training set in order to fit the best hyperparameters of the model. The initial performance of the model with the F1 scoring was found to be 0.84 in the cross-validation and 0.87 in the testing.
To ensure that the model fits well once it has been deployed and new data has been added to the system, the retraining module ensures that the goodness-of-fit of the model is not degraded. In particular, retraining is evaluated on a daily basis and triggered when the F1-score falls below a predefined threshold. The retraining procedure is described in Section 3.6, while the update of the model performance metrics is detailed in Section 3.5.
If the predicted class of the status predictor is the one that reaches the profilometer and gets steady within the acceptable interval, then the recommendation engine is used to get the restarting suggestions and recommendations.
3.3.3. Recommendation engine
To enhance operational efficiency and ensure the production of high-quality products in the plant, optimizing the running parameters of the extruders is crucial. From the perspective of the investigated process, once optimal reset conditions are achieved, the optimal initialization conditions are determined through speed setpoints.
This part of the Digital Twin aims to propose or suggest suitable restart speed setpoints for the extruders so that this leads to minimum material loss, production time, and high-quality products. In terms of data analysis, this implies solving an inverse problem, since the ideal input variables should be sought to achieve a target output (Georgakis et al., Reference Georgakis, Chin, Wang, Hayot, Chiang, Wassick and Castillo2020).
One of the lines of research that has been carried out is to solve the problem as an optimization problem. In such cases, when data-driven approaches are considered, the optimization problem can be formulated using ML models as surrogates for the objective function and constraints, and solve or approximate the problem by metaheuristic algorithms such as evolutionary and genetic algorithms (EAs and GAs) (Pollice et al., Reference Pollice, Gomes, Aldeghi, Hickman, Krenn, Lavigne, Lindner-D’Addario, Nigam, Ser, Yao and Aspuru-Guzik2021). This approach is often referred to as surrogate-based optimization (Kim and Boukouvala, Reference Kim and Boukouvala2020).
In this case, constraints, the objective space, and the search space of the problem would be defined. This is done by using the indicators database, as shown in Figure 6.
Recommendation engine’s overview.

Figure 6. Long description
The flowchart begins on the far left with an Indicators Database represented by a cylinder icon and a My S Q L logo. An arrow points right to a scatter plot titled Search Space Definition, which shows data points on a grid with an x-axis from negative 1.0 to 1.0 and a y-axis from negative 1 to 2. An arrow from this plot leads into a large gray box titled Differential Evolutionary Algorithm. Inside this box, a D N A double helix icon and a gear icon frame four horizontal rows of colored blocks representing data arrays. Curved arrows indicate iterative processing between these rows.
Below the main pipeline, three yellow labels point upward into the algorithm box: Extrusion Status Predictor, Obj. function approximation, and Physical Constraints. On the far right, a factory icon with the Continental logo represents the production source. Arrows from the factory lead to Physical Constraints and upward to a yellow label for Production Demand. Production Demand then feeds back into the Differential Evolutionary Algorithm box from the right side.
For the constraints of industrial process optimization problems like this, it should be ensured that all the physical constraints of the machines are met. This includes the minimum and maximum temperatures and pressures that can be obtained in the extruders, the minimum and maximum values at which the extruder speeds can be set, and the relationship between the start-up and the final speed value that is possible to achieve with the extruders. Moreover, in this particular problem, we should take into account that not all extrusions became successful and that in many of them, the quality obtained is not even measured, since the material is completely cut before reaching the profilometer. Therefore, the extrusion status predictor is needed to be considered as a constraint approximation function for the optimization problem.
In terms of the decision space for this problem, consideration should be given to variables on which a decision is made before restarting the extruders and which are covered by the calculation of indicators. It is evident that this case is formed by the selected speed setpoints and initialization accelerations.
Moving on to address the definition of the objective space, the main objectives of the problems are considered: minimize the rejected material in a relaunched extrusion and restart only those that lead to compliance with quality standards.
Therefore, by approximating the objective function with an ML model, a simple objective nonlinear and constrained optimization problem is obtained. In order to solve the problem, a widely used genetic algorithm is considered, namely the differential evolutionary algorithm (Slowik and Kwasnicka, Reference Slowik and Kwasnicka2020; Premkumar et al., Reference Premkumar, Kumar, Dharma, Sundarsingh, Jangir and Alhelou2023). In Figure 6, the role of the algorithm is embodied.
The differential evolution algorithm applied follows the classical steps of initialization, evaluation, mutation, crossover, and selection, with modifications to handle constraints and leverage historical data. A tailored initialization strategy ensures a feasible starting population reflecting past process observations, while a constraint-handling mechanism incorporates physical and quality limitations directly into the DE framework. The algorithm searches iteratively for optimal parameters that maximize product quality while respecting process constraints. The effectiveness of this DE-based optimization approach has been previously validated in detail in our earlier work (Garate-Perez et al., Reference Garate-Perez, de Calle-Etxabe and Ferreiro2025), which demonstrates its ability to efficiently solve constrained, data-driven optimization problems in extrusion processes.
Transitioning from the conceptualization of the approach, the objective function is approximated by the Extreme Gradient Boosting model (Chen and Guestrin, Reference Chen and Guestrin2016), which is commonly known as XGBoost. The model was trained by a 80%–20% train-test split, where a 3-fold cross-validation strategy was made to find the optimal hyperparameters within the training set. As in the case of the status predictor, the initial model is trained by the 3 -year historical data. In this case, observations that are not measured in the profilometer have been discarded in the training, as there is no quality measurement for these samples. The metric selected for the regression is the Kendall correlation rate, and initial regression score obtained was 0.47.
Once the constraint function and the objective function explained above have been approximated, a separate problem must be solved for each of the types of products produced in the plant. In this way, optimal initialization values are found for each of the product types.
The optimization results are stored in a dataset. This dataset is updated each time the dependent models are updated, and the optimization is relaunched. Within the Digital Twin layer, if the data processing system detects that the extrusion is in a stop state and the extrusion status predictor predicts that the temperature and pressure conditions in the extruders are suitable for initialization, then the type of product to be processed is identified, and the corresponding optimal speeds are loaded.
The performance of this model is monitored through the Kendall correlation coefficient, and the model is retrained whenever this metric drops below a predefined threshold. The retraining strategy and metric update procedure are detailed in Sections 3.6 and 3.5, respectively.
To summarize the operation of the proposed Digital Twin layer, two ML models are trained, the one that predicts the readiness of the extrusion and the one that predicts the quality fitness of a configuration. The first will serve to avoid restarts that lead to downtime and material cost in the process, while the second will serve as a substitute for the objective function in the search for the best reinitialization parameters, which is performed by means of the differential evolutionary algorithm, as shown in Figure 6. Once the models are trained and the restarting configurations optimized, the Digital Twin starts a workflow every 5s, where the real-time signals are taken, and predictions and recommendations are given. The real-time workflow is shown in Figure 7. The 5s interval is used to define outputs as real time, according to the definition in the introduction, as it is sufficient to capture the dynamics of the physical process without generating redundant data.
Summary of the Digital Twin Layer approach. It describes the workflow that is triggered every 5s to get predictions and recommendations by means of the Digital Twin.

Figure 7. Long description
The workflow begins on the far left with Central Data Storage, represented by a cloud and database icon. An arrow labeled Trigger every 5s points right to a light blue box titled Data Processing System.
From the Data Processing System, an arrow points right to a purple box titled Extrusion Status Predictor. This predictor receives a top-down input from a yellow box labeled Readiness model binaries.
Below the Extrusion Status Predictor, an arrow points down to a yellow oval asking Ready to start? An arrow then points left from this oval to an orange box titled Recommendation Engine.
The Recommendation Engine also receives a bottom-up input from a document icon at the bottom center labeled Optimal speeds dataset.
3.4. Human–machine interface
The HMI is a bidirectional electronic system that allows connecting machines with humans, enabling the transmission of information from human to machine and from machine to human (Xu et al., Reference Xu, Chen, Zhu, Liu, Lan, Chen, Tang, Zhang and Li202 Reference Breiman4).
Specifically, when we talk about industrial contexts where intelligent systems like Digital Twins are adopted, it is important to convey the necessary information to operators, managers, or plant engineers, the information provided by the Digital Twin (Kumar and Lee, Reference Kumar and Lee2022).
Although implementing an HMI in the plant can be beneficial for process optimization and decision-making assistance, it tends to be a complex system in which the work of the operators cannot be dispensed with. Therefore, it is important to propose HMIs that do not involve an extra cognitive load and are easy to use and interact with (Aceta et al., Reference Aceta, Fernández and Soroa2022).
Therefore, this work proposes an “ethics by desig” strategy, aiming to display the information provided by the Digital Twin in a manner that is visual, understandable, and reliable. The goal is to avoid misunderstandings and respect the operators’ sovereignty. To ensure compliance with ethical standards throughout the development process, the proposed Digital Twin has been subject to continuous review by both an independent ethics committee and the industrial engineer responsible for the deployment at the production plant. The core principles and recommendations defined within this governance framework are publicly available on the project website AI-PROFICIENT (https://ai-proficient.eu), which funded this work.
Beyond conventional usability and performance indicators, the evaluation of the proposed HMI was guided by qualitative ethical criteria established during these review activities. These criteria addressed key dimensions of human–AI interaction, including the preservation of human agency, the avoidance of coercive or prescriptive automation, the clarity and nonambiguity of recommendations, the minimization of operator cognitive load, and the prevention of additional operational stress. Particular emphasis was placed on the explicability of model predictions, ensuring that AI outputs could be understood, contextualized within the current process state, and critically assessed by operators.
These criteria were assessed through an iterative and participatory design process involving ethics experts, and the plant’s responsible engineer. Early HMI prototypes were evaluated in dedicated review sessions and refined through structured discussions, allowing operational constraints and operator feedback to directly influence interface design choices. The resulting ethical principles were subsequently translated into concrete HMI design decisions, which are summarized below.
-
• Digital Twin system’s predictions and suggestions are only shown during an extrusion stoppage. Since, the DT system is designed to only suggest and predict during production, showing that information could lead to misunderstandings. In order to know when to display these suggestions and predictions, the screw speed of the extruders is used, so that the information provided by the system is hidden when the extruders are running.
-
• For the purpose of showing a clear and concise message, the information provided has the following characteristics:
Extrusion Status Prediction: The extrusion status prediction model is a classification model that determines or predicts three possible classes. As these three classes indicate the suitability for a restart, they are shown as a traffic light, where the most suitable class is represented by a green light, the intermediate class by a yellow light, and the least suitable class by a red light. Therefore, if we rescue the definition of these classes mentioned above, the traffic light will indicate:
-
1. Green Light: Extrusion Status Predictor has predicted that if the extrusion is going to be launched, the process will not be completely cutoff and will stay within the limits set by the profilometer.
-
2. Yellow Light: Extrusion Status Predictor has predicted that if the extrusion will be relaunched, then the extrudate is not going to be completely cut, but the measure on the profilometer will not get steady within the limits.
-
3. Red Light: Extrusion Status Predictor has predicted that if the extrusion is going to be relaunched, it will be completely cut, and the process will be stopped.
AI recommendations: System recommendations are only shown when extruders are not in use, and the predicted status gives a green traffic light. This way, suggestions only would appear if an extrusion relaunch is feasible.
For a clear and concise display of the suggestions, only the information corresponding to the detected product type is displayed, that is the extruders that will not be used are filtered out. Furthermore, a differentiated line is used for each of the extruders, which are also ordered by plant identifiers.
-
• Every prediction and suggestion given by the Digital Twin layer are just recommendations so that the operators are not obligated to follow them. At any point in the process, only operators can decide whether to take one decision or the other.
All these features have been validated by the ethics committee, resulting in a “human-centered” HMI design. This approach minimizes the worker’s workload, reduces potential misunderstandings as much as possible, and ensures that decision-making capacity always remains with the human, who can always choose whether or not to follow the recommendations provided by the Digital Twin.
3.5. Feedback module
A feedback system has been implemented and deployed for the continuous improvement of the Digital Twin.
Feedback systems in the industrial context recommender systems can facilitate understanding and reliability among plant workers (Honeycutt et al., Reference Honeycutt, Nourani and Ragan2020). In addition, considering feedback collection mechanisms when interacting with humans on such problems can help improve the AI models deployed (Liu et al., Reference Liu, Song and Liu2023).
Two types of feedback mechanisms have been studied in the literature in the context of industrial AI systems (Yu et al., Reference Yu, Guo, Shen, Wang, Lin and Sato2022). The first of these is implicit feedback. This type of feedback collects automatically information related to the machine–human interaction in an implicit way, that is without directly involving the human’s actions. In the case of explicit feedback, however, feedback is requested from the collaborating human. In other words, the difference between these two types of feedback can be defined by human intentionality. The second case is implicit feedback: the human does not perform it intentionally; it is a mere consequence of the interaction with the machine, while in the case of explicit feedback, the human performs feedback intentionally (Mandal and Maiti, Reference Mandal and Maiti2020).
In this study, only implicit feedback is considered. All the feedback has been stored in a MySQL database, where different tables were deployed in order to store the required feedback information. Feedback tables are updated each time the data processing system updates the indicators database for model improvement, that is, every 2 hours.
Regarding the readiness model, with the use of the real status values and predicted values, the F1-score is updated by adding the new samples to the base F1score obtained with the last model version. In order to record the metrics of the model versions, a table is added to the models’ degradation database. In this table, 9 values of the confusion matrix are stored, as long as, the model version, a variable indicating whether the values correspond to the base metric or to an update, and another column to store the F1-score for each of the cases. That way, the F1-score can be easily updated by only using the previous metrics.
For the recommendation engine, the Kendall Correlation rate is stored every 2 hours in the feedback database. Along with the prediction metric value, a binary object is also stored with the real and predicted labels of the target variable in the objective function of the engine with the data from the last retrained model. Along with the model degradation control, the recommended and used speed values are also stored in the database.
3.6. Retraining module
The retraining module facilitates continuous adaptation to real-world dynamics when working with a deployed AI system. Central to this module is the management of model performance and its degradation over time, necessitating meticulous storage of performance metrics and tools for deciding when and how to retrain. Ensuring data quality and that the data distribution remains constant is paramount for maintaining trustworthiness in AI systems, particularly in contexts where there is a human-machine interaction (Preethi Lahoti and Gummandi, Reference Preethi Lahoti and Gummandi2023).
In a constantly changing manufacturing process, as the one studied in this work, it is essential to control model degradation during its life cycle. More concretely, products currently manufactured at the plant may be discontinued due to changes in demand. Likewise, it is common to introduce new products to meet the demand. Similarly, if the product types changes, the speed, temperature, pressures, and profilometer measures would change as the physical properties are related to the product types.
Implicit feedback values are used to control models’ degradation and assure their robustness. For that, this module is responsible for checking whether retraining is needed in each of the deployed models. This module is computed by a CRON service that is programmed on a daily basis, specifically every 04:00 AM.
In the following, it is explained how the feedback is used for the retraining of each of the models, and how this retraining is done.
3.6.1. Extrusion status predictor
As the initial F1-score of the model trained by historical data is 0.84, it is considered that the model has degraded considerably if the F1-score is less than 0.8 (<0.8). If this value is not exceeded, then it is considered that the model needs to retrain.
For the retraining of the extrusion status predictor, a variation of the Adaboost algorithm has been defined, taking into account the predictions made with the model that has been decided to discard. This, in addition to being able to retrain and search for the appropriate hyperparameters and parameters for the dataset expanded with the new observations obtained, offers a possibility to focus on those observations that did not achieve good predictions and lead to the degradation of the model. The only difference between the original algorithm and the one proposed in this problem is the weighting mechanism in the first iteration of Adaboost when the retraining begins.
The algorithm is defined as follows. Suppose we have a model
$ {\mathcal{M}}_k $
 that is considered degraded, which has been trained with the dataset
$ {S}_k $
 containing a total of
$ {N}_k $
 observations. We define the added samples as the dataset
$ {S}_{k+1}\backslash {S}_k $
 of
$ {M}_{k+1} $
 observations, where
$ {S}_{k+1} $
 is the expanded dataset. The expanded dataset is defined by
$ {N}_{k+1}={N}_k+{M}_{k+1} $
 samples, and they are the samples for retraining of the model
$ {M}_{k+1} $
 . The weights corresponding to the first iteration when using Adaboost for the retraining of the model are defined as follows:
-
1. Error rates of the $ {\mathcal{M}}_k $
 model predictions on
$ {S}_{k+1} $
are computed. This is made by the set difference between the readiness errors database on the columns defining the confusion matrix. That way, error rates for the class
$ 0 $
,
$ 1 $
, and
$ 2 $
are computed,
$ {error}_0,{error}_1 $
and
$ {error}_2 $
, respectively.
-
2. Alpha values of the Adaboost algorithm are computed for $ {error}_0 $
,
$ {error}_1 $
and
$ {error}_2 $
:


for all the
$ {x}_i $
 samples in
$ {S}_{k+1} $
 .
-
3. Weights for the set $ {S}_{k+1} $
are computed as follows:


where
$ i $
 is the true class of
$ {x}_j $
 and
$ {\mathcal{M}}_k\left({x}_j\right) $
 the predicted class with
$ {\mathcal{M}}_k $
 . That way, every nonnormalized weight is defined.

-
4. Finally, all the weights are normalized as follows:

for every
$ {x}_j $
 in
$ {S}_{k+1} $
 .
Starting from those initial weights, the Adaboost algorithm remains the same as the original. Thus, the weights of the samples in the retraining are based on the knowledge generated by the previously deployed model, and these weights are updated according to the Adaboost algorithm and the classification results obtained by the Random Forest algorithm.
Finally, when the new model is already trained, the binary files related to the readiness model are updated, as long as the model version is in the whole Digital Twin. Moreover, the base results of the new model are updated in the table of the extrusion status predictor’s metrics explained above.
3.6.2. Recommendation engine
In the case of the recommendation engine, implicit feedback has been used for the improvement of the models and algorithms involved. The retraining module works differently depending on the following cases:
-
• New product type has been detected: For this case, the objective function is retrained, optimization is relaunched, and optimal speeds are updated.
-
• Prediction and recommendation errors
Every time the updated Kendall score is less than 0.6, and the XGBoost model is retrained. Since retraining in the objective function approximation can affect the optimal speeds’ search, the optimization needs to be relaunched every time the model is changed.
In the case of training the model that approximates the objective function of the recommendation system, retraining is done in a straightforward manner, where the model’s parameters are readjusted using the same technique employed in the initial training, as explained in the Digital Twin Layer.
3.7. System resilience
To ensure system resilience against failures, the entire system is constructed by different dockers containers as shown in Figure 8. The entire system responsible for connecting the different types of databases, predicting, and updating the Digital Twin is contained within a single container. The MySQL databases of the system are located in different containers, which are connected to the HMI and the Digital Twin. The central Data Store is located in a separate container, and it is only connected to the Digital Twin. Finally, the HMI is in a separate container, which in turn is connected to the MySQL databases and writes and reads information from them.
Escheme of the docker containers and interactions between them.

All actions of the system are recorded through logs, which are updated based on a maximum number of lines and files and are refreshed upon reaching these limits. The system recognizes if information is not transferred from the Digital Twin to the HMI, and if this occurs, it sends a notification to the developer via email. In this way, the developer can understand why and when the system stops working, which contributes to making the system robust against failures.
4. Results and impact
The following sections discuss the experimentations carried out in order to prove the validity of our approach for the Digital Twin requirements stated in the introduction.
4.1. Computational cost
The computational time required to provide suggestions and predictions by the virtual replica was measured through 160 independent and real-time runs within the deployed system. Each run involved the computation of seven different time values.
Firstly, the time required to determine the temporal range for making predictions was calculated. This involved identifying the starting point from when the extruders stopped and measuring the elapsed time up to the current moment. If the elapsed time exceeded 10 minutes, only the data from the last 10 minutes was considered. Secondly, the time needed to query the influx data within the specified elapsed time was determined. Thirdly, the time required to clean and process the raw data obtained from the influx query was calculated. Fourthly, the time needed to access the optimal speeds table and retrieve the optimal values for the desired product was computed. Fifthly, the time taken to predict the extrusion status was assessed. Sixthly, the time needed to incorporate suggestions related to the overall predicted situation was computed. Finally, the time required to update the HMI was measured.
For the visualization of the costs, Figure 9 shows the boxplots regarding to each of the measured computational costs. As it can be appreciated, the time required to query and get influx data is the most costly task. For the other cases, the values are close to zero. More precisely, the median is zero for all those tasks, and the mean value is less than 0.02 for all the cases as well. For the influx query, the median is 3s, the mean value 2.81s, and the corresponding value to the 0.98 quantile is 4s. The maximum computational cost is achieved for the influx query and has been about 11s. For the other cases, the maximum value has been achieved with 1s.
Computational cost needed in real-time execution. Costs after 160 prediction runs of the system.

Figure 9. Long description
The y-axis is labeled Seconds with a scale from 0 to 9. The x-axis is labeled with numbers 1 through 7, corresponding to a legend on the right.
Task 1: Timings calculation. Shows a flat line at 0 with one outlier near 1.
Task 2: Influx query. This is the primary cost, with a box spanning from approximately 2 to 4 seconds, a median at 3 seconds, whiskers extending from 0 to 5, and a high outlier near 11.
Task 3: Data cleaning and processing. Flat line at 0 with one outlier near 1.
Task 4: Optimal setpoints. Flat line at 0.
Task 5: Time to predict. Flat line at 0 with one outlier near 1.
Task 6: Suggestions. Flat line at 0 with one outlier near 1.
Task 7: Update M y S Q L s. Flat line at 0 with one outlier near 1.
For the analysis of the total time needed in each of the executions, Figure 10 depicts the density and cumulative probability curves of the sum of the time needed to complete the 7 tasks. The Digital Twin triggers the central data storage every 5 seconds, meaning that the time needed to complete a single run with the replica must be less than or equal to 5 seconds. As shown in Figure 10, the cumulative probability curve illustrates that 98.2% of the runs meet this requirement. This observation is also evident in the density plot, where it is apparent that most of the samples fall below 5 seconds. This is further validated by the skewness, which exceeds 0 (specifically, 0.68), indicating that the distribution tail is located on the right side of the curve.
Density and cumulative probability curves for the overall computational costs in each Digital Twin execution with 160 executions. 98.2% of the calls were computed in <5 seconds.

Figure 10. Long description
The graph features a horizontal x-axis representing time in seconds with intervals from 0.0 to 12.5 and a vertical y-axis representing probability from 0.00 to 1.00. Two curves are plotted.
* The Density curve, shown in dark teal, begins at 0.0 and shows a small peak near 0.0 seconds, followed by a larger, bimodal peak between 2.5 and 5.0 seconds, before dropping to near zero for the remainder of the x-axis.
* The Probability curve, shown in orange, is a cumulative sigmoid-style curve that rises sharply between 2.5 and 5.0 seconds.
* A vertical dashed gray line is positioned at the 5.0-second mark on the x-axis. At the intersection of this line and the orange curve, the value 0.982 is labeled in orange, indicating that 98.2 percent of the data falls below the 5-second threshold.
* A legend on the right identifies the teal line as Density and the orange line as Probability.
4.2. Adaptability to the production: continuous model improvement
To compare and measure the effectiveness of our proposal to prevent model degradation and maintain its accuracy during the deployment of the Digital Twin, the results over 37 days while the models were running were compared.
4.2.1. Extrusion status predictor
In this case, three approaches were compared. Firstly, the F1 metric change was registered without any model retrainings. Secondly, models were retrained and F1 stored by the same methodology in the initial model approach (simple retraining), that is, not taking into account the previous model’s error and equally weighting the samples. Finally, the presented Adaboost (adaboost retraining) approach was tested, and F1 scores were recorded.
As shown in Figure 11, the F1 score starts to decay in a few days very quickly, and after 5 days, it is maintained between 0.5 and 0.6 which, compared to the initial value of 0.84, is quite low. It can also be seen that both retraining strategies allow to maintain the F1 score near to the initial one. The Adaboost retraining method has been retrained two fewer times than the simple retraining method, having 35 retrainings, while the simple retraining had 37.
Comparison of different retraining methods during 37 days deployment. Cross-validation and test results obtained in the retraining showed. In cases where no retraining was performed, the cross-validation and test results are updated by the database recording metrics.

Figure 11. Long description
A line graph with the Y-axis labeled F 1 score ranging from 0.6 to 0.9 and the X-axis labeled Days ranging from 0 to 37.
* C V adaboost retraining (light orange line): Starts at approximately 0.84, immediately jumps to 0.95, and remains stable at that high level throughout the period.
* C V simple retraining (dark green line): Starts at 0.84 and maintains a very stable horizontal trend around 0.79.
* No retraining (black line): Starts at 0.84 and shows a steep exponential decay within the first 5 days, dropping to approximately 0.56, before showing a slight, slow recovery toward 0.60 by day 37.
* Test adaboost retraining (pink line): Starts at 0.84, drops slightly, and fluctuates between 0.76 and 0.79.
* Test simple retraining (blue-grey line): Closely mirrors the C V simple retraining line, maintaining a stable trend around 0.78 to 0.79.
All methods start at the same point on day 0. The retraining methods (AdaBoost and simple) significantly outperform the no retraining baseline, which fails to maintain performance after the initial deployment.
In the case of the F1 scores obtained during training, it is clear that the adaboost strategy achieves significantly higher performance in cross-validation, consistently staying close to 0.95. However, in the test values, both the simple and adaboost strategies achieve similar results. Given this, we can consider that the adaboost strategy improves over simple retraining, requiring fewer model updates. Although this advantage may not be substantial, adaboost demonstrates a more efficient and reliable performance in maintaining high accuracy.
4.2.2. Recommendation engine
Regarding the recommendation engine, only a simple retraining was performed for the objective function approximation model. For that, the same strategy as in the initial model training was followed. This retraining has been compared with no model retraining strategy, and the Kendall correlation scores were stored for both cases. The Kendall correlation coefficient is used to evaluate the model’s ability to correctly rank different extrusion runs according to their resulting quality. Therefore, low values of this metric indicate that the model is not able to reliably quantify whether a given combination of speed setpoints leads to a better extrusion quality than another, increasing the uncertainty of the optimization process and potentially leading to erroneous recommendations.
As it is outlined in Figure 12, model degradation is evident when a retraining plan is not considered. Specifically, the Kendall correlation score decays to almost zero in a few days, and after 4 days, the value is maintained between 0.15 and 0.25, which represents poor ranking performance and would result in unreliable optimization outcomes.
Comparison of different retraining methods during 37 days deployment. Cross-validation and test results obtained in the retraining showed. In cases where no retraining was performed, the cross-validation and test results are updated by the actual prediction metrics with the previous model version.

Figure 12. Long description
The X-axis represents Days from 0 to 37. The Y-axis represents Kendall score from 0.00 to 1.00. A legend on the right identifies three lines.
* C V retraining (pink line) maintains a stable horizontal trend around a score of 0.40 throughout the period.
* Test retraining (teal line) follows the same stable trend at 0.40 but features a sharp vertical spike reaching a score of 1.00 at day 11 before immediately returning to 0.40.
* No retraining (black line) starts at 0.45, drops sharply to near 0.00 by day 2, recovers to approximately 0.25 by day 5, and then stabilizes into a flat line at roughly 0.20 for the remainder of the 37 days.
When compared to the retraining strategy, it is evident that the approach is able to maintain the Kendall correlation score near its initial value, between 0.45 and 0.5, as shown in Figure 12. Although this initial correlation is not high, the proposed methodology effectively prevents further degradation over time. From 37 days of retraining, 36 retrains were required, occurring every day except on the 12-th day, where an almost perfect prediction was performed.
In consequence, the retraining module for the recommendation engine is able to avoid model degradation and preserve the ranking capability of the model throughout deployment. While the model metrics do not improve over the 37 days studied, this behavior supports a continuous improvement framework by preventing the accumulation of errors in the optimization process.
4.3. Process integration and usability
The usability of the system can be measured from many perspectives, but all should answer how well the Digital Twin adapts to the needs of the workers and the plant. In this specific problem, the intention was to answer the questions of how many predictions the model is capable of providing at times when they are needed, how many suggestions it gives versus how many it is unable to give due to having unknown or new products, and how these values are distributed over time, usage, and production. This comparison is necessary since new or unknown products require more time to achieve optimal configurations, which implies more time in stoppage, intending to restart the extruders. Therefore, a high percentage of no suggestions may be related to this required time. It is clear that a longer configuration time implies a higher production cost in which the Digital Twin is not capable of providing a solution, but this value does not directly imply that the production for that day has been substantially diminished, as there may be other products that are known and for which the Digital Twin can provide suggestions, but the downtime in these cases is less, thus having a lower volume of suggestions and predictions generated.
As the extrusion status predictor is not product type-dependent, it can provide predictions regardless of whether the products selected for a given day have been previously seen or are new to the Digital Twin. This implies that the Digital Twin is able to predict the extrusion status and provide it to the operators in the 100% of the time.
Regarding the ratio between being able to give a suggestion or not, the value depends on how many products have not been seen each day out of all the planned products, and how much downtime has been required to work with them. Even if a product is new or unseen on a given day, the feedback and retraining modules ensure that this new product is considered in the Digital Twin for the following days. The suggestion rate that the proposed system is capable of giving has been calculated since it was put into operation in the production plant. The evolution of the rate is shown in Figure 13, where the actual value given by the presented approach is compared by not deploying the feedback and retraining modules. The rates are computed taking into account the amount of suggestions with configurations that are given by the Digital Twin versus the suggestions with new product warning that are given per day.
The suggestion ratios since the Digital Twin was deployed in the plant, showing the values both with and without considering the system’s continuous improvement.

Figure 13. Long description
The y-axis is labeled Rate and ranges from 0.00 to 1.00 in increments of 0.25. The x-axis is labeled Date with markers for jul. and oct. A legend to the right identifies two data series. A dark teal line represents continuous improvement and a light red line represents without improvement. The area under the teal line is shaded light blue. The continuous improvement line remains consistently high, fluctuating near the 1.00 mark for the entire duration, with one significant sharp drop toward 0.60 just before the oct. marker. The without improvement line shows high volatility, frequently dropping to 0.00 and fluctuating between 0.25 and 0.75. After the oct. marker, the without improvement line shows a steady upward trend, eventually converging with the continuous improvement line at 1.00 at the far right of the graph.
Analyzing these ratios, it can be seen that the average is at 0.975, which in other words means that the system is capable of providing configuration suggestions to the user 97.5% of the time on average. In comparison, this value would decrease to 0.609 if the feedback and retraining modules were not considered. These differences are shown more remarkably in Figure 14.
The suggestion ratios boxplots since the Digital Twin was deployed in the plant, showing the values both with and without considering the system’s continuous improvement.

If, instead of considering the number of valid and invalid suggestions that the system can provide, the focus is placed on the number of products with and without suggestions made each day, we obtain the results shown in Figure 15. In this case, the difference between the two scenarios is higher, and with Figure 15, the ability of the proposed system to adapt to changes in production can be seen more clearly. In this case, the mean rate of known recipes, and consequently, the ability to give suggestions is 0.959 and 0.481, respectively, for the continuous improvement and not improvement approaches.
The ratio of the type of products with suggestions per day. Curves related to deploying a continuous model improvement and not deploying are shown.

Figure 15. Long description
The line graph features a horizontal X axis labeled Date with markers for jul. and oct. and a vertical Y axis labeled Rate ranging from 0.00 to 1.00 in increments of 0.25. Two data series are plotted.
1. The continuous improvement line, colored dark teal, starts at approximately 0.45 and rapidly ascends to 1.00. It remains highly stable near the 1.00 ceiling throughout the entire period, showing only minor downward spikes that rarely drop below 0.80.
2. The without improvement line, colored salmon orange, exhibits high volatility. It begins near 0.35 and fluctuates wildly between 0.20 and 0.80 during the first half of the chart. After oct., it shows a steady linear climb to reach 1.00 before sharply crashing back down to 0.00 at the far right of the timeline.
A legend on the right identifies the dark teal line as continuous improvement and the salmon orange line as without improvement.
Regarding the production time associated with executions related to recipes known by the system per day, it has accounted for an average of 98% of the production time, while this percentage is decreased to 61.2% without a continuous improvement of the system. These results are outlined in Figure 16.
The ratio of the durations of products with suggestions per day. Curves related to deploying a continuous model improvement and not deploying are shown.

Figure 16. Long description
The X-axis is labeled Date with markers for jul. and oct. The Y-axis is labeled Rate and ranges from 0.00 to 1.00 in increments of 0.25.
Two data series are plotted:
* Continuous improvement (dark teal line): This curve remains consistently high, maintaining a near-constant value of 1.00 with very minor downward fluctuations throughout the entire period.
* Without improvement (orange-red line): This curve is highly volatile. It begins with sharp oscillations between 0.50 and 1.00. Following jul., it shows a gradual decline with a sharp trough near 0.25 before oct. It then spikes back to 1.00 before dropping sharply to 0.00 at the end of the timeline.
A legend to the right of the plot identifies the dark teal line as continuous improvement and the orange-red line as without improvement.
The system’s ability to adapt to changes in production not only ensures the capability to control model degradation but also guarantees that the Digital Twin is able to respond to the needs of the plant and the operators.
4.4. Process optimization and improvement
As mentioned above, the improvement of the process can be measured according to two variables: reduced restarting time and improved product quality.
For this purpose, the average time required to successfully relaunch an extrusion is measured before and after the deployment of the Digital Twin, as well as the product quality in terms of minimum material loss and production time, before and after the deployment.
Without the Digital Twin proposed in this article, the plant workers do not know the best time to restart the extrusion and the best way to do it. Through the Extrusion Status Predictor, operators can determine when it is a good time to launch the extrusion. In this way, it is possible to avoid start-ups that lead to an undesired product and save on time and material.
To quantify how much undesirable extrusions are avoided with the Digital Twin, how many nonconforming extrusions were needed on average to get specification-compliant extrusions before and after model deployment has been measured.
To see how the proposal can improve the process in the mentioned way, the predictions of Extrusion Status Readiness and the actual readiness values of the extrusions made since the deployment are compared. For each time a type of product has been required to be produced, it is calculated how many times the model predicts suitability for initialization when this is not met until the predicted suitability matches the actual value. In this way, the number of failed extrusions made that could not be avoided by the Digital Twin would be computed. Similarly, the calculation of the number of failed extrusions made before obtaining an extrusion that leads to an appropriate product before the deployment of the models is carried out using the historical values of readiness. That is, it calculates how many failed extrusions have been historically made each time the manufacturing of a type of product begins, until reaching the extrusion that leads to a production that meets the necessary requirements.
To illustrate the previously described concept, let us consider a practical example that demonstrates the calculation. Let’s take a product
$ A $
 for which 2 extrusion was performed before getting a stable and specification-compliant extrusion, with respective real statuses of 1,2 and 0. Suppose that the Readiness Status Predictor predicts, 0,2,0 values for those extrusions, then, within the Digital Twin explained, the second extrusion would be avoided. Thus, the amount of nondesirable extrusions would be reduced to 1. This example is elucidated in Table 1, where two more examples are shown.
Illustrative example of the calculation of undesired extrusions performed before and after the Digital Twin, for 8 consecutive extrusions with three different types of products arranged chronologically from left to right

Table 1. Long description
The table consists of nine columns. The first column lists the row headers, and the subsequent eight columns represent consecutive extrusions.
Row 1: Product type. The first three extrusions are type A, the next two are type B, and the final three are type C.
Row 2: Real readiness status. Values are 1, 2, 0, 1, 0, 2, 2, 0.
Row 3: Predicted readiness status. Values are 0, 2, 0, 1, 0, 2, 1, 0.
Row 4: Failed restarts before deployment. Values are 1, 2, 2, 1, 1, 1, 2, 2.
Row 5: Failed restarts after deployment. Values are 1, 1, 1, 0, 0, 0, 0, 0.
The data shows a reduction in failed restarts to zero for product types B and C following deployment.
By calculating the improvement that the plant implementation of the Extrusion Readiness Status Predictor can bring, it is observed that on average, previously, 1.473 failed extrusions were needed to reach those that meet the industry’s requirements, whereas following the model’s guidelines could reduce the value to an average of 0.01 failed extrusions, which implies a 99% reduction. A McNemar test comparing the probability of failure between the real process and the model-guided process yielded
$ p=4.89\cdot {10}^{-296}<0.01 $
 , allowing the conclusion, at a 0.99 significance level, that the probability of launching defective extrusions is significantly different when using the Readiness Status Predictor.
Regarding the measurement of the improvement made in terms of the quality of the manufactured products, the time required for the stabilization of the quality of the extruded products has been compared with and without the Recommendation Engine.
The average time required to reach a stable value close to the acceptable default value on the profilometer without having the system deployed has been 43.676 seconds, while the value is reduced to 7.723 seconds as predicted by the ML model used in the recommendation engine module, following the optimal guidelines found by the optimizer. This change means that the Digital Twin could reduce 82% of the time needed to get the steadiness in the profilometer, which means a substantial reduction in material waste and production times, as well as an improvement in product quality.
4.5. Human in the loop
The “human centered” approach enables a user-friendly and intuitive system capable of providing clear and accessible results on the screen without requiring specialized training from the operator. By allowing the operator to simply observe the screen for relevant information, the Digital Twin ensures an intuitive and efficient user experience. This ease of use translates into greater operational efficiency, as the operator can quickly access necessary data without the need for additional steps or complex queries. Furthermore, by eliminating the need to interpret complex data or perform calculations, human errors are reduced, and decision-making is improved. Additionally, it consistently provides accurate responses in all interactions, even if the model fails, the operator receives a response. This ensures consistency, reliability, and robustness in the system’s operation.
Considering all ethic characteristics outlined previously, Kibana has been used for the HMI.
As shown in Figure 17, the traffic light that corresponds to the readiness status in the profilometer appears just at the top of the screen. If the traffic light is green, as it happens in Figure 17, then the suggestions are given, with a separate rectangle for each of the extruders that are going to be used to produce the aimed product type.
Human-machine interface overview in Kibana. Readiness and suggestions during a stoppage in the plant. Setpoint speed and initial acceleration values have been scaled with a min–max scaler for compliance with confidentiality of knowledge of the process under study.

As explained before, suggestions and readiness are hidden once the extrusion is restarted. This is illustrated in Figure 18.
HMI screen when the extruders are in use. All suggestions are hidden.

Furthermore, if the extrusion status predictor predicts that the extrusions are not ready to restart, the screen of Figure 19 is displayed.
HMI screen displays when the predicted readiness is red. The same screen is displayed when the predicted readiness is a yellow traffic light, but the horizontal bar is yellow.

Another key condition when using the HMI is to detect whether the detected product type has never been produced before in the plant. When this happens, the recommendation engine has not learned anything about this type of product, and therefore, offering a recommendation may not be reliable. Thus, a corresponding message is printed, and suggestions are not given, as shown in Figure 20. Once the optimal speeds table is updated, suggestions for the new product type will be shown automatically.
HMI screen appearance when a new product type is detected. Extrusion status predictor can detect the readiness of the extruders concerning the restart, but the recommendation engine is not able to provide a suggestion.

Finally, in order to streamline the health of the connexion between the Digital Twin layer and the HMI, a complementary light has been added. This is shown in all HMI-related Figures. Taking as an example Figure 20, a small green light can be seen in the top left of the figure.
In line with the ethics-by-design principles described in the Methods section, the HMI results presented above can also be interpreted from a qualitative ethical perspective focused on the role of the human-in-the-loop. This interpretation does not constitute an additional experimental result, but contextualizes how the reported HMI behaviors support human-centered interaction during critical extrusion restart phases.
As shown in Figures 17–20, predictions and recommendations are displayed conditionally according to process state and system confidence, thereby limiting cognitive load and reducing the risk of misinterpretation. The suppression of recommendations during active extrusion, the explicit handling of previously unseen product types, and the clear signaling of system readiness and connectivity reinforce operator autonomy and trust. Overall, these results illustrate how human-in-the-loop considerations act as a cross-cutting ethical design dimension that complements the quantitative performance results of the proposed Digital Twin.
5. Conclusions and future works
This study advances the concept of Digital Twin from theoretical conjecture to a practical application in tire manufacturing processes, utilizing ML models. The primary objective was to enhance manufacturing operations by enabling real-time identification and control of critical physical parameters essential for precise machine initialization and optimal process settings, which has been successfully achieved.
The implementation of the Extrusion Readiness Status Predictor within this framework demonstrated significant process improvements. Specifically, the average number of failed extrusions required to achieve industry-standard products, according to the results obtained in this study, was reduced to 99%. Additionally, the time needed to stabilize the quality of extruded products by the use of the Recommendation Engine could also be reduced to 82%.
Furthermore, the average computational cost of the system ensures that the updates occur within the required time intervals, confirming the practical viability of the Digital Twin. The architecture also showed adequate usability and adaptability to production demands. The ethical considerations incorporated into the HMI design place the operator at the center of the approach, reinforcing the human-centric nature of this technological advancement.
Regarding the future directions of this work, although the ability of the Digital Twin to adapt to changes in production demand has been demonstrated with a delay of 1 day, it could be interesting to work with an incremental learning approach, as is being studied in Zhou et al. (Reference Zhou, Yang and Zhan2022) and Laohakiat and Sa-ing (Reference Laohakiat and Sa-ing2021). This way, the recommendation engine could immediately give recommendations for new product types. In addition, future work should investigate concept drift detection methods to automatically identify model degradation over time (Brito et al., Reference Brito, Kondo, Loures, Santos, Barbosa, Šormaz, Bidanda, Alhawari and Geng2025; Li and Hsieh, Reference Li and Hsieh2025). In the present study, model degradation is monitored through validation metrics and predefined thresholds derived from the initial model performance, which, while effective, may not be the most suitable strategy for continuously operating systems subject to evolving process conditions.
Finally, it could be valuable to study how explicit feedback from the operators could improve the proposed Digital Twin. In particular, in an optimization scenario with many machines and products, such as the one studied, the operators could help to enhance the feasibility region of the recommendation engine, thus iteratively improving the system.
Acknowledgements
This work acknowledges the AI-PROFICIENT project and all its participants involved. Special acknowledgment to Continental France SAS, which has provided domain knowledge and data for this study. Acknowledgments also to Aitor Arnaiz and Kerman López de Calle-Etxabe for obtaining the funding and the projects necessary to carry out this research work.
Author contribution
Conceptualization: E.G., K.L., B.C., S.F.; Methodology: E.G., K.L.; Investigation: E.G., K.L.; Data curation: E.G.; Validation: E.G.; Data visualization: E.G.; Software: E.G., A.G.; Writing original draft: E.G., K.L.; Writing review & editing: all authors; Funding acquisition: A.A.; All authors approved the final submitted draft.
Data availability statement
The data used in this study are owned by Continental SAS France and are confidential. However, parts of the code used in this study are available at https://github.com/eidergarate/human-centered-dt and have been archived on Zenodo (DOI: 10.5281/zenodo.20812385).
Funding statement
This research was supported by grants from the European Union’s Horizon 2020 research and innovation program under grant agreement No. 957391, Basque Government’s Elkartek Programme BEREZ-IA 2023 under grant agreement No KK-2023/00012, and GREKO 2024 under grant agreement No. KK-2024/00090.
Competing interests
The authors declare that they have no competing interests.
Ethical standard
The research meets all ethical guidelines, including adherence to the legal requirements of the study country.
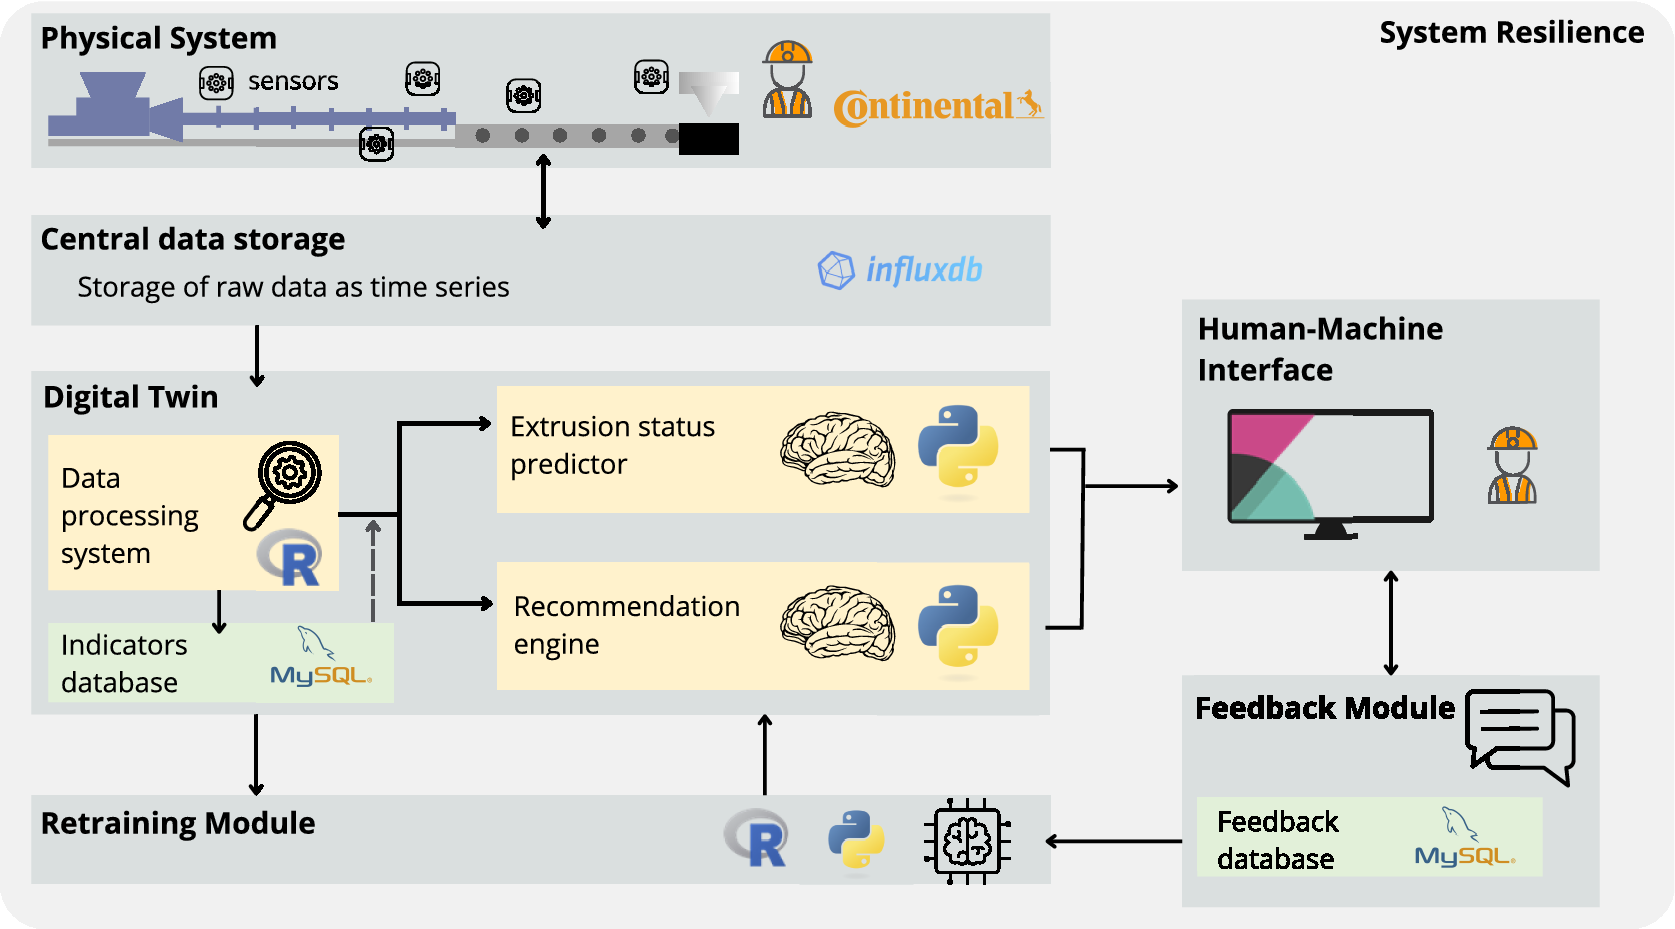
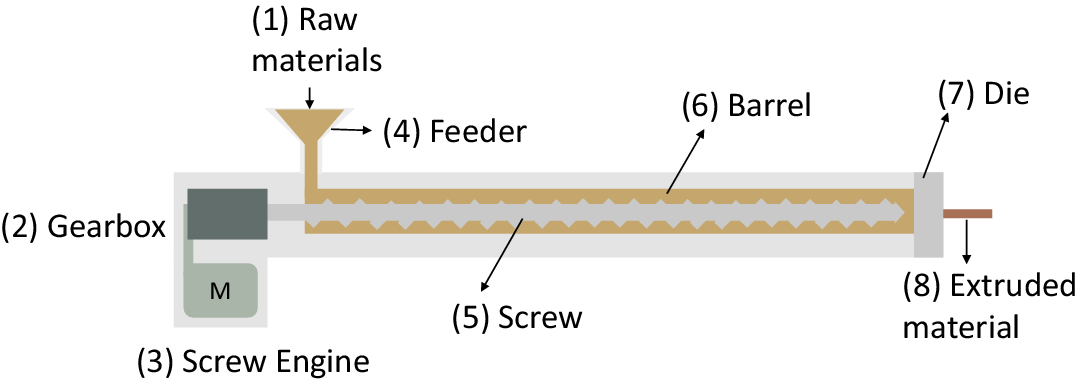
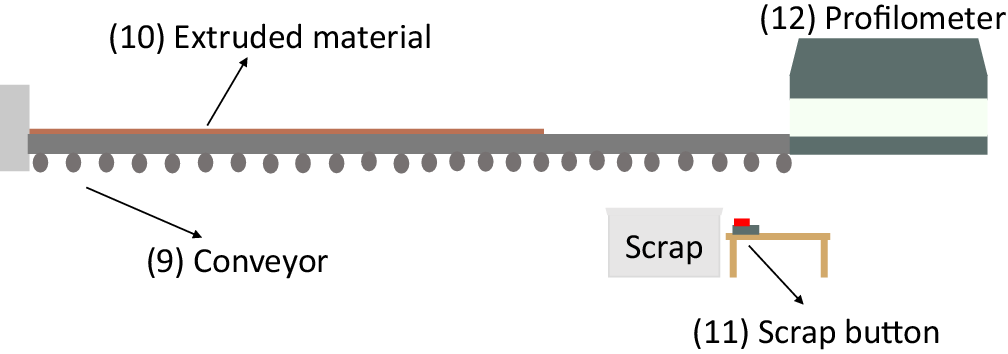
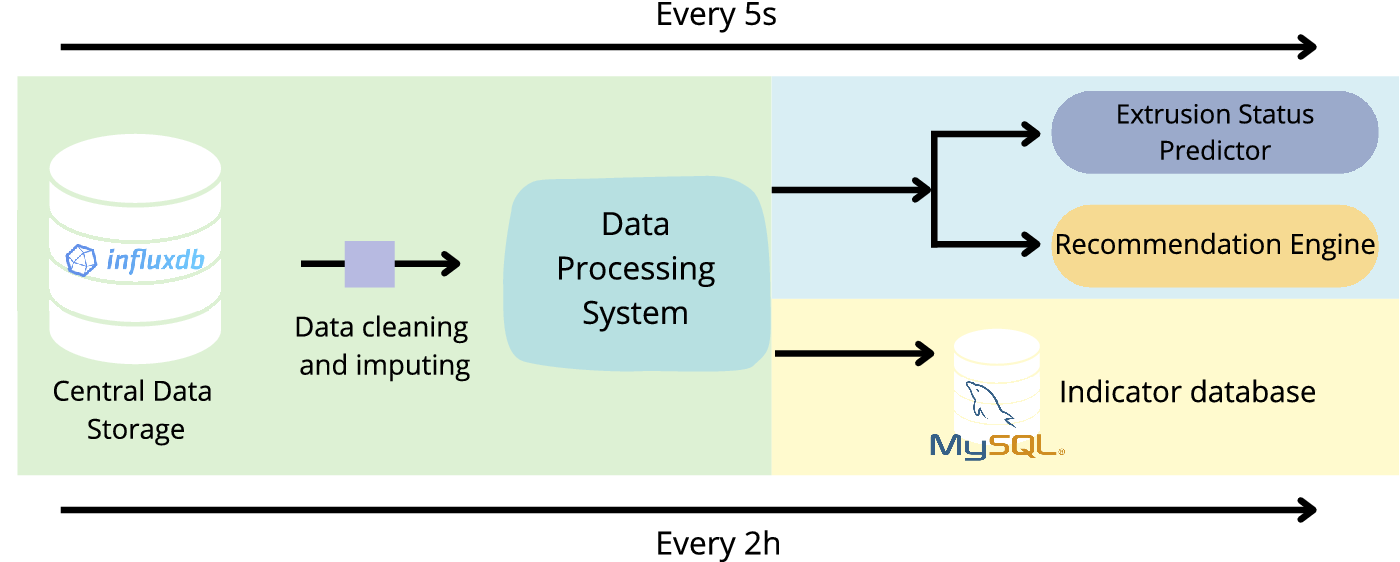
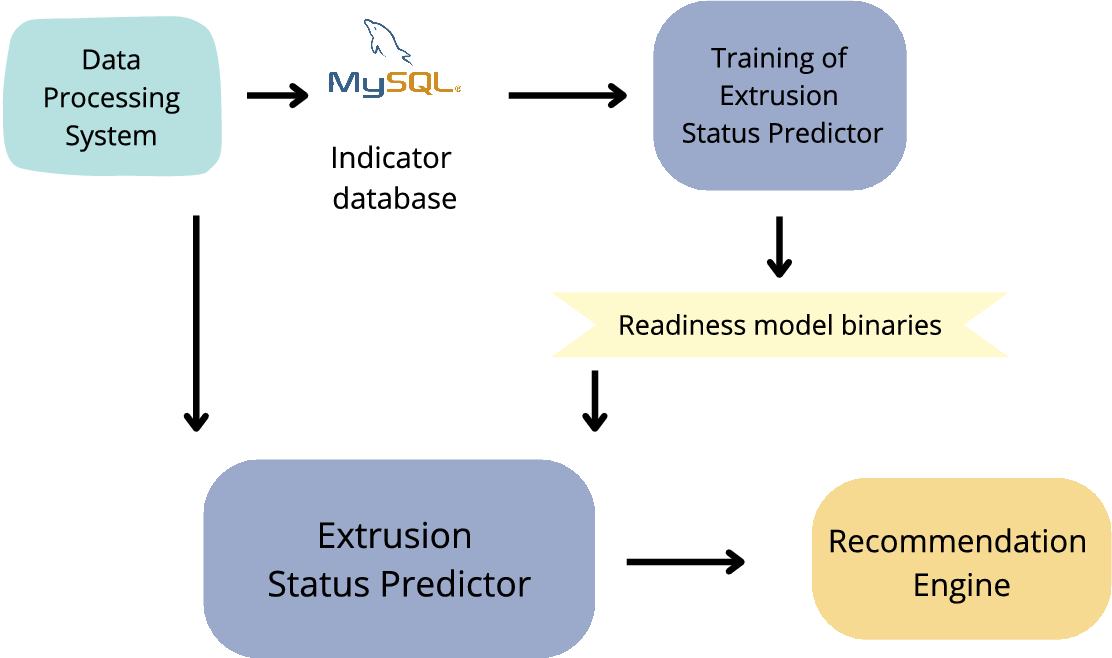
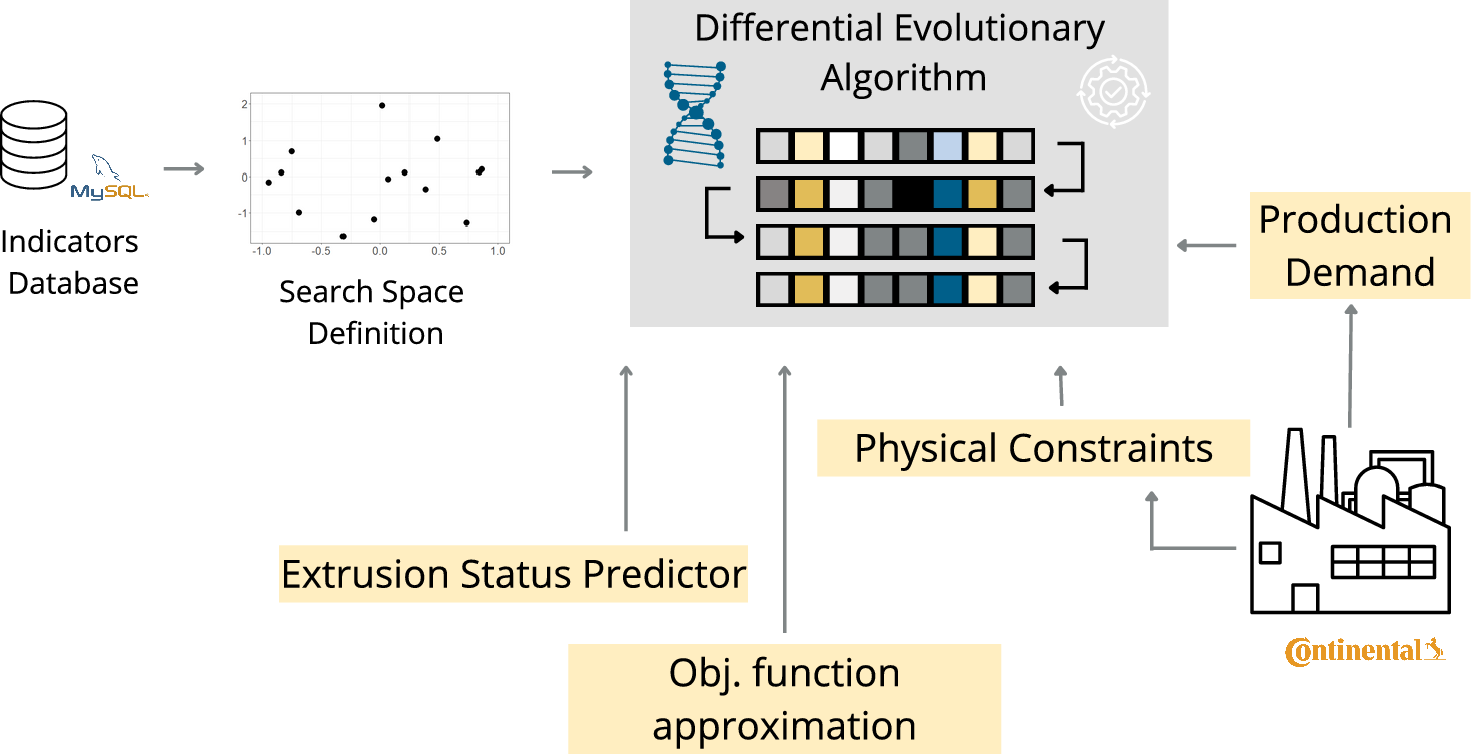
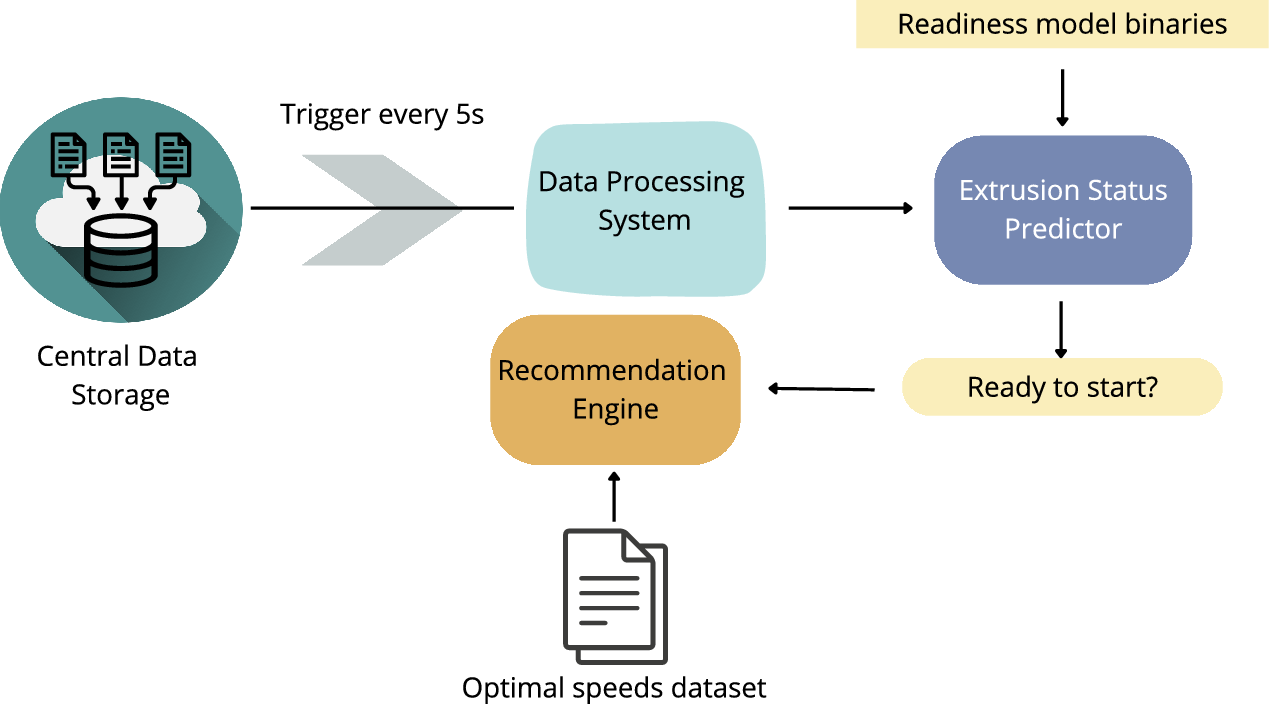
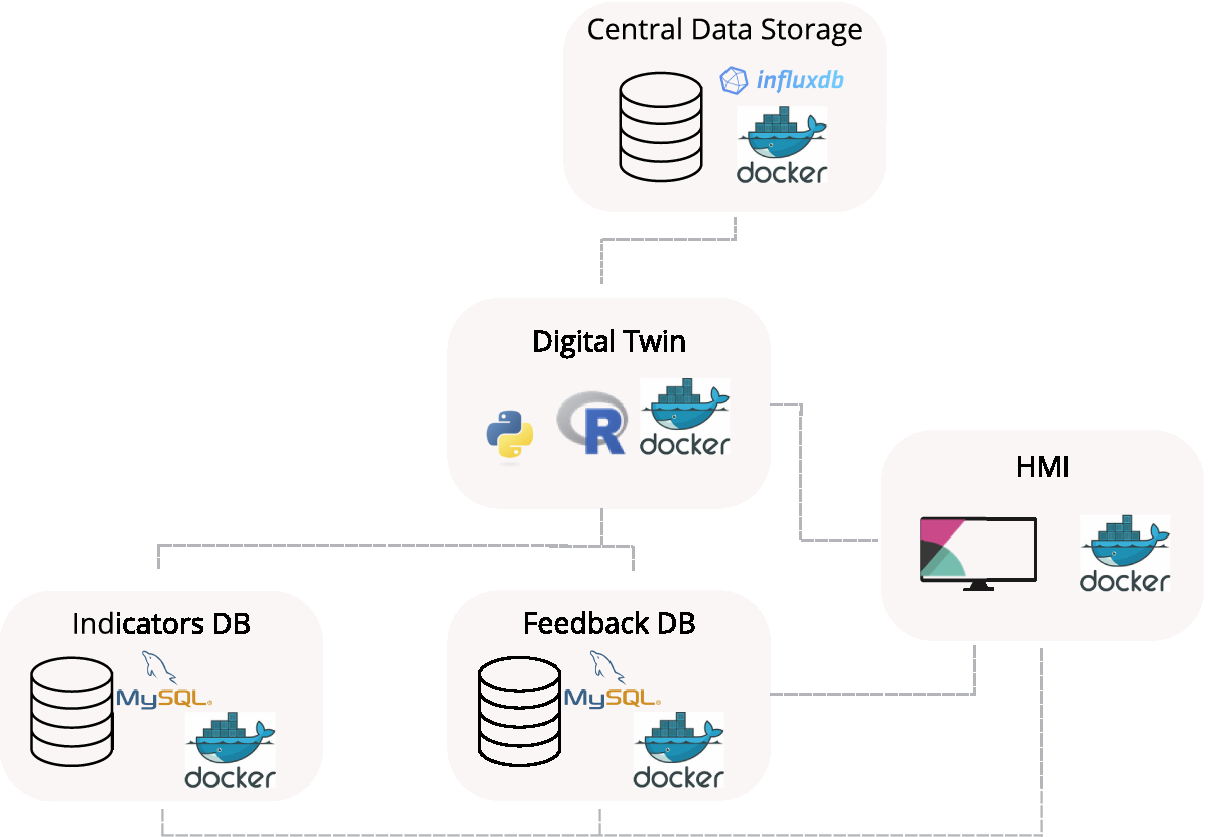
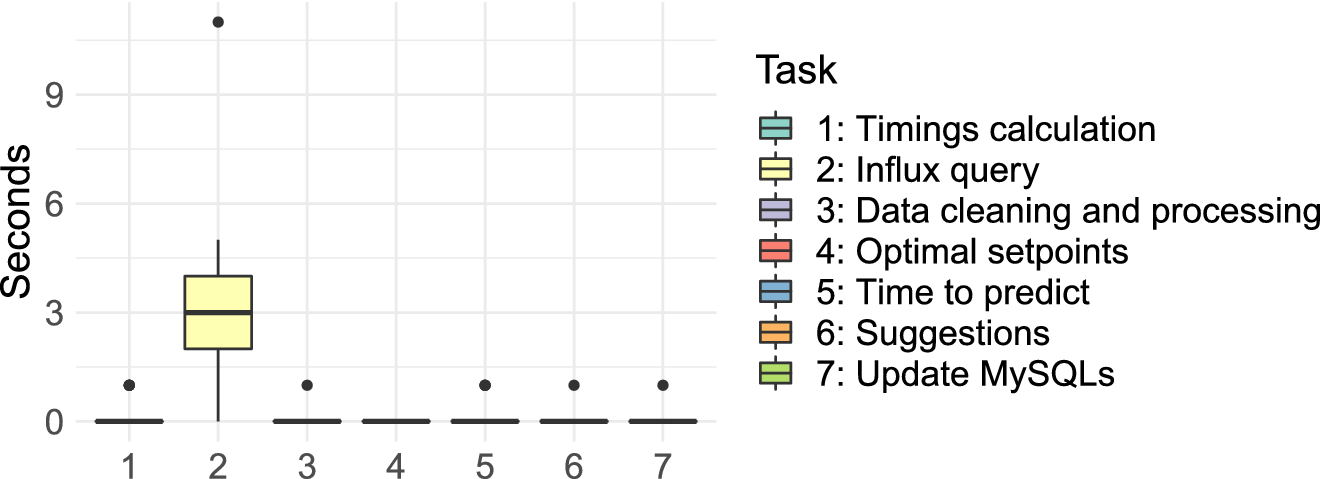
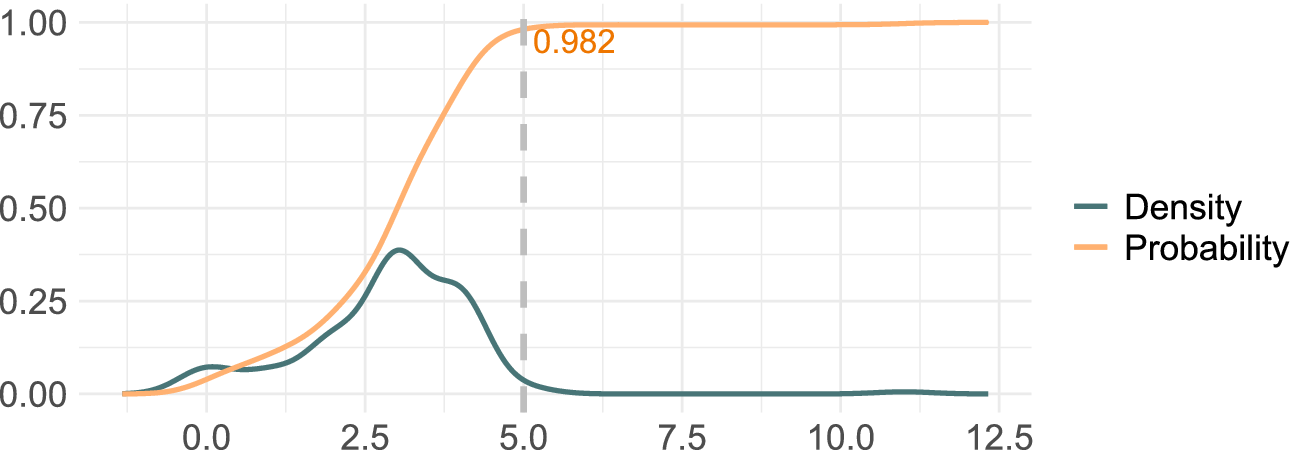
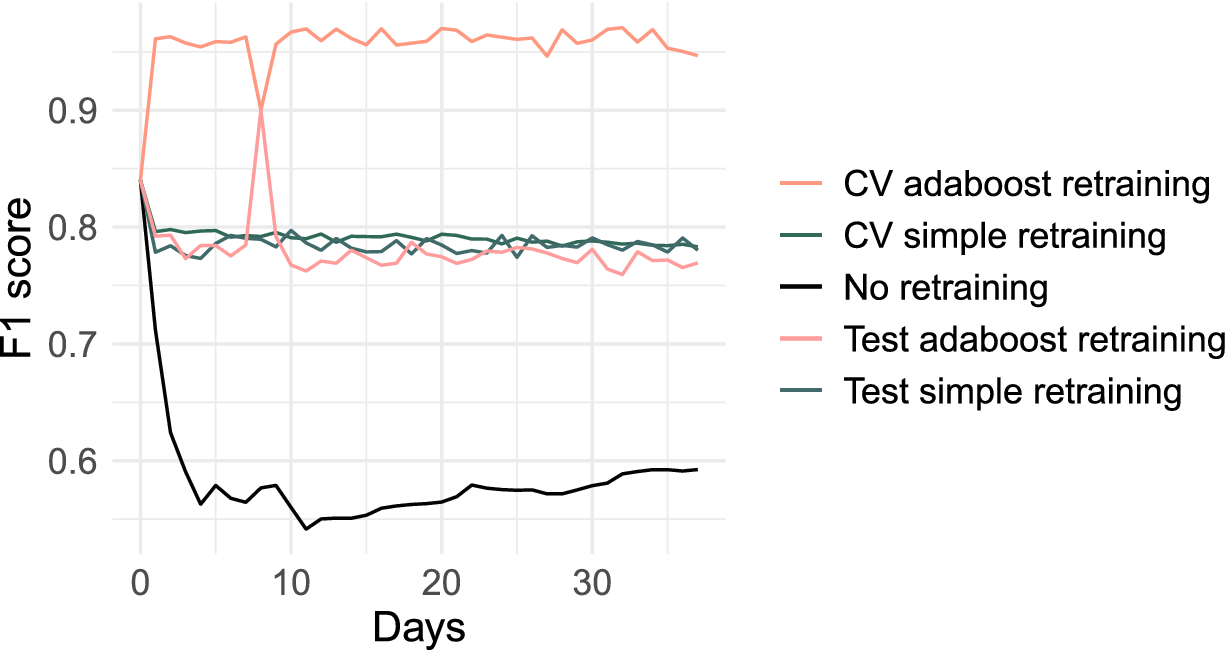
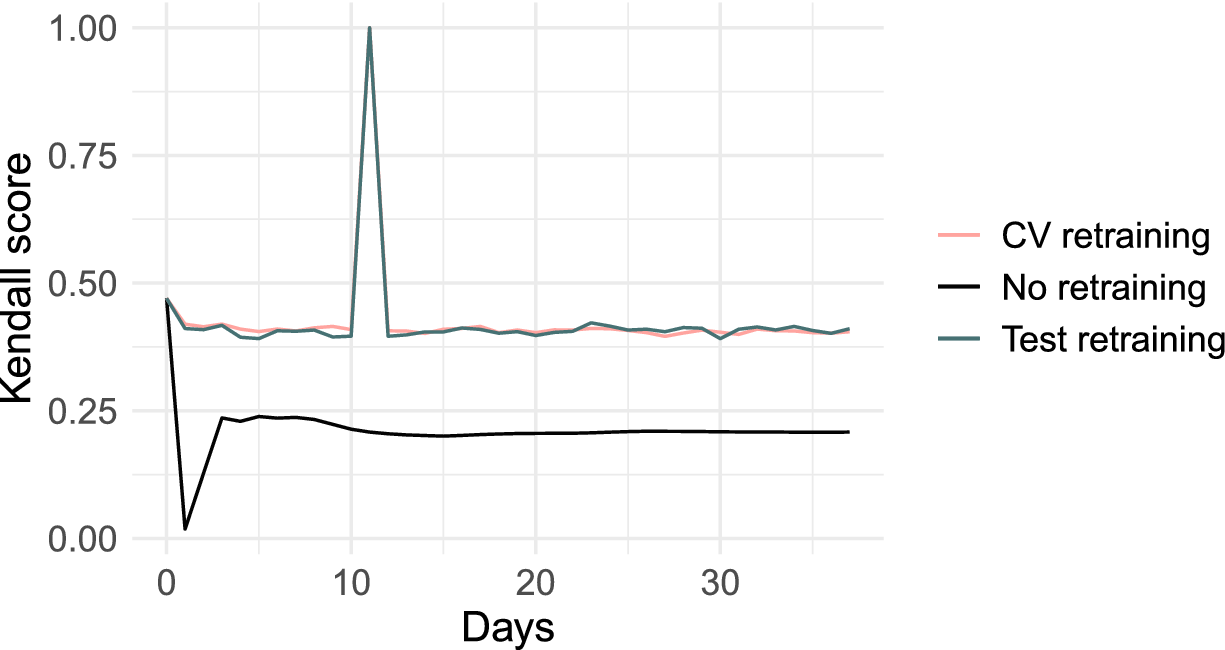
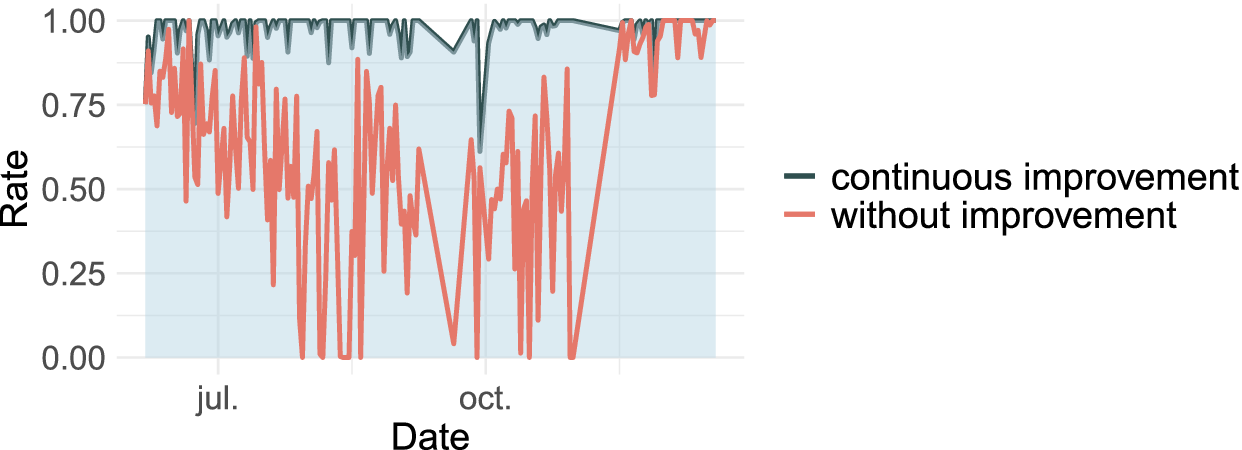
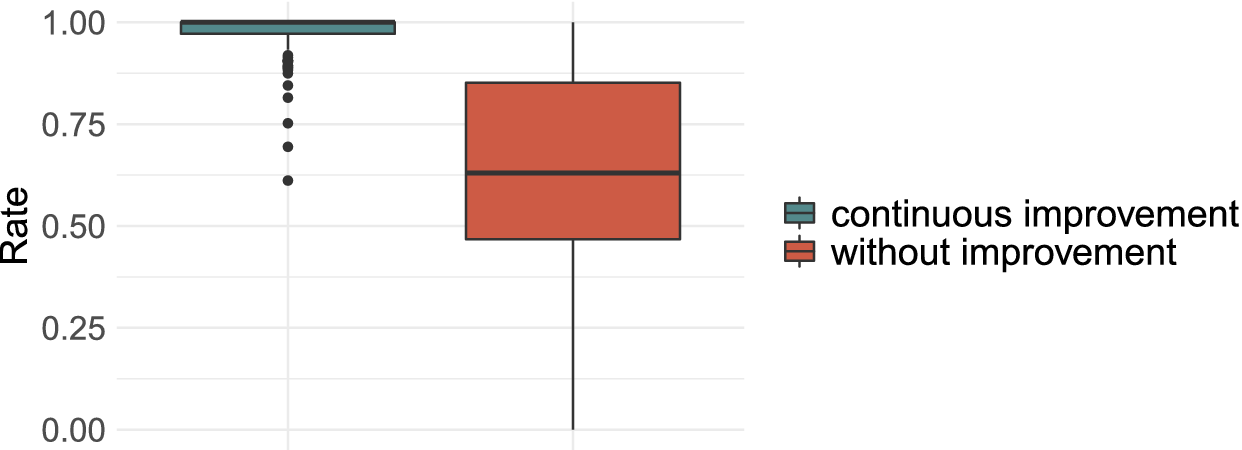
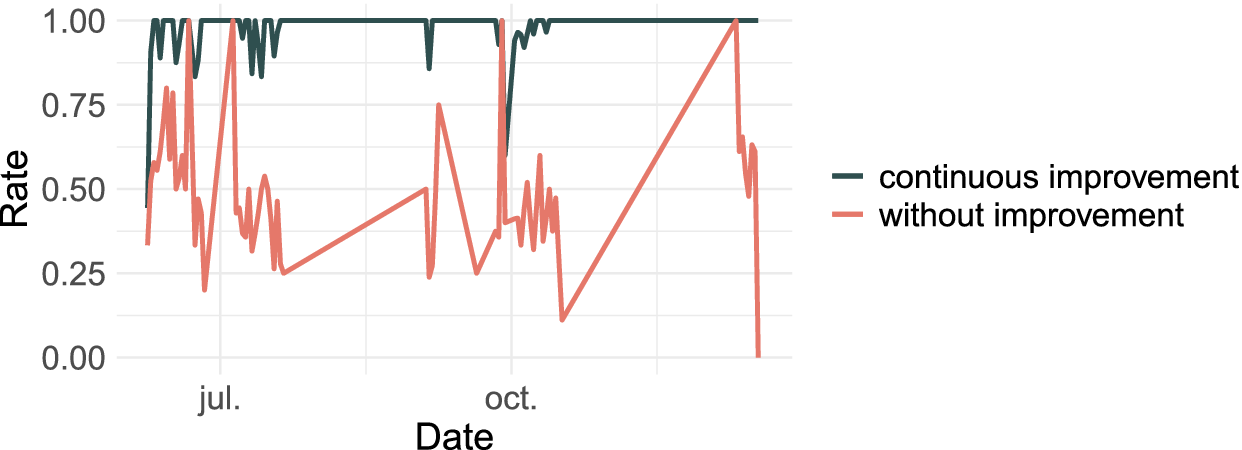
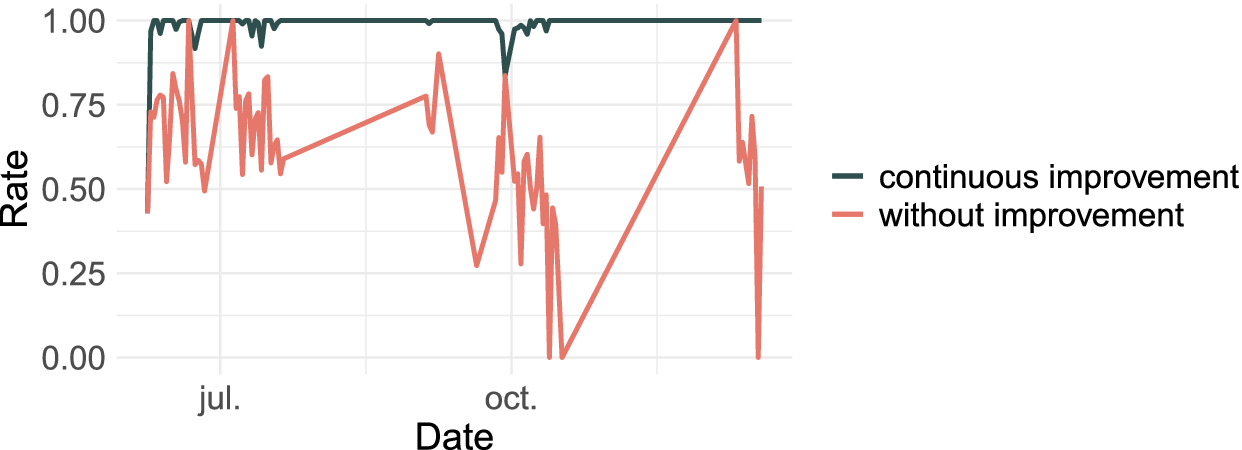

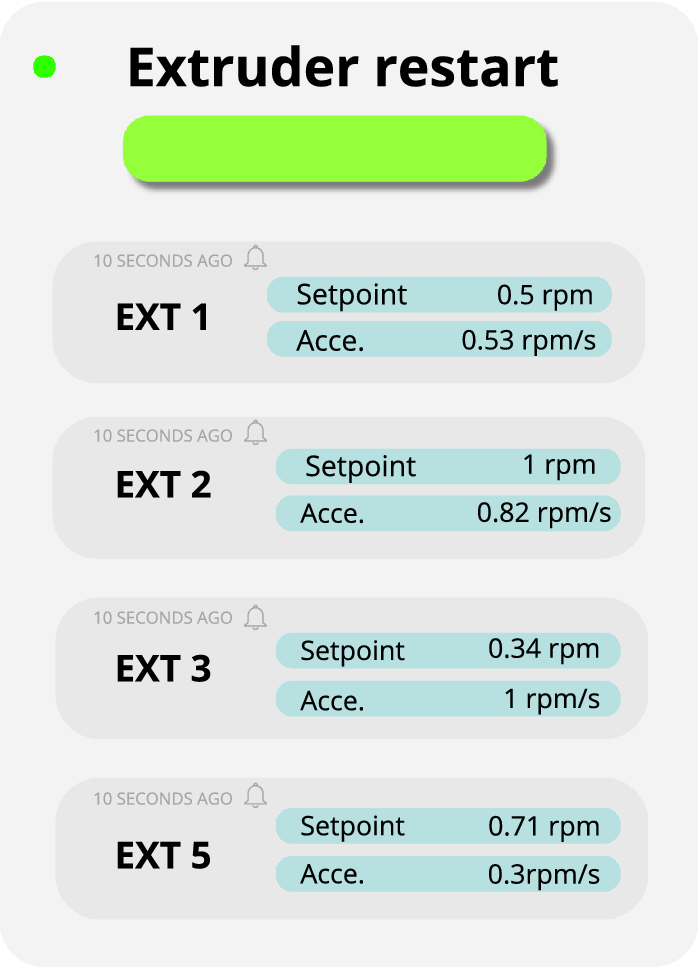


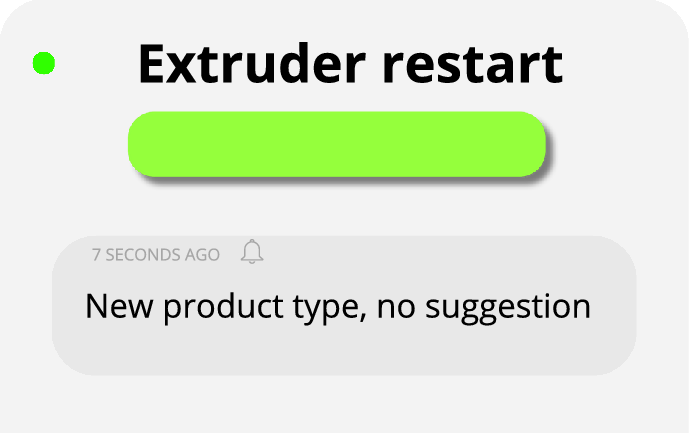

 Open access


Comments
No Comments have been published for this article.