


INTRODUCTION
Species of the Leishmania genus (Kinetoplastida, Trypanosomatidae) are transmitted by nematoceran Diptera of the Phlebotomidae family, of the Phlebotomus genus in the Old World and the Lutzomyia genus in the New World, with a certain specificity existing between the species of Leishmania and the subgenus of sandflies which transmit it (Ready, Reference Ready2011). Recently, the possible involvement of the Sergentomyia genus has been suggested in the transmission of Leishmania infantum in Senegal and L. major in Mali (Senghor et al. Reference Senghor, Faye, Diarra, Elguero, Gay, Bañuls and Niang2011; Berdjane-Brouk et al. Reference Berdjane-Brouk, Koné, Djimdé, Charrel, Ravel, Delaunay, del Giudice, Diarra, Doumbo, Goita, Thera, Depaquit, Marty, Doumbo and Izri2012). Phlebotomus sergenti Parrot, 1917 is the main vector of anthroponotic cutaneous leishmaniasis (ACL) caused by Leishmania tropica Wright, 1903, based on its distribution and on the fact that L. tropica has been identified in infected sandflies recovered from endemic foci (Al-Zahrani et al. Reference Al-Zahrani, Peters, Evans, Ching-Chin, Smith and Lane1988; Guilvard et al. Reference Guilvard, Rioux, Gállego, Pratlong, Mahjour, Martinez-Ortega, Dereure, Saddiki and Martini1991; Schnur et al. Reference Schnur, Nasereddin, Eisenberger, Jaffe, El Fari, Azmi, Anders, Killick-Kendrick, Killick-Kendrick, Dedet, Pratlong, Kanaan, Grossman, Jacobson, Schonian and Warburg2004). Kamhawi et al. (Reference Kamhawi, Modi, Pimenta, Rowton and Sacks2000) confirm that P. sergenti supports the full development of L. tropica, and reveal that the vector is refractory to other Old World Leishmania species. Recent ACL outbreaks caused by L. tropica were reported across a wide area from North Africa to the Middle East, including Turkey and Central Asia (Schnur et al. Reference Schnur, Nasereddin, Eisenberger, Jaffe, El Fari, Azmi, Anders, Killick-Kendrick, Killick-Kendrick, Dedet, Pratlong, Kanaan, Grossman, Jacobson, Schonian and Warburg2004; Svobodova et al. Reference Svobodova, Votypka, Peckova, Dvorak, Nasereddin, Baneth, Sztern, Kravchenko, Orr, Meir, Schnur, Volf and Warburg2006; Kimutai et al. Reference Kimutai, Kamau Ngure, Kiprotich Tonui, Muita Gicheru and Bonareri Nyamwamu2009). In Morocco, this disease is endemic in semi-arid areas in the centre and south of the country and is emerging with epidemic foci in the north. Currently L. tropica is thought to be the species with the widest geographical distribution in Morocco (Guessous-Idrissi et al. Reference Guessous-Idrissi, Chiheb, Hamdani, Riyad, Bichichi, Hamdani and Krimech1997). Here this species, despite being considered responsible for ACL and thus having no need for an animal reservoir in its life cycle, has also been isolated in dogs (Dereure et al. Reference Dereure, Rioux, Gállego, Perières, Pratlong, Mahjour and Saddiki1991).
Phlebotomus sergenti has a wider geographical distribution than the parasite which it transmits, L. tropica (Depaquit et al. Reference Depaquit, Ferté, Léger, Lefranc, Alves-Pires, Hanafi, Maroli, Morillas-Márquez, Rioux, Svobodova and Volf2002). In south-western Europe, it is commonly found in the centre and south of the Iberian Peninsula, whilst in the north it has only been cited in Catalonia, Zaragoza and La Rioja (Gállego Berenguer et al. 1992; Depaquit et al. Reference Depaquit, Ferté, Léger, Lefranc, Alves-Pires, Hanafi, Maroli, Morillas-Márquez, Rioux, Svobodova and Volf2002; Aransay et al. Reference Aransay, Testa, Morillas-Márquez, Lucientes and Ready2004). It has also been captured in the south of France (Rioux et al. Reference Rioux, Jarry, Maazoun and Wallbanks1982), as well as on the islands of Corsica (Rioux et al. Reference Rioux, Houin, Baudouy, Croset and Tour1970) and Sicily (D'Urso et al. Reference D'Urso, Ruta, Khoury, Bianchi, Depaquit and Maroli2004).
In south-western Europe, L. infantum is the only species responsible for leishmaniasis – both cutaneous and visceral – in humans, dogs and other hosts (Martín-Sánchez et al. Reference Martín-Sánchez, Gramiccia, Di Muccio, Ludovisi and Morillas-Márquez2004; Pratlong et al. Reference Pratlong, Rioux, Marty, Faraut-Gambarelli, Dereure, Lanotte and Dedet2004; Campino et al. Reference Campino, Pratlong, Abranches, Rioux, Santos-Gomes, Alves-Pires, Cortes, Ramada, Cristovao, Afonso and Dedet2006). Its proven vectors in this region are species of the subgenus Larroussius, Phlebotomus perniciosus and Phlebotomus ariasi, which can act in one same focus in sympatric conditions (Guilvard et al. Reference Guilvard, Gállego, Moreno, Fisa, Rispail, Pratlong, Martinez-Ortega, Gallego and Rioux1996). Although in south-western Europe no autochthonous cases of cutaneous leishmaniasis caused by L. tropica have been detected, the south of the Iberian Peninsula is an area which is susceptible to the introduction of this protozoa due to its proximity to northern Morocco (an emerging ACL area), the migratory flow of people between the two territories and the presence of its main vector. This could constitute the first step in its potential spread across other susceptible areas of south-western Europe. Gramiccia and Gradoni (Reference Gramiccia and Gradoni2005) describe a similar scenario for southern Italy (Sicily) and suggest the importation of infected dogs from North Africa as another possible entry route for the parasite into Italy.
Geographical Information Systems (GIS) allow us to collect, store, manage, visualize and analyse geographically referenced data for the purposes of supporting the decision-making process when addressing problems occurring in a given geographical space, for which reason they have come to be considered an excellent tool for use in the epidemiology of vector-borne diseases (Srivastava et al. Reference Srivastava, Nagpal, Joshi, Paliwal and Dash2009). These studies highlight the importance of climatic and environmental factors in the distribution of different vectors and of the diseases they transmit. The use of GIS makes it possible to integrate epidemiological and environmental data and allows us to generate predictive maps, which are a more expressive and visual medium for identifying the risk factors associated with the disease and thus also the possible consequent control measures to be taken (Semenza and Menne, Reference Semenza and Menne2009).
By this method, we aimed to determine the environmental factors associated with the distribution of P. sergenti, with a view to constructing risk maps for exposure to the vector which could help to identify the hot spots for the potential establishment of L. tropica in the southwest of Europe.
MATERIALS AND METHODS
Study areas
Three different sampling areas located in the southeast, centre and northeast of the Iberian Peninsula were selected. The orographic and climatic characteristics of these areas allow diverse bioclimatic levels to exist, each with different environmental and vegetation features: Thermo-mediterranean, Meso-mediterranean, Supra-mediterranean, Oro-mediterranean and Crio-mediterranean (Rivas Martínez et al. Reference Rivas Martínez, Bandullo, Serrada, Allue Andrade, Moreno del Burgo and González Rebollar1987). Several of these bioclimatic levels are present in all areas under study. The data obtained in the southeast of the Iberian Peninsula were used in the construction of the risk model, while data from the central (Gálvez et al. Reference Gálvez, Descalzo, Miró, Jiménez, Martín, Dos Santos-Brandao, Guerrero and Molina2010) and north-eastern areas were used for the validation of the model produced. The southeast of the Peninsula was chosen to generate the risk model based on its greater bioclimatic resemblance to northern Morocco (Martínez-Ortega, Reference Martínez-Ortega1988), an emerging ACL area, as well as on the greater richness of P. sergenti in this area of the Iberian Peninsula (Guevara-Benítez et al. Reference Guevara-Benítez, Úbeda-Ontiveros and Morillas-Márquez1978; Morillas-Márquez et al. Reference Morillas-Márquez, Guevara Benítez, Úbeda Ontiveros and González Castro1983).
Capture and morphological identification of sandflies
This study was carried out in the years 2004, 2006 and 2007. The capture method chosen was sticky traps (paper impregnated with castor oil). The traps were placed in the drainage holes of retaining walls for roads and houses (spots where sandflies tend to rest), and were kept there for 4 days. Early July was chosen as the capture date due to criteria regarding maximum species richness (Morillas-Márquez et al. Reference Morillas-Márquez, Guevara Benítez, Úbeda Ontiveros and González Castro1983) and because it is within the high density period in the phenology of P. sergenti (Martínez-Ortega, Reference Martínez-Ortega1986). Six hundred and sixty-two sampling sites were investigated, of which 167 were in the southeast, 155 in the centre and 340 in the northeast of the Iberian Peninsula (Fig. 1).
Location of sampling sites. (a) Sampling sites in the southeast which were used to construct the statistical model; (b) Sampling sites in the centre; (c) Sampling sites in the northeast; b and c were used for the validation of the statistical model.

The specimens captured were cleared in Marc André solution and then mounted under a cover slip in Berlese's medium. Species classification was conducted via inspection of their main morphological characteristics under an optical microscope (Gállego Berenguer et al. Reference Gállego-Berenguer, Botet-Fregola, Gállego-Culleré, Portús-Vinyeta and Hernández1992).
Variables studied
The ecological and climatic characteristics of each of the 662 sampling sites were collected by two different methods: environmental data obtained via GIS, and notes taken in situ using a PDA (Personal Digital Assistant). All these characteristics were used as independent variables set against the presence/absence of P. sergenti as the dependent variable. Multivariate logistic regression was the statistical technique of choice to estimate the probability of occurrence of the event, since the dependent variable can only have a value of 0 (absence) or 1 (presence).
Environmental data obtained via GIS were: altitude (Digital Terrain Model), land use (CORINE), slope, aspect, ‘Normalized Difference Vegetation Index’ (NDVI) and annual average land surface temperature (aaLST). Data collected via PDA were: Location of sampling site (geographical coordinates), number of traps laid and collected, meteorological data (rain, wind), ecological and environmental factors (site relative to settlement, situation of site, site category, aspect, shelter, water course, retaining wall construction, drainage hole construction, hole interior, wetness of holes, vegetation in wall, well present, refuse bin present), bioclimatic level, predominant natural vegetation adjacent zone 0–100 m, predominant natural vegetation nearby zone 100–1000 m, second predominant natural vegetation nearby zone 100–1000 m; predominant adjacent land cover, second predominant adjacent land cover; presence of different animals in the immediate vicinity. In order to collect these variables with a PDA, a database was used designed by the leishmaniasis group EDEN-LEI from the EDEN project (Emerging diseases in a changing European environment, GOCE-2003-010284), thus standardizing the collection of field data.
Spatial statistical analyses and maps
Using data from the southeast of the Iberian Peninsula, univariate logistic regression studies were conducted using the SPSS 15.0 software for Windows, with all the independent variables set against the presence/absence of P. sergenti as the dependent variable. In the search for association with the dependent variable, the continuous variables were categorized and the categorical ones were recategorized. Different univariate logistic regression models were constructed and compared in order to detect cases of collinearity, interaction and confusion between the independent variables. For cases in which there was a strong correlation between variables, the one with the greatest significance or the one which was easiest to represent on a map was retained. All variables returning a value of P⩽0·2 in the univariate study were used to construct the multivariate model.
In the final multivariate model variables with P⩽0·1 were retained. Based on this statistical model, risk maps for exposure to P. sergenti were generated using the program ArcGis 9.2. In this way we were able to extrapolate specific data into wider geographical areas, which in this case constitute the south-western area of Europe, encompassing Spain, Portugal and the south of France.
Validation of the statistical model
Validation of the above predictive risk model was carried out using the capture data from the centre and northeast of the Iberian Peninsula. Through logistic regression using SPSS 15.0 for Windows, the P. sergenti presence/absence data obtained in the 495 sampling sites in the centre and northeast of Iberian Peninsula (dependent variable) were compared with the ‘theoretical risk’ values taken from those same points on the map which was generated (independent variable). Parallel to this, the Spearman Test (SPSS 15.0 for Windows) was used in order to determine whether or not there was correlation between the ‘real risk’ of P. sergenti presence, expressed in terms of the percentage of positive sites, and the ‘theoretical risk’ obtained from the risk model produced.
RESULTS
Capture data and species identification
In the southeast of the Iberian Peninsula, 30 019 sandflies were collected from the 1633 traps recovered (loss of 3·6%), with a resulting total capture density of 147·06 sandflies/m2 of sticky trap (st). Six different species were identified belonging to two genera: Sergentomyia (Sergentomyia minuta) and Phlebotomus (P. perniciosus, P. ariasi, P. papatasi, P. sergenti and P. alexandri). Two hundred and seventy-six specimens (227♂+49♀) were classified morphologically as P. sergenti. The total density of P. sergenti was 1·35 sandflies/m2 st and it was present in 24·6% of the sites sampled (41/167). At the Thermo-mediterranean and Meso-mediterranean levels similar density and abundance values for P. sergenti were recorded, whilst in the Supra-mediterranean both values are considerably lower. In the Oro-mediterranean no vector species were captured, since the 10 specimens found were identified as S. minuta (Table 1).
Number of specimens captured, abundance and density of P. sergenti in the southeast of the Iberian Peninsula, the area on which we focused for the construction of the statistical model

Ps: Phlebotomus sergenti; other sp.: other sandfly species captured, including Sergentomyia minuta; Dens. Ps: Density of Phlebotomus sergenti (no. Phlebotomus sergenti/m2).
In the centre of the Iberian Peninsula, 85 specimens of P. sergenti were captured, with a total density of 0·66 sandflies/m2 st and a presence in 12·9% of the sites sampled (20/155), whilst in the northeast, 65 P. sergenti specimens were found, registering a total density of 0·20 sandflies/m2 st and a presence in 4·7% of the sites (16/340). Phlebotomus sergenti was captured at altitudes ranging from 76 to 1353 m above sea level.
Statistical study and construction of predictive model
Once the univariate logistic regression models had been constructed and analysed, we were able to confirm that 12 of the independent variables display association with the presence/absence of P. sergenti (dependent variable) with a P⩽0·2: ‘bioclimatic level’, ‘elevation’, ‘land use’ (CORINE), ‘aaLST’, ‘aspect’, ‘equines’, ‘pets’, ‘domestic birds’, ‘all animals’, ‘drainage hole construction’, ‘land cover’ and ‘vegetation in wall’.
Finally, the variables which make up the multivariate logistic regression model and that are shown to be the best predictors for the presence/absence of P. sergenti are ‘altitude’ (a. 0–1153 m, b. 1154–2091 m), ‘land use’ (a. other uses, b. rivers and natural water courses), ‘aaLST’ (a. other temperatures, b. 23·3–26·8 °C), ‘aspect’ (a. 160–359°, b. 1–159°), ‘adjacent land cover’ (a. other uses, b. almond and citrus trees), ‘presence/absence of vegetation in wall’ and ‘presence/absence of PVC pipes in the drainage holes of retaining walls’. The variables ‘adjacent land cover’, ‘vegetation in wall’ and ‘PVC pipes’ are collected via PDA and represent characteristics pertaining to the trapping sites for which GIS layers are not available, thus in order to be represented they had to be included in the constant of the statistical model (Table 2a). Using only the variables obtained via GIS (‘altitude’, ‘aspect’, ‘aaLST’ and ‘land use’) a new statistical model was developed (Table 2b), since only these can be represented on a map.
Variables associated with Phlebotomus sergenti presence: (a) From multivariate model obtained via logistic regression including PDA and GIS variables which show association with the dependent variable (presence/absence of P. sergenti); this model was used to generate the risk maps in Fig. 3b and c (Nagelkerke R-square: 0·368); (b) From multivariate model in which PDA variables were excluded due to not being representable in graphic terms on a map; this model was used to generate the risk map in Fig. 2 (Nagelkerke R-square: 0·227)

With this second statistical model a first risk map was generated, returning risk values of P. sergenti presence ranging from 1·3 to 78·0% (Fig. 2). Subsequently, the possibility of including the 3 PDA variables in the constant of the mathematical model set out in Table 2a permitted the generation of 8 different risk models (Fig. 3a) and their corresponding risk maps. Thus we find that, with all other variables being equal, the probability of encountering P. sergenti in Spain varies from 0·04 to 25·1% in the most restrictive risk map (Fig. 3c) (all retaining walls without almond or citrus trees nearby, with vegetation in wall and with PVC in drainage holes), while in the highest risk model (all retaining walls with almond or citrus trees nearby, without vegetation and without PVC) it varies from 3·3 to 96·3% (Fig. 3b), which constitutes a considerably increased risk of encountering this sandfly. The remaining possibilities and the variations in risk produced are presented in Fig. 3a.
Risk map of statistical model without PDA variables (set out in Table 2b). Risk values: 1·3–78·0%.

Statistical model with PDA variables: (a) Modification of risk values according to the PDA variables (not representable on the map) – all possible combinations for the three categorical PDA variables are shown; (b) Risk map of model 3 in the table; (c) Risk map of model 8 in the table.

Validation of the statistical model
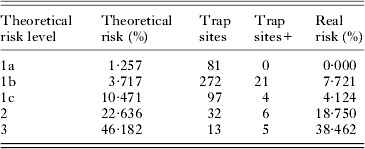
The risk model produced with data from the southeast of the Iberian Peninsula which does not include variables collected by PDA (Fig. 2) indicates that the probability of capturing P. sergenti in the centre and northeast of the Iberian Peninsula can be divided into five different risk levels (Table 3), which allows us to determine what we refer to as the ‘theoretical risk’. Reducing this to three risk levels – 1 (1a, 1b, 1c) (<11%), 2 (22·6%) and 3 (46·2%) (Table 3) – allowed us to confirm that finding P. sergenti in areas with ‘theoretical risk’ level 2 was 4·08 times more likely than in those with risk levels below 11% (level 1) (P = 0·005), while in level 3 areas the risk of P. sergenti being present is 10·63 times greater (P<0·001) than in level 1 areas. Correlation between the ‘theoretical risk’ and the ‘real risk’, the latter determined on the basis of capture data, is 90% (P = 0·037).
Validation of the risk model without PDA variables: levels and values of theoretical risk (taken from map in Fig. 2) and real risk (percentage of positive sites relative to total number of sites at each level) in the five risk levels obtained in trapping sites in the centre and northeast of the Iberian Peninsula
DISCUSSION
Although to date no cases of anthroponotic cutaneous leishmaniasis (ACL) caused by L. tropica have been diagnosed in south-western Europe, the presence of its main vector, P. sergenti, has been widely demonstrated (Morillas-Márquez et al. Reference Morillas-Márquez, Guevara Benítez, Úbeda Ontiveros and González Castro1983; Gállego Berenguer et al. Reference Gállego-Berenguer, Botet-Fregola, Gállego-Culleré, Portús-Vinyeta and Hernández1992; Semião-Santos et al. Reference Semião-Santos, el Harith, Ferreira, Pires, Sousa and Gusmão1995; Depaquit et al. Reference Depaquit, Ferté, Léger, Lefranc, Alves-Pires, Hanafi, Maroli, Morillas-Márquez, Rioux, Svobodova and Volf2002; Aransay et al. Reference Aransay, Testa, Morillas-Márquez, Lucientes and Ready2004). In the southeast of the Iberian Peninsula this species has an average density of 1·35 sandflies/m2 st and was found in 24·6% of the sampling sites. The total abundance of P. sergenti was 0·9%, although this figure is an underestimate due to the choice of capture method, sticky traps, in which there is a considerable increase in S. minuta captures (Gállego Berenguer et al. Reference Gállego-Berenguer, Botet-Fregola, Gállego-Culleré, Portús-Vinyeta and Hernández1992). If we take into account only specimens belonging to the Phlebotomus genus, the abundance rises to 9·1%. It was noted that in certain sites these low density and/or abundance values rise significantly, reaching figures of 35·27 P. sergenti/m2 st and representing up to 75% of total captures. In emerging Moroccan foci of L. tropica, the density of P. sergenti varies from 4 to 16 specimens/m2 st (Ramaoui et al. Reference Ramaoui, Guernaoui and Boumezzough2008), and Rioux et al. (Reference Rioux, Lanotte, Petter, Dereure, Akalay, Pratlong, Velez, Fikri, Maazoun and Denial1986) reported a density of 1·79 P. sergenti/m2 st in typical foci of ACL caused by L. tropica located in arid areas of Tunisia. Furthermore, in previous studies it was mentioned that P. perniciosus density values of ⩾4 sandflies/m2 st increase the risk of L. infantum transmission in dogs (Martín-Sánchez et al. Reference Martín-Sánchez, Morales-Yuste, Acedo-Sanchez, Barón, Díaz and Morillas-Márquez2009), and that in areas where P. ariasi density is ⩾5 sandflies/m2 st cases of canine leishmaniasis appear (Rioux et al. Reference Rioux, Croset and Lanotte1977). In spite of the fact that the dynamics of transmission can be very different, as an approximation we can assume that the above data related to L. infantum can be extrapolated to the pair P. sergenti/L. tropica. This would mean that in the Iberian Peninsula there are areas in which P. sergenti density is sufficient for these sandflies to be able to act as vectors. Moreover, some studies highlight the bioclimatic affinity between northern Morocco and the southeast of the Iberian Peninsula, along with the high concordance of sandfly species found at each bioclimatic level (Martínez Ortega, Reference Martínez-Ortega1988). This similarity between the north of Morocco (an emerging ACL zone) and the southeast of the Peninsula, and the P. sergenti density values detected, indicate that this area of south-western Europe may be susceptible to the introduction of L. tropica, in a similar way to what has occurred in northern Morocco (Guessous-Idrissi et al. Reference Guessous-Idrissi, Chiheb, Hamdani, Riyad, Bichichi, Hamdani and Krimech1997).
The higher number of specimens captured, total density and proportion of positive sites for P. sergenti confirm that the choice of the south-eastern area of the Iberian Peninsula was appropriate for generating the statistical model. From among the variables associated with P. sergenti presence, temperature has already been singled out in other studies as an important factor in sandfly distribution (Aspöck et al. Reference Aspöck, Gerersdorfer, Formayer and Walochnik2008). Although this variable is usually correlated with altitude because of the direct relationship between altitude increase and temperature drop (Rivas Martínez et al. Reference Rivas Martínez, Bandullo, Serrada, Allue Andrade, Moreno del Burgo and González Rebollar1987), in this study we were able to confirm that both variables maintain their significance in the multivariate model, having observed that the risk of exposure to P. sergenti is higher at altitudes ranging from sea level to 1153 m (3·5 times higher) and at temperatures from 23·3 to 26·8 °C (7·9 times higher). These altitude and temperature data correspond to the altitude at which this species is usually found in this region (0–1100 m) (Guevara-Benítez et al. Reference Guevara-Benítez, Úbeda-Ontiveros and Morillas-Márquez1978), and to the temperature values of the semi-arid or sub-humid environments which it tends to inhabit (Martínez-Ortega and Conesa-Gallego, Reference Martínez-Ortega and Conesa-Gallego1987). Altitude and/or land use have been mentioned in previous studies as important factors in P. perniciosus distribution (Gálvez et al. Reference Gálvez, Descalzo, Miró, Jiménez, Martín, Dos Santos-Brandao, Guerrero and Molina2010; Barón et al. Reference Barón, Morillas-Márquez, Morales-Yuste, Díaz-Sáez, Irigaray and Martín-Sánchez2011), so the significance of these two variables in the distribution of the vector sandfly species is clear. In the specific case of P. sergenti, the presence of rivers and natural water courses increases the risk of encountering this species by 8·7 times compared with other uses, no doubt due to the particular damp conditions commonly found in these environments. It has been noted that in certain regions the larvae of this dipteran flourish in water-rich areas such as irrigation or urban drainage channels (Lewis, Reference Lewis1971).
Furthermore, we found that P. sergenti shows a preference for environments with nearby citrus or almond orchards, in which the earth retaining walls are free from vegetation and have drainage holes with no PVC pipes in them, factors which increase the risk of encountering this vector by 3·1, 4·2 and 5·9 times respectively. Thus vegetation in walls and PVC pipes in wall drainage holes act as protection factors, reducing the presence of this sandfly, and can therefore be used as such in vector control programmes. PVC in drainage holes has been cited previously as a potential protective measure against P. perniciosus in this same region (Barón et al. Reference Barón, Morillas-Márquez, Morales-Yuste, Díaz-Sáez, Irigaray and Martín-Sánchez2011), which demonstrates its effectiveness in the control of vector sandflies.
We can confirm the usefulness of the risk model for detecting high-risk areas for P. sergenti presence, these locations being the most highly prone to the potential establishment of L. tropica. However, the risk model was shown to be less effective in the differentiation of risk levels below 11%, where there is less concordance between theoretical and real values, although the ‘real risk’ obtained always remained below 11%. Semião-Santos et al. (Reference Semião-Santos, el Harith, Ferreira, Pires, Sousa and Gusmão1995) noted that P. sergenti was the predominant sandfly species in the district of Évora. This region in the south of Portugal falls within a high-risk area in our theoretical risk model, thus demonstrating its validity for identifying areas of this type.
The highest risk of P. sergenti presence is concentrated in extensive areas of the centre and south of the Iberian Peninsula, with maximum values of between 78·0 and 96·3%, depending on the risk model applied. These high-risk areas represent hot spots where the establishment of an autochthonous focus of L. tropica would be feasible. We should point out that in order for this focus to occur, several premises would need to take place which are difficult to predict, for example the introduction of the disease via infected persons from endemic areas, or the P. sergenti populations found in the region displaying vectorial capacity. With regard to the introduction of the disease, the flow of immigrants from North Africa and, to a lesser extent, the Middle East is known to exist and the presence of the parasite in these regions has been proven (Al-Zahrani et al. Reference Al-Zahrani, Peters, Evans, Smith and Ching-Chin1989; Kimutai et al. Reference Kimutai, Kamau Ngure, Kiprotich Tonui, Muita Gicheru and Bonareri Nyamwamu2009), therefore contact between the parasite and the vector is feasible. According to the Spanish National Institute of Statistics (INE), in the year 2010 a total of 51 235 immigrants from North Africa and the Middle East entered Spain, of which 43 931 were Moroccan and 1212 from the Middle East. To this number we should add illegal immigrants, who are commonly found in this country and fall outside the control of the health authorities. During the period April 1989 to December 2007, 0·2% of immigrants who visited a Tropical Medicine Referral Unit in Spain had cutaneous or mucocutaneous leishmaniasis (Norman et al. Reference Norman, Pérez de Ayala, Pérez-Molina, Monge-Maillo, Zamarrón and López-Vélez2010). In Spain, the fact that most cutaneous cases remain undeclared has been verified (Alvar et al. Reference Alvar, Vélez, Bern, Herrero, Desjeux, Cano, Jannin and den Boer2012), and identification of the species involved is not commonplace, so the entry and establishment of a new species may be underestimated (Gramiccia and Gradoni, Reference Gramiccia and Gradoni2005). The importation of cases of cutaneous leishmaniasis caused by L. tropica has been verified in other European countries (Grimm et al. Reference Grimm, Gessler and Brun1996; Antinori et al. Reference Antinori, Gianelli, Calattini, Longhi, Gramiccia and Corbellino2005; Gramiccia and Gradoni, Reference Gramiccia and Gradoni2005; Morizot et al. Reference Morizot, Delgiudice, Caumes, Laffitte, Marty, Dupuy, Sarfati, Hadj-Rabia, Darie, Le Guern, Salah, Pratlong, Dedet, Grögl and Buffet2007). With regard to the vector, recent studies have demonstrated the existence of a mitochondrial line of P. sergenti common to both Spain and northern Morocco (Barón et al. Reference Barón, Martín-Sánchez, Gállego, Morales-Yuste, Boussaa and Morillas-Márquez2008), the latter an emerging area for L. tropica, which establishes a potential capacity for populations of this species in Spain to act as vectors.
It has, moreover, been suggested that climate change may affect the distribution of leishmaniasis, whether directly due to the effect of temperature on the development of the parasite within the sandfly, or indirectly due to the effect of environmental changes on the distribution and abundance/density of the vector species (Ready, Reference Ready2010). Besides, the prolongation of the activity period of the vectors could have a greater effect on the transmission of the disease than the increase in density, and this prolongation could be produced by the increase in temperature (Martín-Sánchez et al. Reference Martín-Sánchez, Morales-Yuste, Acedo-Sanchez, Barón, Díaz and Morillas-Márquez2009).
In conclusion, we have demonstrated the validity of the risk model produced for detecting hot spots for certain vector-borne diseases such as ACL through analysing the presence of the vector. The risk maps generated can prove very useful when making decisions regarding the kind of prophylaxis and control measures that should be adopted. Producing these risk maps for P. sergenti presence in this study allowed us to confirm that various areas in the centre and south of the Iberian Peninsula may be more susceptible to the potential establishment of an autochthonous focus of L. tropica, due to the higher probability of encountering its vector coupled with the influx of immigrants from endemic areas, which would enable the entry of this disease into south-western Europe.
ACKNOWLEDGEMENTS
We are grateful to the ‘Ministerio de Ciencia e Innovación’ for projects CGL2007-66943-CO2-O2, CGL2007-66943-CO2-O1, CGL2010-22368-CO2-O2 and CGL2010-22368-CO2-O1; to the ‘Junta de Andalucía’ for project P07-CVI-03249; and to the E.U. for EDEN (GOCE-2003-010284-2).
FINANCIAL SUPPORT
The ‘Junta de Andalucía’ subsidises project P07-CVI-03249, the ‘Ministerio de Ciencia e Innovación’ subsidises projects CGL2007-66943-CO2-O2, CGL2007-66943-CO2-O1, CGL2010-22368-CO2-O2 and CGL2010-22368-CO2-O1, and EDEN provided S.D. Barón with a PhD grant.



