INTRODUCTION
The concentration of radiocarbon (14C) in the atmosphere represents the balance of the natural and artificial production of this radioactive isotope. It is naturally produced in the atmosphere due to cosmic irradiation. Until the beginning of intensive use of fossil fuels the 14C concentration and the 14C/12C ratio was stable. However, the total cumulative atmospheric carbon after the beginning of the industrial revolution has significantly increased. At the beginning of the 20th century the Suess effect was observed—the atmospheric 14C/12C isotope ratio decreased due to massive use of fossil fuels. Later on, the nuclear weapons tests, on the contrary, sharply increased the 14C amount in the atmosphere to levels much higher (around 2 times) than the natural ratio (Stuiver and Polach Reference Stuiver and Polach1977; Stuiver Reference Stuiver1983) in 1960s. Currently the 14C amount has almost reached the background value comparable to the level that was observed in the 1950s due to its exchange in the global carbon cycle. Due to the fact that carbon is one of the basic elements of organics and its incorporation into the food chain by photosynthesis, the measurement of 14C is successfully used in dating techniques of archaeological samples. Moreover, nowadays this process is the natural way to discover and evaluate the local influence of operating nuclear objects such as nuclear power plants (NPPs) or nuclear fuel reprocessing facilities on the environment. In particular, the operating NPPs exhaust 14C with a number of other radionuclides—tritium 3H, radioisotopes of noble gases 85 m, 87Kr, 41Ar, 133, 135Xe—as gaseous or liquid releases.
The environmental influence of nuclear facilities is relatively low compared with the natural production rate of 14C in the upper atmosphere (1.4 PBq yr–1). Tree-ring analysis is an effective tool to trace previous discharges or to get the whole history of 14C airborne releases from the nuclear object (Isogai et al. Reference Isogai, Cook and Anderson2002) as well as to monitor the operating conditions of nuclear facilities (Wang et al. Reference Wang, Xiang and Guo2012; Ješkovský et al. Reference Ješkovský, Povinec, Steier, Šivo, Richtáriková and Golser2015; Koarashi et al. Reference Koarashi, Fujita and Nagaoka2016). Several studies have shown a slight excess of 14C in annual tree rings around the Barseback nuclear power plant (Sweden) and in the vicinity of the Paks nuclear power plant (Hungary) (Janovics et al. Reference Janovics, Kern, Güttler, Wacker, Barnabás and Molnár2013; Stenstrom et al. Reference Stenstrom, Skog, Thornberg, Erlandsson, Hellborg, Mattsson and Persson1997). Povinec et al. (Reference Povinec, Chudý and Šivo1986, Reference Povinec, Šivo, Ješkovský, Svetlik, Richtáriková and Kaizer2015) observed 14C variations in the vicinity of the Bohunice NPP (Slovakia). They concluded that the impact from the power plant on 14C levels in Zlkovice (monitoring station situated 5 km away from NPP) was negligible, resulting in 5‰ Δ14C, which is very close to the statistical limits (Povinec et al. Reference Povinec, Šivo, Ješkovský, Svetlik, Richtáriková and Kaizer2015). Other authors observed similar values of the 14C excess in the vicinity of the Dukonavy NPP (Czech Republic) (Svetlik et al. Reference Svetlik, Fejgl, Tomaskova, Turek and Michalek2012). The reported value of the 14C excess was 4.8‰ Δ14C. The observed small excess of 14C in the NPP surroundings was partially due the influence of the fossil fuel burning and small abundance of 14CO2 form (about 5%) released from the light water PWR type NPP (Svetlik et al. Reference Svetlik, Fejgl, Tomaskova, Turek and Michalek2012). Xu et al. (Reference Xu, Cook, Cresswell, Dunbar, Freeman, Hastie, Hou, Jacobsson, Naysmith, Sanderson, Tripney and Yamaguchi2016) analyzed the hypothesis that specific activities of 14C are positively correlated with the annual electricity generation values of the Fukushima Dai-ichi Nuclear Power Plant with BWR type reactors. In that case the relatively high correlation (r 2=0.7) was observed. The authors observed significantly elevated 14C specific activities compared with the ambient atmospheric levels between 1977 and 2010, indicating 14C discharges from the reactors during their normal operations.
This finding can be supported by various studies (Magnusson et al. Reference Magnusson, Stenström, Skog, Adliene, Adlys, Hellborg, Olariu, Zakaria, Rääf and Mattsson2004, Reference Magnusson, Stenström, Skog, Adliene, Adlys, Dias, Rääf, Zakaria and Mattsson2007) which indicate that some part of 14C generated and accumulated in technological media of NPP is available for release during the NPP operation. 14C is mostly available (or accessible) for release from the coolant, the moderator, evaporator concentrate as well as ion exchange resins and much less from fuel and fuel cladding or other irradiated hardware (Plukis et al. Reference Plukis, Remeikis, Juodis, Plukienė, Lukauskas and Gudelis2008; Mazeika Jonas Reference Mazeika2010). The chemical form of radiocarbon depends on the design features of the NPP. The boiling water reactors (BWRs) and heavy water reactors (HWRs, CANDU type) as well as gas cooled reactors (HTGR, AGR, Magnox) release 14C mainly as carbon dioxide 14CO2, whereas discharges from pressurized water reactors (PWRs) are dominated by hydrocarbons such as methane or ethane (Kunz Reference Kunz1985; Veres et al. Reference Veres, Hertelendi, Uchrin, Csaba, Barnabás, Ormai, Volent and Futó1995; Stenström et al. Reference Stenström, Erlandsson, Mattsson, Thornberg, Hellborg and Kiisk2000; Yim and Caron Reference Yim and Caron2006; Mazeika et al. Reference Mazeika, Petrosius and Pukiene2007). In light-water-cooled, graphite-moderated reactors (RBMK) 14C is released mainly in the form of 14CO2 (Gaiko et al. Reference Gaiko, Korablev, Solov’ev, Trosheva, Shamov, Umanets and Shcherbina1985; Konstantinov et al. Reference Konstantinov, Korablev, Solov’ev, Shamov, Fedorov, Litvinov, Olariu, Zakaria, Rääf and Mattsson1989) as typical for the BWRs. Gaiko et al. (Reference Gaiko, Korablev, Solov’ev, Trosheva, Shamov, Umanets and Shcherbina1985) reported that ~90% of the total 14C was produced in the graphite moderator of the RBMK reactor, however, is not expected to be available for release during normal operation of the reactor.
In this paper we analyze environmental samples from the vicinity of the Ignalina Nuclear Power Plant (INPP), located in the northeastern part of the Republic of Lithuania. The INPP with two currently shut-down RBMK-1500 units (design electric power 1500 MWe) was built to satisfy not only Lithuanian but also the former Soviet Union’s North-West power system needs. The INPP operated two RBMK-1500 graphite-moderated boiling water channel-type reactors. Each fuel assembly is located in separately-cooled fuel channels, all surrounded by the graphite moderator. In total, 3400 tons of graphite are stacked in both Units of INPP (Almenas et al. Reference Almenas, Kalietka and Ushpuras1994). Unit 1 came online in December 1983 and was shut down on December 31, 2004. Unit 2 was put into operation in August 1987 and shut down on December 31, 2009. According to the chosen immediate dismantling strategy after the final shutdown of the reactors, decommissioning activities gradually followed involving various projects of dismantling and radioactive waste management. Therefore, the whole operational period and the ongoing decommissioning are expected to be reflected in the vegetation samples from the vicinity of the INPP. Previous studies confirm 14C releases from the INPP (Magnusson et al. Reference Magnusson, Stenström, Skog, Adliene, Adlys, Hellborg, Olariu, Zakaria, Rääf and Mattsson2004, Reference Magnusson, Stenström, Skog, Adliene, Adlys, Dias, Rääf, Zakaria and Mattsson2007; Mazeika et al. Reference Mazeika, Petrosius and Pukiene2007) and the elevated 14C concentration in environmental samples. The 14C levels in the surroundings of the INPP have been studied by analysing various types of terrestrial and aquatic samples. Magnusson et al. (Reference Magnusson, Stenström, Skog, Adliene, Adlys, Hellborg, Olariu, Zakaria, Rääf and Mattsson2004) found 14C excess in the samples of willow, pine, and spruce in the vicinity of the INPP, while significantly higher values were found in moss samples. Authors also found the 14C excess of 10–80 pMC in the vegetation samples within a distance of 32 km of the power plant (Magnusson et al. Reference Magnusson, Stenström, Skog, Adliene, Adlys, Dias, Rääf, Zakaria and Mattsson2007). Mazeika et al. (Reference Mazeika, Petrosius and Pukiene2008) reported elevated 14C specific activities in the tree rings near the INPP in comparison with the tree rings from the background regions over the operation period of the INPP during the period 1984–2002. He showed that the highest excess of 14C activity of 5–10 pMC was in the period 1996–2002. In this paper the longer period of time is analyzed covering qualitatively new stages of late operational and post-shutdown periods including decommissioning of the nuclear reactors of the INPP.
Available modern techniques of accelerator mass spectrometry (AMS) for the 14C measurement as well as a considerable period of time of the INPP passed in the mode of decommissioning open new interesting opportunities to evaluate the radiological influence of this type of nuclear facility. The aim of this paper, based on the measurement of 14C in tree rings, is to observe the annual changes of the 14C concentration which can be related with various stages of the NPP operation, starting with its commissioning, including the operation with refurbishment works and post-shutdown activities. These issues specific to INPP were not analyzed in previous studies of 14C in the INPP environment and it was one of the driving forces to undertake this work. Special attention was paid to the maintenance and radioactive waste management activities which might be a source of additional releases of 14C during the plant operation and decommissioning. One of the expected results was to identify a correlation of the 14C concentration in the tree rings and the activities at the INPP susceptible to 14C release.
SAMPLES AND SAMPLING SITE
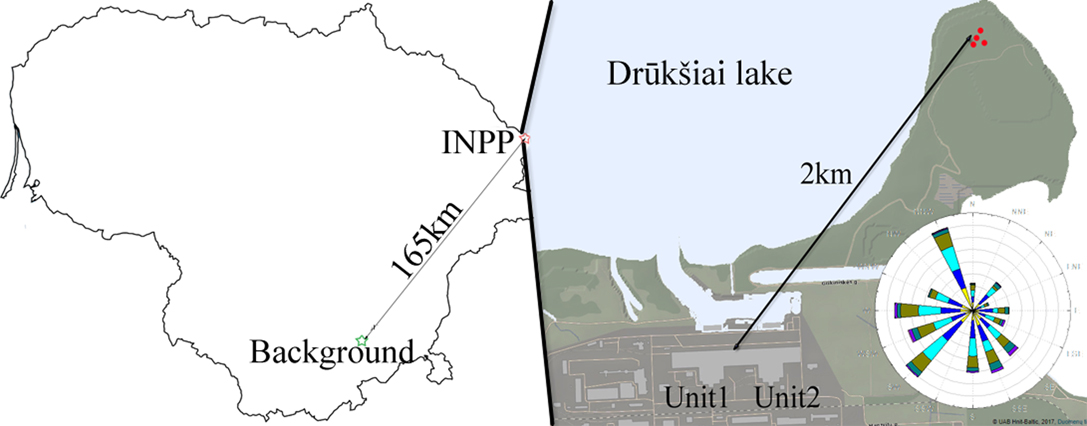
It has already been mentioned that 14C releases from RBMK type reactors are expected to be mostly in gaseous form of carbon dioxide, just as from other boiling water reactors (Yim and Caron Reference Yim and Caron2006). The main airborne releases are organized from three venting stacks of two reactor buildings and chemical treatment building No. 150 of the INPP. Therefore, the samples were collected at a short distance (2 km) from the power plant at the predominant wind direction which is west or southwest as can be seen from the wind rose provided in Figure 1. We selected pine trees from the peninsula located close to the INNP (Figure 1). Samples from this site probably represent the most contaminated area of the INPP (geographical coordinates 55º61′86′′N and 26º58′22′′E).
Location of sampling sites for 14C analysis, and wind rose of Ignalina NPP area.

Pine tree samples which represent a background area were collected 165 km away from the INPP in a village of Vaikšteniai (VKST). The area is surrounded by forest and as it will be shown in the text the anthropogenic contamination is negligible there (54º46′92′′N and 24º77′81′′E).
METHODS AND SAMPLE PREPARATION
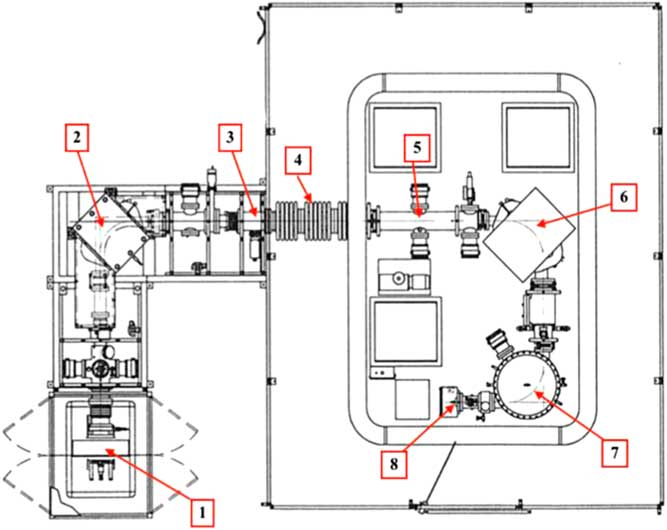
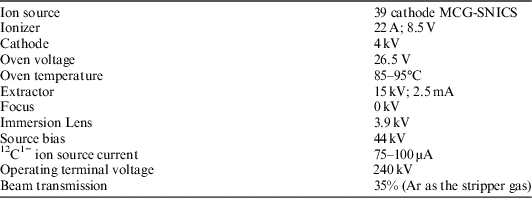
Three hundred fifty wood samples were prepared for 14C analysis. The 14C/12C ratios in the graphitized wood samples were measured using the 250 kV single stage accelerator mass spectrometer (SSAMS, NEC, USA). The typical scheme of used SSAMS is shown in Figure 2, and its parameters are given in Table 1. An accuracy of the measured 14C/12C ratio was better than 0.3%. The graphitized phthalic acid was used for estimation of the background of the measurements. It was determined to be 2.45×10⁻³ fM. IAEA-C3 standard was used as a reference material (percent of modern carbon (pMC) value of 129.41). The reproducibility of the latter standard measurements was estimated to be 0.2%. For of the isotopic fractionation correction the ratio of 13C/12C was used.
250 kV single stage accelerator mass spectrometer and its major components: 1. ion source with the sample wheel of 39 positions; 2. dipole magnet; 3. Einzel lens; 4. 250 kV accelerator; 5. molecular dissociator; 6. dipole magnet; 7. ESA; and 8. solid-state detector.

Typical parameters of SSAMS.

Pine tree core samples of 5 mm in diameter were collected using a tree ring borer. The sampling height was 1.4 m, chosen to avoid the lobate growth, root diseases, basal injuries and animal influence. Two cores were extracted from one tree. The core represents all tree rings from the core wood to the bark. The most representative 8 core samples from 8 trees were selected for analysis and were used for year-by-year tree ring preparation. Using a cutting tool the tree rings from years 2015–1955 were separated and dried in Eppendorf tubes. Fake tree rings were marked and separated to identify the double year calculation error.
The cellulose fraction was collected using the BABAB (base-acid-base-acid-bleach) method by Němec et al. (Reference Němec, Wacker, Hajdas and Gäggeler2010). The result is the prepared white, tree ring shape, soft cellulose sample. The graphitization procedure was performed with AGE3 equipment (Wacker et al. Reference Wacker, Němec and Bourquin2010). The required amount of 2.8 mg of sample material was weighed, wrapped in a tin capsule and combusted in the elemental analyzer (Vario Micro). Helium carrier gas was used to transport CO2 collected from the sample to the CO2 trap inside the graphitization unit. After extraction from the trap, CO2 gas was converted to solid state carbon (graphite). The prepared sample (graphite) was used to produce SSAMS targets for 14C analysis.
RESULTS AND DISCUSSION
Tree Rings Analysis for 14C Background Evaluation
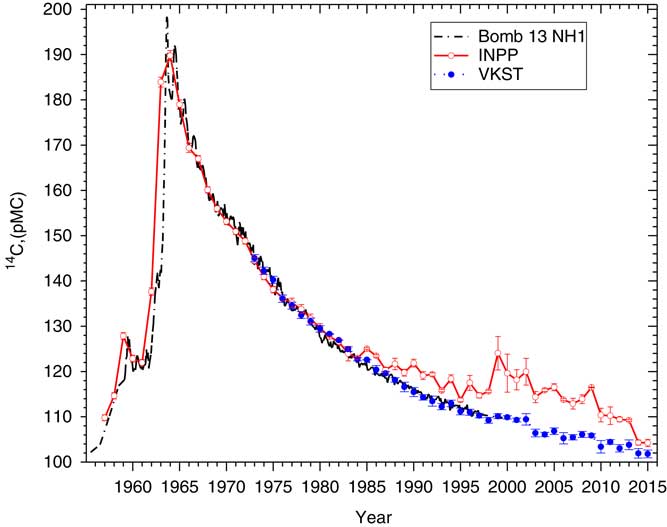
As already mentioned, the data for the background analysis were collected from four different trees located 165 km southwest from the INPP (Vaikšteniai area, VKST) and these data were combined with those from the samples of the INPP area for the pre-operational period (before 1973). The studied period covers the nuclear weapons tests and obviously the highest 14C concentration of 189 pMC was observed in 1964, which is the representative year of maxima during these tests. Nowadays according to the background trees (VKST) the 14C concentration decreased 1.82 times and reached 104 pMC in 2015.
Several studies estimating the 14C background concentration in Lithuania were done in the past (by Mazeika et al. Reference Mazeika, Petrosius and Pukiene2007, Reference Mazeika, Petrosius and Pukiene2008, Reference Mazeika2010). Our results are in good agreement with these data. Moreover, we compared our background curve with the 14C concentration data in the northern hemisphere (Bomb 13 NH1 see Figure 3; Ramsey et al. Reference Ramsey1995). The correlation of our measurements with the data of Bomb 13 NH1 for the time period of 1955–2000 is 0.997, in addition our data for the period of 1974–1996 were compared to the data reported by Levin et al. (Reference Levin, Kromer, Barabas and Munnich1988) and a good correlation was observed (r=0.991). Therefore, it was accepted as an ambient background curve. In summary we can state that the Vaikšteniai area is currently not affected by local anthropogenic activities and the background data from Vaikšteniai trees well represent the global 14C distribution of the northern hemisphere.
14C concentration in pine tree rings in Lithuania for the period 1955–2015 in comparison with 14C concentration in northern hemisphere according to Bomb 13 NH1 (Ramsey Reference Ramsey1995) (dash-doted black line). The red curve represents the trees from the INPP area and the blue curve represents the background area of Vaikšteniai (VKST). (See online version for colors.)

14C Variation in the Annual Rings of the Trees in the Vicinity of INPP
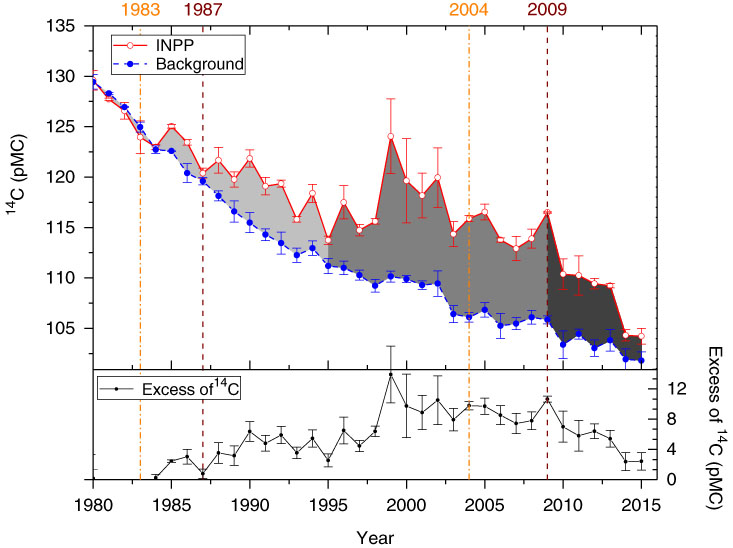
Samples from four different trees were also collected in the vicinity of the INPP. In this way we avoided the accidentally “bad” tree for sampling (we had the possibility to identify the outlier point) and ensured the quality of the obtained results. The time span of these samples covers the period of 1973–2015. Though the INPP started its operational activity in 1983 and the period of 1973–1983 is also important as it shows that before the INPP operation there were no local anthropogenic activities that could affect the 14C content. For this period and within the range of one sigma the data from VKST trees coincide with the data from the INPP area, see Figure 3.
The time period of 1983–2009 covers the whole INPP operational period. The estimated 14C excess clearly shows that also during the normal operation of the INPP the airborne release of 14C was detectable in environmental samples. A more detailed view of these results is presented in Figure 4.
14C-specific activity and 14C excess in pine tree rings in the vicinity of INPP for the period of operation (1980–2015), compared with 14C activity in background location VKST.

The whole time span reproduced from tree ring measurements can be divided into several periods. We observe that from the beginning of the INPP operation (1983–1994) the excess of 14C was negligible resulting in an average excess of 3 pMC in this period and reaching the maximum value of 6 pMC. These findings are in a good agreement with previous studies done by Mazeika et al. (Reference Mazeika, Petrosius and Pukiene2008). In 1983 Unit-1 came online. Until 1985 no environmental impact can be identified, and this can be explained that there were no any refuelling operations of the reactor were needed, therefore 14C emissions most probably were negligible. In 1985 we can see the first increase of 14C. This can be related to the maintenance activities of Unit-1, first of all the refuelling operations of the reactor core as well as the annual refurbishment of the reactor equipment, so these activities could have a tangible 14C impact. In 1987 Unit-2 came online, however, as in case of Unit-1, no additional increase of the 14C concentration was observed until 1989, presumably due to the reason of no need of refuelling of Unit-2. In 1990 the 14C concentration increased, and this remained for the period of the routine operation of two Units of the INPP extended up to 1998 which is a clear breaking point in the INPP curve. From this point the excess of 14C content increases almost twice and it persist elevated up to the final shutdown of Unit-2 in 2009. The highest excess in this period reached 14 pMC. The period from 2010 to 2013 covers a lot of decommissioning works in the INPP where an average excess of radiocarbon equals to 5 pMC. Finally, the last two points in Figure 4 show that the 14C activity in the INPP area approaches the background curve within an interval of two sigmas in 2014 and 2015.
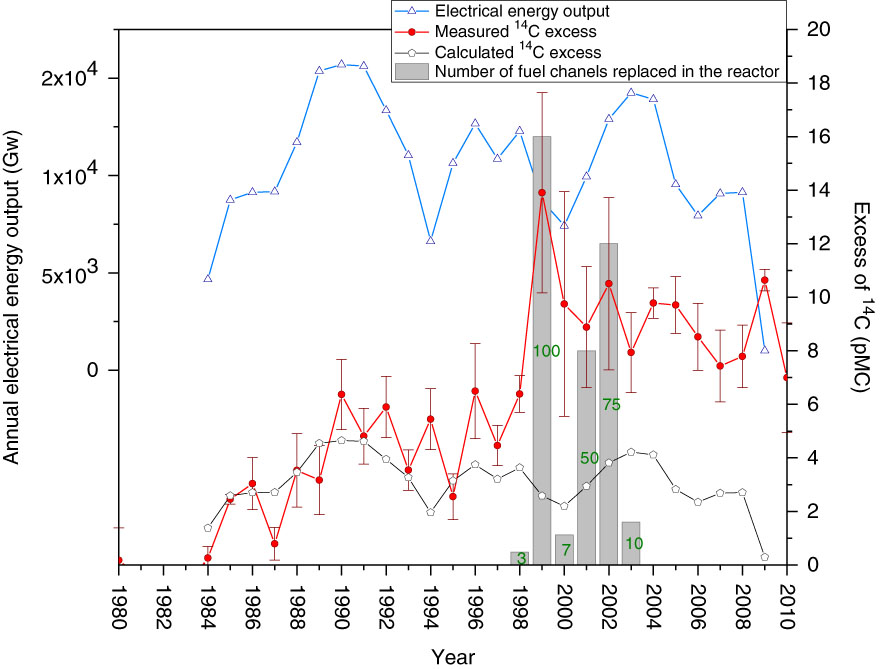
Taking into account the before mentioned observations we can divide the graph into three major periods: period I—1983–1997, period II—1998–2009, and period III—2010–2015. The most interesting case is the second one where the emissions of 14C almost double. Thus we analyze this period in more detail. Many papers suggest that there should be a classical relationship between the electrical energy output and 14C emissions (UNSCEAR 2000; Graven and Gruber Reference Graven and Gruber2011). For most of reactors we can find the 14C emission factors in literature, e.g., 0.22 TBq/GWa for PWRs, 0.51 TBq/GWa for BWRs, 1.6 TBq/GWa for HWRs, 1.4 TBq/GWa AGRs, 5.5 TBq/GWa for Magnox GCRs and 1.3 TBq/Gwa for LWGRs (Xu et al. Reference Xu, Cook, Cresswell, Dunbar, Freeman, Hastie, Hou, Jacobsson, Naysmith, Sanderson, Tripney and Yamaguchi2016). The INPP is equipped with 2 RBMK type reactors, which are graphite moderated light water cooled reactors. The relation of the 14C excess and the annual energy output of the INPP is presented in Figure 5. We can observe this relation between the energy output and the 14C excess only in the first operational period (1983–1995). The correlation factor is reasonably good (r=0.8). However, a very low correlation (r=0.1) in the further time span clearly indicates the presence of the additional 14C source of airborne releases which is not directly related to the electrical energy output. Using a simple mathematics on the basis of the data of the first period with the reliability of 80% we can calculate and extrapolate the theoretical 14C excess, see Figure 5. These estimations suggest that the 14C release correlation with the energy production should be roughly the same as in the first operational period. One of explanations of the notable difference of the forecasted and actual 14C excess could be the refurbishment of the reactors, which had started in 1998.
Analysis of the correlation of the annual electrical energy production and 14C excess in pine tree rings as well as maintenance works (replacement of fuel channels of RMBK reactors, according to INPP safety reports 1998–2003 (Ignalina NPP 1999).

We explain this increase of the 14C excess by the additional maintenance works at the INPP, and first of all the replacement operations of zirconium alloy tubes of the fuel channels. In Figure 5 we can see that during the operation of INPP Units 1 and 2 the following number of fuel channel tubes was replaced: 3 fuel channel tubes in 1998, 100 in 1999, 7 in 2000, 50 in 2001, 75 in 2002, and 10 in 2003. During this technical operation, which is specific to the channel type RBMK reactors, the fuel channel tube is extracted from the reactor core and replaced by the new one. This is done in order to preclude the closure of the technological gap between the channel tube and the graphite stack after the reactor operation of about 20–25 yr (Almenas et al. Reference Almenas, Kalietka and Ushpuras1994). During the replacement procedure the reactor graphite stack cavity is opened and therefore some part of non-fixed CO2 is expected to be released to the ventilation system of the plant.
Although the ventilation system is equipped with aerosol and activated carbon filters as well as delay chambers for decay (Almenas et al. Reference Almenas, Kalietka and Ushpuras1994; Remeikis et al. Reference Remeikis, Juodis, Plukis, Vycinas, Rozkov and Jasiulionis2012), considerable part of CO2 is expected to be released from the ventilation system through the main stacks of reactor buildings. According to the information from the INPP (Ignalina NPP 1999) the releases from the chemical treatment building (No. 150) are by about one order of magnitude lower than that from the reactor buildings No. 101/1 and 101/2, therefore it should not be the determining factor of airborne releases. Atmospheric discharges from other INPP buildings No. 156 (special laundry), No. 157 (temporary storage of radioactive waste), No. 158 (bituminized waste storage), No. 159 (car wash shop), No. 130 (repair shop) are comparable or less than the ones from building No. 150 (Ignalina NPP 1999). However, as one can see in Figure 5, it must be admitted that there exist additional sources for the 14C release. The episode from 1998 to 2003 shows a relatively good correlation between the number of replaced fuel channels and the 14C excess measured in pine tree rings (coincidence of measured 14C peaks and the number of replaced fuel channels in 1999 and 2002), which supports this statement. Other fluctuations of 14C might also be attributed to the maintenance and radioactive waste treatment and management activities, which were considerably increased during the late operational and following the final shut-down periods of both Units of the INPP. One of the emerged radioactive waste treatment activities to be mentioned is launching the cement solidification facility for liquid radioactive waste including ion exchange resins, which are one of the 14C accumulation media at NPPs (Yim and Caron Reference Yim and Caron2006). The waste cementation started in 2006, however, the annual throughput of processed radioactive waste increased gradually after the commissioning of the facility.
CONCLUSIONS
In this paper we analyze the data of 14C measurements in the vicinity of the INPP and in the rural environment representing the background situation of Lithuania. In particular, the annual 14C variations in pine tree rings for the period of 1955–2015 were analyzed, and the timeframe from 1983 to 2015 was studied in more detail in order to take into account the stages of the INPP operation and decommissioning. According to the measured 14C excess, this time span was divided into the three periods as follows: period I—operation with minor maintenance activities (1983–1997); period II—operation with enhanced maintenance activities up to the final shutdown of both Units (1998–2009); period III—plant post-shutdown operation with ongoing decommissioning activities (2010–2015). The results demonstrate that during period I of the INPP operation the excess of 14C was negligible with an average value of 3 pMC and we do observe a reasonably good correlation (r=0.8) of 14C excess with an annual electricity generation. This can be explained by the fact that there were no additional airborne release sources which could negatively influence this relationship (e.g., maintenance of the reactor equipment). However, during period II (1998–2009) the excess of 14C almost doubled (the average value enhances to 7 pMC) and we do not observe the 14C–energy production correlation.
These observations let us make an assumption that the additional 14C release source makes a significant contribution to the total 14C discharges from the INPP. In particular, for some operational period (1998–2003) we observe a relatively good correlation of the 14C excess with the number of replaced fuel channels in both Units of the INPP (245 fuel channels were replaced in total), which can be well explained by the fact that these refurbishment activities can be the cause of the additional 14C release from the graphite stack of the RBMK reactors. Period III represents the post-shutdown lifetime of the INPP with considerably reduced but still elevated 14C values (3–7 pMC) which can be explained by the decommissioning works ongoing at the INPP, including the radioactive waste management. Therefore, it can be concluded that the maintenance and radioactive waste management activities at NPPs can be a considerable source of 14CO2 airborne releases.