Implications
Supplementation of condensed tannins (CT) to rations of high yielding dairy cows might reduce volatile N losses and emissions but decreased milk protein yield, milk urea concentration and apparent N efficiency such that under current circumstances an economic benefit is not given. The CT concentration in Acacia mearnsii extracts is variable (even for the same commercial product) and was much lower than stated. Chemical analysis before use in research is necessary.
Introduction
In dairy research, there is growing interest in reducing N emissions and concurrently improving the N use efficiency of dairy cows. One approach is based on protecting feed protein from ruminal degradation to increase the amount of protein that can be digested in and absorbed from the small intestine. Here, the use of secondary plant compounds like CT occurring naturally in mostly tropical trees and shrubs as well as in forage or grain legumes has gained some importance. The CT are of interest in ruminant nutrition because of their reactivity with feed protein and other feed compounds after ingestion (Min et al., Reference Min, Barry, Attwood and McNabb2003) in a pH dependent intensity (Jones and Mangan, Reference Jones and Mangan1977). This allows formation of strong CT–protein complexes in the rumen and release of the protein in the acidic environment in the abomasum and proximal duodenum. Increasing CT concentrations in ruminant rations has been shown to increase the amount of undegraded feed protein leaving the rumen, most likely caused by decreased rates of degradation by rumen microorganisms and reduced growth rate of proteolytic bacterial species (Min et al., Reference Min, Barry, Attwood and McNabb2003). However, there is a considerable variability in concentration and chemical structure of CT especially in forage legumes such that there is need for more standardized products to ensure a predictable mode of action. Industrial products containing defined amounts of tannins, for example of the bark of the Black Wattle tree (A. mearnsii) are seen as a promising source of CT for the use as feed supplement in ruminants.
Dietary supplementation with CT extract from A. mearnsii to grazing dairy cows has reduced CH4 emissions and partitioned N away from urine towards faeces, demonstrating the potential of mitigating greenhouse gas emissions (Grainger et al., Reference Grainger, Clarke, Auldist, Beauchemin, McGinn, Waghorn and Eckard2009). A similar effect was observed by Staerfl et al. (Reference Staerfl, Zeitz, Kreuzer and Soliva2012) who fed an A. mearnsii extract (3% of dry matter (DM)) to fattening bulls. Formation of CH4 was reduced by 36%, but there was also a marked negative effect on digestibility of NDF. Although a reduction of methane emissions was observed in most studies, results of CT supplementation on productivity of dairy cows were inconsistent. A reduction in milk yield was reported by Grainger et al. (Reference Grainger, Clarke, Auldist, Beauchemin, McGinn, Waghorn and Eckard2009) but other authors reported no effect (Benchaar et al., Reference Benchaar, McAllister and Chouinard2008) or observed improved milk production in sheep grazing Lotus corniculatus (birdsfoot trefoil cv. Grasslands Goldie) containing CT (Wang et al., Reference Wang, Douglas, Waghorn, Barry and Foote1996). As results on the impact of CT on productivity of ruminants are equivocal and the underlying mechanisms poorly understood, the aim of this study was to evaluate the effect of a commercial product rich in CT from A. mearnsii on DM intake (DMI), productivity and N use efficiency of high yielding dairy cows.
Material and methods
Between 8 January and 25 June 2013, a feeding trial was conducted at the free stall dairy barn of the Experimental and Educational Centre for Agriculture ‘Haus Riswick’, Chamber of Agriculture of North Rhine-Westphalia, Kleve, Germany (51° 47′ 18N, 6° 8′ 19E) to study the effect of CT supplementation on performance and N use efficiency in dairy cows. Animal care and handling was done according to official German regulations (Anonymous, 2013) and approved by the authorities of the state of North Rhine-Westphalia. The feeding trial in the naturally ventilated barn was accompanied by long-term measurements of gaseous emissions (CH4 and NH3) (Schmithausen, Reference Schmithausen2017).
Animals and trial design: feeding trial with dairy cows
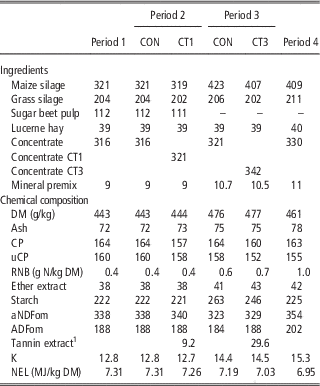
A total of 96 lactating German Holstein cows (25% primiparous, 98 (SD 53.9) days in milk (DIM) at the commencement of the trial) were randomly allocated to one of two groups with 48 cows each (control (CON) and experimental (EXP) group) and balanced for means of lactation number, DIM, milk yield and BW. During the trial, 48 cows left the experiment when high in DIM (45 cows) or because of illness (two cows in CON and one cow in EXP). Cows high in DIM were replaced by cows with lower DIM and ill animals were replaced by healthy animals with similar productivity to avoid impact on the group averages. All cows were fed a total-mixed ration (TMR) calculated for 37 kg energy-corrected milk (ECM) per day. The TMR was mixed once daily in a fodder mixing wagon, distributed to and offered for ad libitum intake in permanently installed weighing troughs (Waagen Döhrn, Wesel, Germany) with transponder-controlled access gates which allowed cows to be identified at each visit and thus enabled recording of individual daily feed intakes. Cows had free access to water and salt-licks at all times. The 169-day feeding trial was divided into four periods, starting with a 28-day period (period 1) where both groups were fed the same ration. During periods 2 and 3, the ration of EXP was supplemented with 1% (CT1; period 2; 42 days) and 3% of DM (CT3; period 3; 63 days) of an extract rich in CT made from the bark of A. mearnsii (declared concentration of CT of 0.725 g/g DM, Weibull Black, TANAC S.A., Montenegro, Brazil) whereas the ration of CON was unchanged. During period 4 (36 day), cows in both groups were fed the same ration (without CT) again. Composition of rations is given in Table 1.
Ingredient and chemical composition of the control (CON) and experimental rations (supplemented with 1% (CT1) and 3% (CT3) in ration dry matter (DM) of a condensed tannin extract1) used in the feeding trial with cows (expressed as g/kg DM unless stated otherwise)

CT=condensed tannin; uCP=utilizable CP at the duodenum; RNB=ruminal nitrogen balance (CP−uCP/6.25); aNDFom=NDF assayed with heat-stable amylase and expressed exclusive residual ash; ADFom=ADF expressed exclusive residual ash; NEL=net energy for lactation.
1 Acacia mearnsii tannin extract (Weibull Black, Tanac S.A., Montenegro, Brazil).
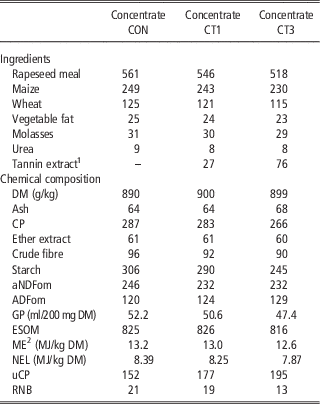
The CT product was mixed into the commercially produced pelleted concentrate during processing. The ingredient and chemical composition of the different concentrates fed to dairy cows, namely CON, CT1 and CT3 is presented in Table 2.
Ingredient and chemical composition of the concentrates used in the feeding trials (expressed in g/kg DM unless stated otherwise) for cows in control (CON) and experimental group supplemented with 1% (CT1) or 3% in ration dry matter (DM) (CT3) condensed tannin extractFootnote 1

aNDFom=NDF assayed with heat-stable amylase and expressed exclusive residual ash; ADFom=ADF expressed exclusive residual ash; GP=24 h gas production; ESOM=enzyme-soluble organic matter; ME=metabolizable energy; NEL=net energy for lactation; uCP=utilizable CP at the duodenum; RNB=ruminal nitrogen balance.
1 Acacia mearnsii tannin extract (Weibull Black, Tanac S.A., Montenegro, Brazil).
2 Estimated according to GfE (2009).
Cows were milked twice daily at 0500 and 1630 h in a rotary milking parlour and milk production was recorded electronically. Each week, milk performance monitoring was conducted on a pooled sample, collected as an aliquot composite from the evening and morning milkings. The sample was stored at 4°C with a preservative (bronopol) until analysis. Samples were analyzed for fat, protein, urea and somatic cell counts in the laboratory of the Landeskontrollverband Nordrhein-Westfalen (Krefeld, Germany). Milk fat, protein and urea were determined by an instrumental method using mid-IR specific absorption spectroscopy (MilkoScan FT+, Foss Electric, Hillerød, Denmark). The analysis of somatic cells was based on the principle of the Fluoro-Opto-Electronic-Cell-Counting, also employing the System CombiFoss 6000 (Foss Electric, Hillerød, Denmark). The amount of ECM was calculated based on Gesellschaft für Ernährungsphysiologie (GfE) (2001):
 $$\eqalign {{\rm ECM}\ ( {{\rm kg}/{\rm day}} ){\equals}{\rm milk}\,{\rm yield}\ ( {{\rm kg}/{\rm day}} ){\times}( {{{( {[ {0.38{\times}{\rm fat}( \,\%\, ) }}}}} \cr {{{{ \ {\ {\plus}0.21{\times}{\rm protein}\left( \,\%\, \right)} \right]{\plus}1.05} \right)} \mathord{\left/ {\vphantom {{\left( {\left[ {0.38{\times}{\rm fat}\left( \% \right){\plus}0.21{\times}{\rm protein}\left( \,\%\, \right)} \right]{\plus}1.05} \right)} {3.28}}} \right. \kern-\nulldelimiterspace} {3.28}}} \right).$$
The BW of each cow was measured twice daily directly after milking using an electronic scale (Taxatron 5000, GEA Farm Technologies, Bönen, Germany) installed at the exit of the milking parlour. For each cow, the energy balance (EB) was calculated as the energy intake from TMR (MJ of net energy for lactation (NEL)/day) minus the NEL requirement for maintenance (MJ/day=0.293×BW (kg0.75)) and the energy output in milk (MJ/day), all using the individual cow as the experimental unit.
Data collection, chemical analyses and calculations
The DM concentration of the ration was determined daily using a two-step procedure involving pre-drying samples at 60°C, followed by oven-drying at 105°C and DM was corrected (DMcor) for the loss of volatiles during drying according to Weißbach and Kuhla (Reference Weißbach and Kuhla1995): DMcor (%)=2.08+0.975×DM (%).
Daily DMI was calculated for each cow on the basis of the automatically determined TMR intake and the DMcor concentration of the ration. Samples of forages were collected weekly from the surface of each silage stack and stored at −18°C. A cumulative sample for each stack was added up for analyses. Concentrate samples were taken from each batch at delivery and stored at −20°C until analysis for the chemical composition and estimation of energy value. Analysis of the chemical composition of all ration components was done by the Landwirtschaftliche Kommunikations- und Service GmbH (Lichtenwalde, Germany). All components of the basal ration were analyzed individually and chemical composition of the ration offered to the animals was re-calculated afterwards. Proximate analyses were done according to VDLUFA (2012) and method numbers are given below. Ash, ether extract (EE) and CP were analyzed using methods 8.1, 5.1 and 4.1.1. The concentration of NDF, which was assayed with a heat-stable amylase (6.5.1) and ADF (6.5.2) were expressed exclusive of residual ash and therefore denoted aNDFom and ADFom, respectively. Starch was determined following method 7.2.1 (VDLUFA, 2012). The determination of enzyme-soluble organic matter (ESOM) was done according to method 6.6.1. The Hohenheim gas test (HGT; method 25.1) was conducted for measuring the 24 h in vitro gas production (GP, ml/200 mg DM). To estimate utilizable CP at the duodenum, which reflects the sum of ruminally synthesized microbial CP and RUP flowing into the duodenum (Lebzien and Voigt, Reference Lebzien and Voigt1999; GfE, 2001) and thus representing a precursor to metabolizable protein for ruminants, a modified HGT was carried out as described by Steingaß et al. (Reference Steingaß, Nibbe, Südekum, Lebzien and Spiekers2001) and outlined by Steingaß and Südekum (Reference Steingaß and Südekum2013). The concentration of metabolizable energy (ME) of TMR components was calculated according to following equations:
For grass silages (GfE, 2008): ME (MJ/kg DM)=5.51+0.0828×ESOM−0.00522×ash+0.02507×EE−0.00392×ADFom; all expressed as g/kg DM; for maize silages (GfE, 2008): ME=7.15+0.00580×ESOM−0.00283×aNDFom+0.03522×EE; all expressed as g/kg DM; for compound feeds (GfE, 2009): ME (MJ/kg DM)=7.17−0.01171×ash+0.00712×CP+0.01657×EE+0.00200×starch−0.00202×ADFom+0.06463×GP (ml/200 mg DM); all expressed as g/kg DM unless stated. The NEL values were estimated from ME according to Weißbach et al. (Reference Weißbach, Schmidt and Kuhla1996):
 $${\rm NEL}\ \left( {{\rm MJ}/{\rm kg}\,{\rm DM}} \right){\equals}{\rm ME}\left[ {0.46{\plus}12.38\,{\rm ME} / \left( {1000{\minus}{\rm ash}} \right)} \right].$$
The analysis of total phenol and total tannin concentration in the Weibull Black product was conducted using the Folin method (Makkar, Reference Makkar2000) and the concentration of CT was done with the HCl-butanol method (Terrill et al., Reference Terrill, Rowan, Douglas and Barry1992).
Nitrogen excretion
At the end of period 3 (day 53), faeces and urine samples of 10 cows per group were collected once for estimation of N excretion of cows. For this purpose, cows similar to the group average (milk yield, DIM, lactation number) were selected. Spot faecal and urine samples voided by individual cows were taken and directly frozen at −18°C until analysis (Landwirtschaftliche Kommunikations- und Service GmbH). They were analyzed for DM, ash and N as described above and urine samples were additionally analyzed for urea-N and K. The determination of urea-N was done according to VDLUFA (2012), method 4.6.1 and K was analyzed as described in DIN EN ISO 11885:2009-09 (DIN, 2009). For estimating N excretion, K was used as a marker for estimation of daily amount of urine. Based on that information and the analyzed N concentration in urine the daily amount of N excreted via urine could be estimated. Furthermore the digestibility of organic matter (OM) was estimated using CP concentration in faeces such that finally the amount of faeces and N excretion via faeces could be estimated. In detail, the procedure was as follows: milk was assumed to contain 1.5 g K/kg (GfE, 2001). The K apparently digested (DK) was calculated using the equation by Bannink et al. (Reference Bannink, Valk and Van Vuuren1999):
 $${\rm D}_{{\rm K}} {\equals}{\minus}20.48{\plus}0.941{\times}{\rm K}\,{\rm intake}\,\left( {{\rm g}/{\rm day}} \right).$$
Afterwards, the daily amount of K excreted in urine (UK) was calculated using the following equation (Bannink et al., Reference Bannink, Valk and Van Vuuren1999):
 $${\rm U}_{{\rm K}} {\equals}25.25{\plus}0.935{\times}({\rm D}_{{\rm K}} {\minus}{\rm K}\,{\rm in}\,{\rm milk})\,\left( {{\rm g}\,{\rm K}/{\rm day}} \right).$$
Using the K concentration and the amount of K in urine per day the urine volume was calculated. Based on this volume, the daily urine N excretion was estimated. The estimation of OM digestibility (DOM) was done according to Lukas et al. (Reference Lukas, Südekum, Rave, Friedel and Susenbeth2005):
 $${\rm D}_{{{\rm OM}}} \left( \,\%\, \right){\equals}79.76{\minus}107\,{\rm e}^{{\left( {{\minus}0.01515{\times}\,{\rm faeces}\,{\rm CP}({\rm g}\,/\,{\rm kg}\,{\rm OM})} \right)}} .$$
Afterwards, amount of faeces excreted (g DM/day) and daily N excretion with faeces (g N/day) could be calculated such that the estimated amounts and proportions of N excreted via milk, urine and faeces were available.
Statistical analyses
Statistical analyses were conducted using SAS 9.3.
Feeding trial
Performance data from the feeding trial with dairy cows were analyzed using the mixed model procedure. All cows with at least 40 day of complete consecutive data available were included in the statistical analysis. The following model was used, correcting data for each cow for the mean DIM.
 $$Y_{{ijklm}} {\equals}\mu {\plus}LN_{i} {\plus}H\_G_{{jk}} {\plus}\mathop{\sum}\nolimits_{n{\equals}1}^4 {\beta _{n} X_{n} {\plus}{\rm cow}_{{ijkl}} {\plus}e_{{ijklm}} } $$
where Y
ijklm
is the observed response; µ the overall mean; LN
i
the fixed effect of lactation number i (i=1, 2, >2); H_G
jk
the herd test day j×group k (j=1, … 169, k=CON, EXP);
 $$\mathop{\sum}\nolimits_{n{\equals}1}^4 {\beta _{n} X_{n} } $$
the regression coefficient Y in dependence of DIM; (X1=DIM/305; X2=X1
2, X3=ln(305/DIM); X4=X2
3) (Ali and Schaeffer, Reference Ali and Schaeffer1987); cow
ijkl
the random effect of animal; eijklm=residual error.
For comparison of groups, linear contrasts between the mean H_G estimates of CON and EXP were calculated. In order to model the covariance structure of repeated measurements the ARMA function of SAS procedure MIXED was used.
Nitrogen data
Data on N intake and excretion via milk, urine and faeces obtained from sampling of 10 cows of each group in period 3 were analyzed using the GLM procedure with a fixed model that included the effects of treatment and lactation number and DIM as a linear covariate.
 $$Y_{{ijl}} {\equals}\mu {\plus}G_{i} {\plus}{\rm LN}_{i} {\plus}\beta \,{\rm DIM}_{{ijk}} {\plus}{\rm cow}_{{ijk}} {\plus}e_{{ijk}} $$
where Y ijl is the observed response; µ the overall mean; G i the effect of group i (i=CON, EXP); LN j the effect of lactation number j (j=1, 2, >2); DIM k the effect of DIM k (k=1, … 305); cow ijk the random effect of animal; e ijk the residual error.
For all analyses, differences were considered significant with P⩽0.05 and differences with 0.05<P⩽0.10 were accepted as representing tendencies.
Results
Feeding trial
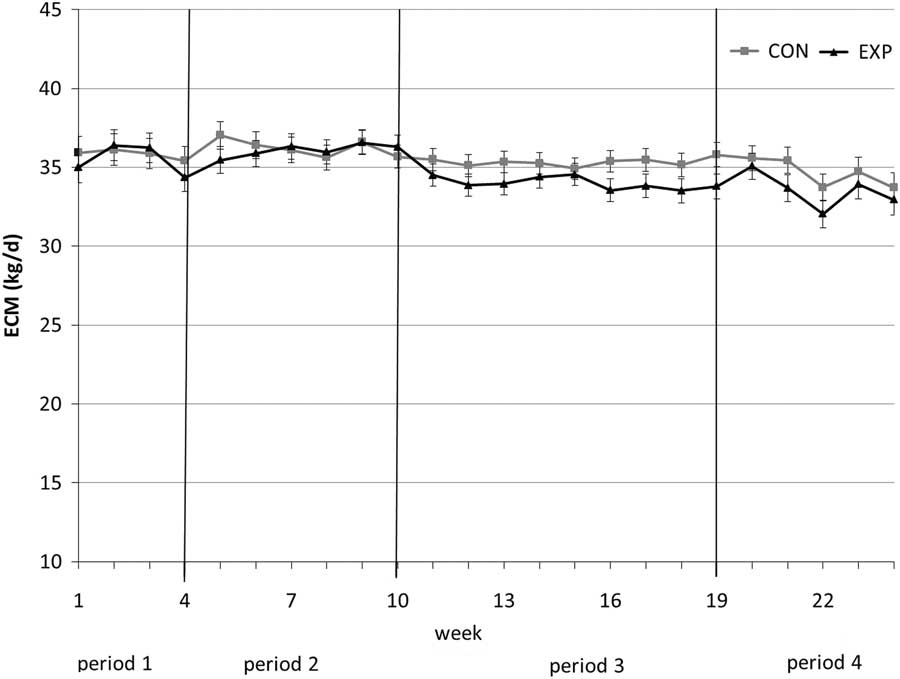
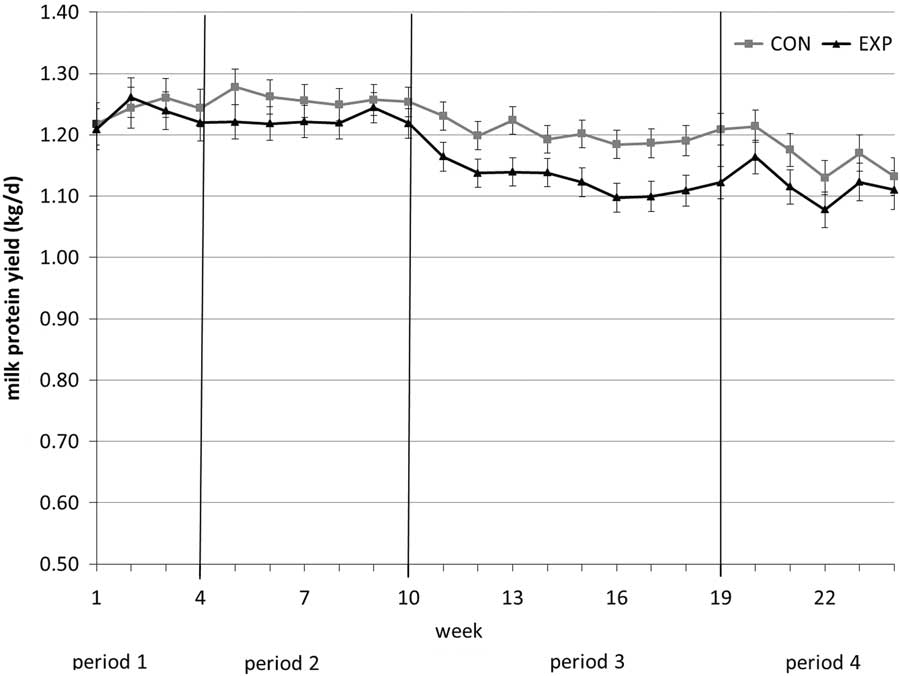
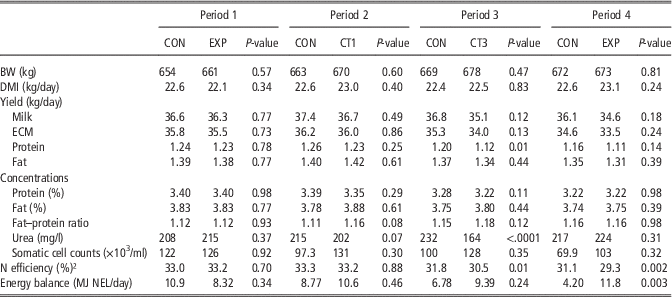
For the entire feeding trial, a total of 144 cows were used. In each group, 25 cows were in the trial for the full time of 169 day. Three cows had to be replaced in between because of rumen disorders (two cows in CON) and leg injury (one cow in EXP) and 45 cows left the experiment when high in DIM. The mean DIM of cows was 107 (SD 50.8) and 115 (SD 57.2) in period 1, 142 (SD 51.6) and 150 (SD 58.2) in period 2, 150 (SD 48.9) and 151 (SD 55.1) in period 3, and 181 (SD 53.3) and 178 (SD 55.4) in period 4 for CON and EXP, respectively. All periods could be carried out as planned without incidents. Supplementation of the CT extract did not cause feed avoidance or other irregularities in feeding behaviour. The total phenol concentration in the Weibull Black product was 0.630 g/g DM and the total tannin concentration was 0.568 g/g DM. The concentration of CT was 0.203 g/g DM and therefore much lower than claimed by the manufacturer. Intake of the tannin product was between 118 and 256 g/day and cow in period 2 and 486 and 835 g/day in period 3, resulting in intake of CT of 24 and 52 g/day and 99 and 170 g/day, in periods 2 and 3, respectively. The DMI and performance data of CON and EXP (LSmeans) in the different periods of the feeding trial are shown in Table 3 and the courses of ECM and milk protein yields throughout the whole experiment are depicted in Figures 1 and 2, respectively.
Energy-corrected milk (ECM; LSmeans±SEM) in control group (CON) and experimental group (EXP) supplemented with 1% (period 2) and 3% of ration dry matter condensed tannin extract (Acacia mearnsii tannin extract; Weibull Black, Tanac S.A., Montenegro, Brazil).

Milk protein yield (LSmeans±SEM) in control group (CON) and experimental group (EXP) supplemented with 1% (period 2) and 3% of ration dry matter condensed tannin extract (Acacia mearnsii tannin extract; Weibull Black, Tanac S.A., Montenegro, Brazil).

Dry matter intake (DMI), milk production and composition and energy balance of cows in control (CON) and experimental (EXP) group supplemented with 1% (CT1) or 3% in ration DM (CT3) condensed tannin extractFootnote 1 (LSmeans)

ECM=energy-corrected milk; NEL=net energy for lactation.
1 Acacia mearnsii tannin extract (Weibull Black, Tanac S.A., Montenegro, Brazil).
2 Apparent N efficiency (kg milk N/kg feed N×100).
No difference between groups was observed for DMI, milk yield, ECM and milk fat (P>0.05). In period 2, CT1 tended to decrease milk urea concentration (P<0.1) and increased the milk fat to protein ratio (P<0.1). The other variables did not differ between the CON and CT1 groups. In period 3, CT3 caused a reduction in milk urea concentration as well as in milk protein yield and apparent N efficiency (P<0.05). The EB was slightly positive for all treatments and did not differ between groups (P>0.05). Data were also analyzed using only those cows which were in the trial for the entire duration of the trial of 169 day to check whether a long adaptation to CT influenced the animals’ response. Results were in accordance with results of the whole data set as there was no difference between groups (P>0.05) for the measured production variables except a lower milk urea concentration for CT3 (P<0.05) (data not shown).
Nitrogen data
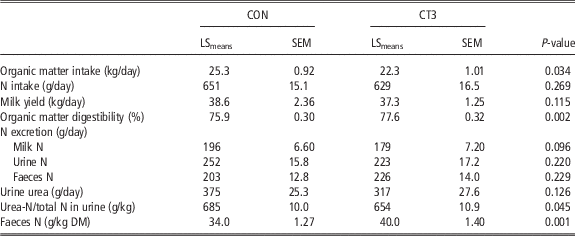
Data on N intake and excretion via milk, urine and faeces obtained from spot sampling of 10 cows of each group at the end of period 3 (CON and CT3) are presented in Table 4.
Variables of N use efficiencyFootnote 1 in cows from control (CON) and experimental group CT3 (3% condensed tannin extractFootnote 1 in ration dry matter (DM)) at day 53 of period 3 (n=10 per group)

1 Data on N excretion were estimated using spot samples of milk, urine and faeces, calculated daily amounts of urine and faeces and measured amounts of milk.
2 Acacia mearnsii tannin extract (Weibull Black, Tanac S.A., Montenegro, Brazil).
The estimated amount of N (g/day) excreted via urine and faeces was unaffected by treatment. However, there were minor changes in the N partitioning between urine and faeces. With CT3 cows showed a small shift of N excretion (g/kg DM) from urine to faeces. The N concentration in faeces was increased in EXP and on the other hand, urea-N was reduced (P<0.05). In addition, milk protein tended to be lower in EXP (P<0.10). For the other estimated variables on N excretion, there was no effect of treatment. Digestibility of OM estimated from faecal CP concentration was greater for CT3 (P<0.05).
Discussion
Feeding trial
In this study, production variables like DMI, milk and ECM yield of high-producing dairy cows were not affected by supplementation of a CT-containing plant extract. Similar results regarding milk yield were observed by Benchaar et al. (Reference Benchaar, McAllister and Chouinard2008) who fed CT from quebracho trees (6.4 g/kg DM) to lactating dairy cows. Different studies (Beauchemin et al., Reference Beauchemin, McGinn, Martinez and McAllister2007; Grainger et al., Reference Grainger, Clarke, Auldist, Beauchemin, McGinn, Waghorn and Eckard2009) have shown that dietary CT can impact negatively on DMI, but only at high levels (>55 g CT/kg DM) which were not reached in the present trial with dairy cows. The DMI of cows was high in both groups and unaffected by dietary CT inclusion. In contrast, Carulla et al. (Reference Carulla, Kreuzer, Machmüller and Hess2005) showed an increased DMI when an A. mearnsii extract (41 g/kg DM, containing 0.615 g CT/g DM) was fed to sheep. It shows that results on DMI and production are inconsistent, even when just focussing on dairy cows or effects of CT from A. mearnsii. Differences in structure and protein binding capacity impede a precise measurement of CT concentration in tannin-rich products. The chemical structure of tannins has rarely been studied intensively when used in feeding trials. However, it influences the binding capacity, the impact on digestion and feeding value of the rations. It is therefore difficult to get a defined relation between CT concentration and production responses. In this study, the concentration of CT (0.203 g/g DM) was much lower than claimed by the manufacturer. Potentially a higher dosage of the CT product or a product containing higher concentrations of CT would cause more pronounced results. Based on a meta-analysis by Jayanegara et al. (Reference Jayanegara, Leiber and Kreuzer2012) a reliable reduction in methane production is only achieved with CT concentrations >20 g/kg DM. Lower dosages generated very inconsistent results which underlines the inconsistency of this phenolic compound. Furthermore the ration that is supplemented with CT might also influence the functionality of the tannins. Waghorn (Reference Waghorn2008) summarized that the impact of CT upon ruminant performance will depend on the amount and astringency in the diet, animal nutrient requirements and other dietary components such that a direct relationship between CT in rations and animal performance does not exist.
The only production variables showing effects of CT addition were milk protein yield and urea concentration. The CT3 caused a slight, but significant reduction in milk protein yield and apparent N efficiency (defined as percentage of dietary N recovered in milk N), and a decrease in milk urea concentration in comparison with CON, indicating both reduced N availability in the rumen and amino acid supply to the duodenum. As summarized by Waghorn (Reference Waghorn2008) dietary CT usually increases plant CP flow to the intestine and reduces net absorption of ammonia from the rumen. Although CT may dissociate from protein as the pH declines below 3.5 in vitro, this does not necessarily mean that the protein will be digested and absorbed distal to the acidic abomasum (Waghorn, Reference Waghorn2008). This might explain the reduced milk protein yield and N use efficiency in CT3 via a decreased amino acid absorption and supply for milk protein synthesis. The variable showing the biggest difference between CON and EXP (CT3) was the milk urea concentration which was significantly decreased with CT supplementation, thereby indicating a reduced N supply in the rumen. The tannin–protein complex persisted post-ruminal degradation such that some was excreted with faeces. Frutos et al. (Reference Frutos, Hervas, Giráldez and Mantecón2004) suggested different explanations for decreased nutrient absorption from the intestine: persistence of tannin–protein complexes in the intestine which failed to dissociate in the abomasum, formation of tannin–digestive enzyme complexes or new tannin–dietary protein complexes, or changes in the intestinal absorption due to the interaction of tannins with intestinal mucosa.
Nitrogen excretion
At the end of period 3, 10 cows from both groups were sampled for urine and faeces to estimate N excretion. To a small extent, there was a shift from N excretion in urine to faeces which reduces N losses with highly volatile compounds. This shift in N excretion is consistently reported in literature (Orlandi et al., Reference Orlandi, Kozloski, Alves, Mesquita and Ávila2015) but often was more pronounced. For example, Grainger et al. (Reference Grainger, Clarke, Auldist, Beauchemin, McGinn, Waghorn and Eckard2009) observed a 45% to 59% reduction in urinary-N excretion, with 18% to 21% more N in the faeces when feeding 10.8 or 19.1 g CT/kg DM in rations of dairy cows. Also Misselbrook et al. (Reference Misselbrook, Powell, Broderick and Grabber2005) showed that dairy cows fed 35 g CT/kg DM excreted 25% less urinary-N, 60% more N in faeces and 8% more N in total in comparison with cows receiving 10 g CT/kg DM. Urea in urine is easily hydrolyzed to NH3 and afterwards nitrified to NO3, from which finally N2O can arise. In contrast, N compounds in faeces are less volatile and the potential for production of N2O is reduced. Furthermore, as summarized from literature by Eckard et al. (Reference Eckard, Grainger and de Klein2010), the CT–protein complex in faeces is more recalcitrant to breakdown in the soil, because mineralization of the complex is inhibited and the faeces decompose more slowly than faeces without CT. In a study by Carulla et al. (Reference Carulla, Kreuzer, Machmüller and Hess2005) sheep fed ryegrass supplemented with A. mearnsii CT (25 g/kg DM) showed a small decline in digestibility and a shift of energy and N excretion from urine to faeces, but, the growth rate of the animals was not affected. Methane emissions were reduced by 13% (Carulla et al., Reference Carulla, Kreuzer, Machmüller and Hess2005). As presented by Orlandi et al. (Reference Orlandi, Kozloski, Alves, Mesquita and Ávila2015) CT extract from A. mearnsii (9, 18 and 27 g/kg DM) linearly reduced the digestibility of N compounds as well as urinary N excretion and linearly increased faecal N excretion, N retention and the efficiency of N utilization by steers fed high-concentrate diets. The estimated reduction in N excreted in urine could also be observed in the long-term measurements of gaseous emissions conducted by Schmithausen (Reference Schmithausen2017). During period 3, supplementation of CT3 led to a significant decrease in NH3 emissions on barn level. Methane emissions, on the other hand, were not affected by CT supplementation which contradicts some studies in literature. As summarized by Eckard et al. (Reference Eckard, Grainger and de Klein2010) CT have shown to reduce methane production by 13% to 16% (DMI basis) mainly through a direct toxic effect on methanogens. However, the lack of an effect on methane emissions on experimental group level as described by Schmithausen (Reference Schmithausen2017) matches results of the feeding trial where cows did not show improved productivity or efficiency.
The equation for estimating OM digestibility (Lukas et al., Reference Lukas, Südekum, Rave, Friedel and Susenbeth2005) might not be applicable for rations supplemented with secondary plant compounds like CT. In contrast to a decrease in OM digestibility in response to CT supplementation (Kozloski et al., Reference Kozloski, Härter, Hentz, de Ávila, Orlandi and Stefanello2012; Staerfl et al., Reference Staerfl, Zeitz, Kreuzer and Soliva2012), the values obtained for the CT3 group showed a greater OM digestibility than CON. A positive impact of CT on OM digestibility is, to our knowledge, not presented in other studies. The positive relationship between faecal CP concentration and ration OM digestibility in cattle is based on increasing undigested microbial CP and decreasing faecal OM as OM digestibility increases (Lukas et al., Reference Lukas, Südekum, Rave, Friedel and Susenbeth2005). It does not consider dietary CP that is protected from digestion, therefore decreasing the CP and also the OM digestibility. The data set used for that equation did not comprise diets containing elevated levels of heat-damaged or overprotected undigested dietary CP (Lukas et al., Reference Lukas, Südekum, Rave, Friedel and Susenbeth2005).
Acknowledgements
This study was financially supported by Landwirtschaftliche Rentenbank (Z–20039/-7). The authors thank Claudia Verhülsdonk and the team of the Experimental and Educational Centre for Agriculture ‘Haus Riswick’ for excellent support of the feeding and digestibility trials and sample collection. Jun-Prof Dr Uta Dickhöfer (University of Hohenheim, Stuttgart) is acknowledged for determination of total phenol, total tannins and CT.
Declaration of interest
The authors have declared that no competing interests exist.
Ethics statement
Experimental work was conducted in accordance with relevant national legislation on the use of animals for research.
Software and data repository resources
None.