Electromigration (EM) is the diffusion of atoms, usually in the direction of electron flow, due to the transfer of momentum from electrons to atoms in the conductor line.Reference Huntington and Grone1 EM in Cu conductor lines has been widely studied due to the importance of Cu materials in the microelectronic industry.Reference Hau-Riege2–Reference Hu, Gignac, Liniger, Herbst, Rath, Chen, Kaldor, Simon and Tseng4 EM has caused the formation of voids and extrusions in the Cu conductor lines, leading to reliability concerns. However, direct measurement of EM-induced strains in the Cu conductor lines with line width in the range of micrometer or submicrometer levels is challenging with the traditional x-ray diffraction (XRD) techniques. Synchrotron microbeam XRD provides enough brightness to investigate strain evolution in Cu conductor lines during EM with spatial resolution of micrometer or submicrometer levels.Reference Cargill5, Reference Ice and Larson6 Strain evolution in Al conductor lines with line width at the micrometer level has been reported, and a strain gradient along the Al lines was found when the EM was in the steady-state stage.Reference Zhang, Cargill, Ge, Maniatty and Liu7, Reference Wang, Cargill, Noyan and Hu8 Valek et al.Reference Valek, Bravman, Tamura, MacDowell, Celestre, Padmore, Spolenak, Brown, Batterman and Patel9 found that plastic deformation and grain rotations occurred in sputtered Al (0.5 wt% Cu) conductor lines during EM. Similar behavior in Cu conductor lines is expected according to the EM model proposed by Blech.Reference Blech10 Budiman et al.Reference Budiman, Nix, Tamura, Valek, Gadre, Maiz and Patel11 used synchrotron white beam x-ray microdiffraction to study the evolution of Laue spots during EM in damascene Cu conductor lines. They found that EM-induced plastic deformation occurred before the formation of voids and hillocks in the Cu conductor lines. However, there have been no reports of direct x-ray measurements of strain evolution in Cu conductor lines during EM. In this study, we use synchrotron microbeam x-rays to investigate strain evolution of Cu conductor lines during EM.
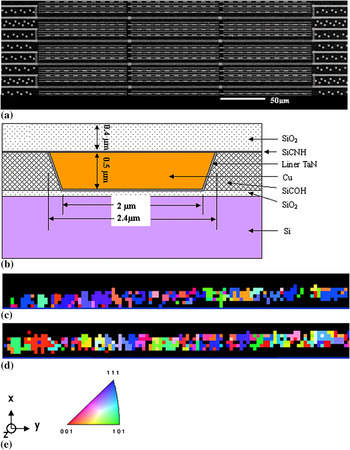
The Cu lines used in this study are 0.45 μm thick, 2 μm wide, and 100 μm long, with dielectric and liner materials. Figure 1(a) shows a scanning electron microscope (SEM) image of the Cu lines. The SiO2 cap layer is 0.4 μm thick. A schematic cross section of the Cu line is shown in Fig. 1(b). On the same chip, there are four identical sections of Cu lines, and each section contains three Cu lines in series. There are vias between each of the three Cu lines, which prevent atoms from diffusing in or out of the Cu lines during EM. One of the four sections, as shown in Fig. 1(a), is used for the EM test with current flowing during the x-ray strain measurement, and another one of the four sections, also shown in Fig. 1(a), is used as a control (CL) line without current flowing, to compare with the EM test line, which has the same fabrication and thermal history. Figures 1(c) and 1(d) show the out-of-plane grain orientation maps for the EM line and CL line. Both the EM and CL lines consist of multiple grains with near bamboo structures, but without fiber texture. Figure 1(e) shows the sample coordinates, with x across the line, y along the line, and z perpendicular to the line, and the legend for the orientation maps.
(a) SEM image of the Cu line sample, (b) schematic cross section of the Cu line sample, (c) out-of-plane orientation map for the EM line, (d) out-of-plane orientation map for the control line, and (e) sample coordinates and orientation legend.

X-ray microbeam diffraction measurements were made at the advanced photon source (APS) on beamline 34-ID. The x-ray microbeam size was about 0.5 μm. The sample surface was aligned to be about 45° with respect to the incident x-ray beam direction. By scanning the sample stage along and across each Cu line, strain mapping of the entire Cu line was obtained. The EM lines were stressed with a current of 2 mA, corresponding to current density of 2.2 × 10⁵ A/cm2, at a temperature of 270 °C. Two EM lines and two control lines designated EM1, EM2, CL1, and CL2 were used in the x-ray strain measurements. White beam x-rays were used to obtain Laue diffraction patterns from individual grains within the Cu lines. By indexing the Laue diffraction patterns,Reference Ice and Larson6, Reference Chung and Ice12 the deviatoric strain tensors were obtained. Only strains in three principle directions x, y, and z were studied. Strains with positive signs are tensile and strains with negative signs are compressive.
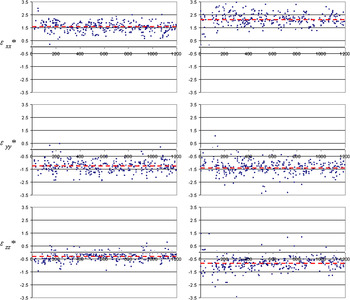
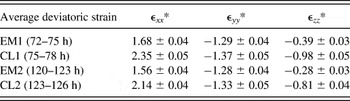
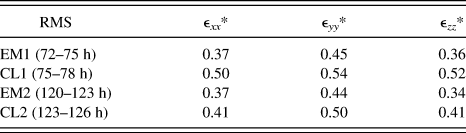
Each strain mapping for one Cu line takes about 3 h. The first strain mapping was made on an EM line, EM1, and a control line, CL1. The EM1 mapping was after the Cu line had been stressed with current for 72 h. After the EM1 mapping was completed at 75 h, the control line CL1 strain mapping was immediately begun, to minimize thermal relaxation. A second strain mapping was then made on EM2 and CL2. The EM2 mapping was begun after the Cu line had been stressed with current for 120 h, immediately followed by CL2 mapping at 123 h. The results of the EM2 and CL2 measurements are shown in Fig. 2. No strain gradient was found in the EM2 line after the current had been flowing for 120 h, or was a strain gradient found in EM1 after it had been stressed with current for 72 h. The average strains for the EM lines and control lines were compared, and they are listed in Table I. There is a significant drop of strain level in the EM lines compared with the control lines. EM in the Cu lines has caused strain relaxation. From Fig. 2, the strain distribution in the EM2 line is narrower than in the CL2 line. To compare the strain distribution in the EM lines and control lines, the root mean square (rms) distribution widths of the strains for both the EM lines and control lines are listed in Table II. There is a significant drop in the rms values in the EM lines compared with the control lines. EM not only reduced the average strains in the Cu lines, but also caused the strains to become more uniform.
(a) Deviatoric strains in EM2 line after 120 h of current stressing at 270 °C. (b) CL2 line after 123 h at 270 °C. The horizontal dashed lines show the average values. The horizontal axis of the figure shows the x-ray measurement sequence, which corresponds to distance along the Cu line, with electron flowing from the right to left side. Strains are given in units of 10−3.

Averaged deviatoric strains in EM lines EM1 and EM2 and in control lines CL1 and CL2, given in units of 10−3.

Note:
The errors of the average deviatoric strains are estimated at 90% confidence level,Reference Kreyszig13 assuming the measured values obey a normal distribution.
Root mean square deviations of the deviatoric strains of EM lines and CL lines, given in units of 10−3.

Comparing CL2 to CL1, there is a small drop in the average strains, which could be attributed to thermal relaxation, because the measurements on the CL2 line were made about 48 h after those on the CL1 line, during which both lines had been held at 270 °C. A similar small drop in the average strains is found when comparing EM2 to EM1. This could also be caused by the thermal relaxation during the 48 h time interval between the measurements on EM1 and EM2, or could result from the further period of current flow for EM2.
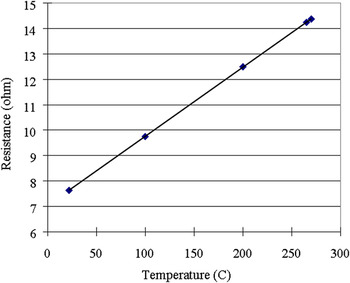
Because the current not only induces EM, but also can cause Joule heating, it is important to understand whether the strain relaxation observed in the EM lines might be caused by the thermal relaxation from the Joule heating of the EM lines. To determine the temperature difference between the EM lines and control lines caused by Joule heating in the EM lines, the resistance of the EM lines was measured at different temperatures using a very small current with negligible Joule heating. The result is shown in Fig. 3. During EM at 270 °C with a current of 2 mA for the 120 h, the resistance of the Cu lines stabilized at 14.43 ohm. By fitting the curve in Fig. 3, one can deduce that the temperature of the Cu line during EM is about 272 °C. Because there is no current in the control line, the temperature of the control lines should be the same as the furnace temperature of 270 °C. The temperature difference of 2 °C between EM lines and control lines could not cause the observed strain relaxation, because there is only a very small difference of Cu diffusion coefficient between 270 and 272 °C. Therefore, we conclude that EM is the dominant cause of strain relaxation in the Cu lines.
Resistance of a conductor line at different temperatures, tested at low current with insignificant Joule heating.

Conrad and SprecherReference Conrad, Sprecher and Nabarro14 have studied the effect of electrical current on several bulk metals during plastic deformation. They used current pulses of 100 μs to minimize the Joule heating. With current flowing, the strain rate increased; the higher the current density, the higher was the strain rate. They attributed this effect to the interaction between drift electrons and dislocations in the metals. Vdovin and KasumovReference Vdovin and Kasumov15 used in situ transmission electron microscopy to study the effect of electrical current on the movement of dislocations in an ultrapure Cu single crystal at room temperature. They showed that a threshold-current density of ~107 A/cm2 produced movement of dislocations in their sample.
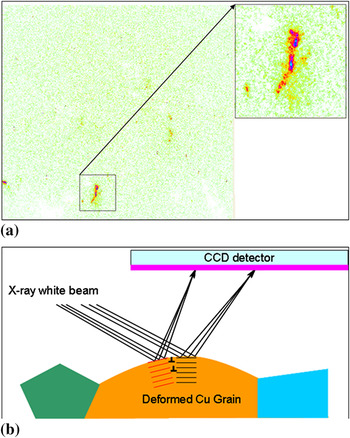
EM-induced strain relaxation and strain homogenization in the Cu conductor lines can also be attributed to the interaction of electrons with dislocations and other defects in the Cu lines. Figure 4(a) shows one of the Laue diffraction peaks from the EM line at 270 °C before EM. The diffraction peak is distorted and separated into two spots. The two separated and distorted spots may be diffraction peaks from two subgrains formed from a single grain. Figure 4(b) schematically shows how dislocations in the Cu line form a subgrain boundary and cause splitting of the diffraction peaks. When the sample was heated to 270 °C, plastic deformation occurred due to large thermal strain, more dislocations are introduced, and some single grains split into two or more subgrains. According to Blech’s model,Reference Huntington and Grone1 EM-induced atomic flux is expected to be proportional to the electrical resistivity of the conductor line. The resistivity of metals or alloys can be expressed as a sum of various contributions, as a generalization of Matthiessen’s rule,

(a) Part of a Laue pattern for the EM line before EM at 270 °C and (b) schematic plot showing how dislocations form subgrains and split Laue peaks.

where ρ is the electrical resistivity, ρ(T), ρ(im), ρ(E), and ρ(O) represent the contributions to electrical resistivity from thermal vibrations, impurities, strains (from dislocations or other defects), and all others factors.Reference Callister16 The strain distribution in the Cu lines varies from grain to grain; this may be due to the elastic and plastic anisotropy of Cu and the differences in size and orientation of different grains. Even at different locations within a single grain, the strains may vary from one place to another, reported for polycrystalline Al films by Moyer et al.Reference Moyer, Cargill, Yang, Larson, Ice, Corcoran, Joo, Moody and Suo17 Therefore, the local resistivity may also vary from grain to grain and at different locations in a single grain. When current is flowing in the conductor line, the EM-induced atomic diffusion is not uniform along the Cu conductor lines. At locations with higher strains or dislocation density and thus higher resistivity, the electrons will be scattered more strongly than in other regions with lower strains, which causes the regions with higher strains to undergo more rapid EM-induced strain relaxation. This EM-induced strain relaxation may happen at an early stage of EM of Cu conductor lines. After the strain homogenization, and with more and more atoms being removed from the cathode end and deposited at the anode end during EM, compressive strain may start to build up at the anode end and a strain gradient would then be observed along the Cu conductor line. A strain gradient extending along the length of the conductor line is expected after the EM has reached a steady state.Reference Huntington and Grone1 However, because there are many factors such as current density, temperature, grain microstructure, line geometry, mechanical properties of the dielectric materials, liner materials, and passivation layer materials that could affect the atomic flux during EM, it is a challenge to predict the magnitude of strain gradients and the time required to reach the steady-state stage. Although the current had been flowing in the Cu EM lines for more than 120 h in our study, the EM may be still at the early stage, with no significant strain gradient yet formed along the line. Another possibility is the current density used in this study may not be high enough to form a significant strain gradient, but it is high enough for the electrons to interact with high strained areas in the Cu lines to cause strain relaxation and strain homogenization.
Strain evolution in Cu conductor lines during EM remains of great interest to the microelectronic industry. Future research is needed on strain relaxation and strain gradient development in Cu conductor lines, such as their dependence on time, temperature, current density, line geometry, and Cu line processing.
ACKNOWLEDGMENTS
The authors of this study thank Dr. C-K. Hu at the IBM T.J. Watson Research Center for useful guidance and for providing the Cu conductor line samples. Dr. W. Liu from Argonne National Laboratory provided valuable assistance with the synchrotron x-ray microdiffraction measurements and data analysis.