


Introduction
Sugarcane is a member of the grass family Gramineae, tribe Andropogoneae and genus Saccharum. The genus Saccharum contains six species, namely Saccharum officinarum Linnaeus (2n = 80), Saccharum spontaneum Linnaeus (2n = 40–128), Saccharum barberi Jeswiet (2n = 81–124), Saccharum sinense Roxb. (2n = 111–120), Saccharum robustum Brandes and Jeswiet ex Grassl (2n = 60–80) and Saccharum edule Hassk. (2n = 60, 70, 80; Brandes, Reference Brandes, Artschwager and Brandes1958). This classification, however, has been adjusted several times. According to Irvine (Reference Irvine1999), only the two wild species (S. spontaneum and S. robustum) deserve species status, whereas the cultivated species (S. officinarum, S. barberi, S. sinense and S. edule) should be designated as horticultural classes. S. officinarum is thought to have been domesticated from the 2n = 80 form of S. robustum (Artschwager and Brandes, Reference Artschwager and Brandes1958); S. barberi and S. sinense are believed to have originated from natural hybridization events between S. officinarum and S. spontaneum (Daniels and Roach, Reference Daniels, Roach and Heinz1987); S. edule, characterized by its abortive flowers, is thought to have arisen from intergeneric crosses between S. officinarum or S. robustum and a related genus (e.g. Mischantus) or derived from S. robustum (Williams et al., Reference Williams, Harborne and Smith1974; Daniels and Roach, Reference Daniels, Roach and Heinz1987; Irvine, Reference Irvine1999; Amalraj and Balasundaram, Reference Amalraj and Balasundaram2006). These Saccharum species (excluding S. edule) together with other closely related interbreeding genera [e.g. Erianthus (sect. Ripidium), Narenga, Sclerostachya and Miscanthus (sect. Diandra Keng)] have been designated as the Saccharum complex (Mukherjee, Reference Mukherjee1957; Daniels et al., Reference Daniels, Smith, Paton and Williams1975). The Saccharum complex is postulated to have been derived from a series of polyploidization and hybridization events and represents the shared gene pool from which modern sugarcane is derived (Daniels and Roach, Reference Daniels, Roach and Heinz1987; Sobral et al., Reference Sobral, Braga, LaHood and Keim1994).
Modern sugarcane cultivars are interspecific hybrids derived by crossing the previously cultivated S. officinarum with the wild S. spontaneum species (Price, Reference Price1963; Stevenson, Reference Stevenson1965) to respond to diseases that affected sugar production in commercial fields. In a process coined ‘nobilization’, genes for stress and ratooning ability were introgressed from S. spontaneum into the cultivated background followed by a few backcrosses to recover the sucrose genes from the female S. officinarum parent (Price, Reference Price1965; Roach, Reference Roach1986; Sreenivasan et al., Reference Sreenivasan, Ahloowalia, Heinz and Heinz1987). Only a few clones were involved in the original ‘nobilization’ events, and modern cultivars are mostly multigenerational descendants of the original backcross populations, which makes the genetic base of cultivated sugarcane very narrow (Arceneaux, Reference Arceneaux1967; Berding and Roach, Reference Berding, Roach and Heinz1987).
Continued exploitation of the wild relatives of cultivated sugarcane is essential to tackle current challenges of further improving sucrose content and general adaptability and to take advantage of new opportunities (e.g. use of sugarcane as a feedstock for renewable energy). With phenotypic traits being strongly influenced by environmental conditions, molecular markers are more suited to study genetic relationships and diversity among wild and cultivated germplasm and to monitor and ascertain the presence or absence of specific alleles linked to traits of interest during introgression.
Sequence-related amplified polymorphism (SRAP) is amolecular marker technique that has been employed in genetic diversity and phylogenetic studies of crop species including Brassica napus L. (Riaz et al., Reference Riaz, Li, Quresh, Swatt and Quiros2001), Cucurbita maxima Duchesne (Ferriol et al., Reference Ferriol, Pico and Nuez2003a), C. pepo L. (Ferriol et al., Reference Ferriol, Picó and Nuez2003b), C. moschata (Ferriol et al., Reference Ferriol, Picó, Córdova and Nuez2004) and buffalo grass (Buchloë dactyloides Nutt.; Budak et al., Reference Budak, Shearman, Parmaksiz, Gaussoin, Riordan and Dweikat2004) but not sugarcane. SRAP markers have shown a great affinity to amplify gene-rich regions of the Brassica genome (Li and Quiros, Reference Li and Quiros2001). The objective of this study was to evaluate the potential of SRAP markers for assessing genetic relationships and diversity in sugarcane germplasm collections.
Material and methods
Plant materials and DNA extraction
Genotypes representing five Saccharum species (namely S. officinarum, S. barberi, S. sinense, S. spontaneum and S. robustum), as well as cultivars, cultivar-derived mutants and F1 interspecific hybrids, were used in this study (Table 1). Two clones (each of Miscanthus and Erianthus) were used as outgroups. As a baseline study, the genotypes were chosen to include some wild clones (SES 147, Coimbatore and La Purple) and very early hybrids (e.g. POJ 2878) used as progenitors of US sugarcane cultivars, and different generation cultivars (the CP, LCP and HoCP). The genotypes Dwarf1 and Dwarf2 are genetic mutants derived from spontaneous mutations in the cultivar LCP 81-137 (Burner, Reference Burner1999). The 16 Low and 40 High are F1 interspecific hybrids from a cross between La Striped (S. officinarum) × SES 147 (S. spontaneum) with low and high sucrose content, respectively. The genotypes Dwarf1, Dwarf2, 16 Low and 40 High were included in the study as checks. These 30 genotypes make up part of the sugarcane working germplasm collection maintained at the USDA Sugarcane Research Unit at Houma, Louisiana and have been used in various genotyping studies (Alwala et al., Reference Alwala, Suman, Arro, Veremis and Kimbeng2006; Arro et al., Reference Arro, Veremis, Kimbeng and Botanga2006).
Description of 30 genotypes of the Saccharum complex (made up of five Saccharum species and related genera) used in a sequence-related amplified polymorphism (SRAP) marker analysis
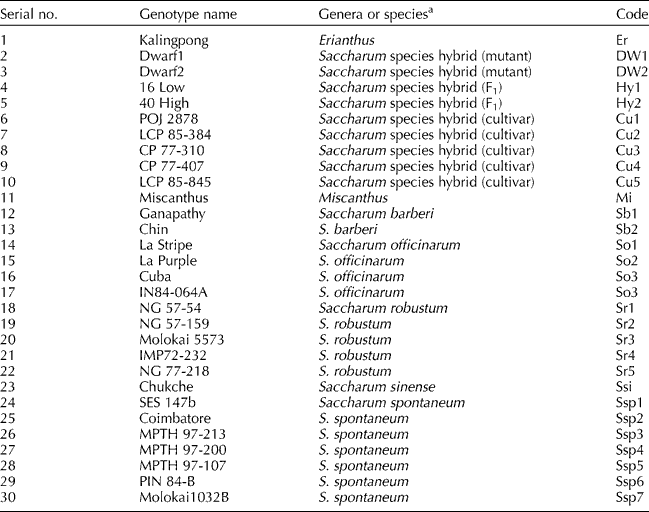
a Original sugarcane cultivars (e.g. POJ 2878) were derived from crossing mainly between S. officinarum and S. spontaneum followed by several generations of backcrosses to S. officinarum. Present-day cultivars are selections derived from cultivar × cultivar crosses.
Young leaves were collected from each genotype, frozen immediately in ice and stored at − 80°C. The leaves were later ground to a powder in liquid nitrogen. Genomic DNA was extracted using the Plant DNeasy Mini Kit (Qiagen, Valencia, CA) following the manufacturer's protocol. Concentrations of extracted DNA were estimated in 1.5% agarose gel, in comparison with a known concentration of lambda DNA. Working DNA samples were prepared at 50–80 ng/μl for PCR amplification.
SRAP analysis
Thirty-one SRAP primer combinations based on four forward and eight reverse primers were used to amplify the 30 genotypes (Supplementary Table 1, available online only at http://journals.cambridge.org). The reverse primers were 5′end labelled with IRDye 700 and 800 (MWG Biotech AG, Germany). The PCRs were performed as described by Ferriol et al. (Reference Ferriol, Picó and Nuez2003b) with some modifications. Briefly, PCR was performed in 10 μl reaction volume containing 0.75 μl of 1 μM each of forward primer and reverse primer, 1 μl of 25 mM MgCl2, 1 μl of 10 × PCR buffer, 1 μl of 2.5 mM dNTPs (Promega, Madison, WI), 0.2 μl of 5 U Taq DNA polymerase (Promega) and 1–1.5 μl of 50–80 ng of genomic DNA. The thermal cycler profile for PCR amplification was set on an i-cycler (BioRad Labs, Hercules, CA) as follows: denaturation at 94°C for 4 min, followed by five cycles of denaturing at 94°C for 1 min, annealing temperature at 35°C for 1 min and elongation at 72°C for 1 min. In the remaining 30 cycles, the annealing temperature was increased to 50°C for 1 min with a final elongation step at 72°C for 7 min (Ferriol et al., Reference Ferriol, Picó and Nuez2003b). The amplified fragments were separated on 6.5% polyacrylamide gels using the Li-Cor 4300 Global DNA sequencer (Li-Cor, Lincoln, NE). Digital images of the gel were saved onto a computer and scored manually.
Data analysis
Digital images were scored as ‘1’ for presence and ‘0’ for absence of clear and unambiguous DNA fragments. The polymorphism information content (PIC) for each primer combination was determined by averaging the allele frequency over all loci using the formula:  , where f i is the frequency of the ith allele (Weir, Reference Weir1990). Genetic similarity (GSij) was calculated for each pair of genotypes using Nei and Li's (Reference Nei and Li1979; Dice) similarity index. This index ignores 0–0 matches in the pairwise comparisons. The GSij values were used to compute genetic distances (D ij) based on the formula
 . The genetic distance matrix was subjected to cluster analysis using the unweighted pairgroup method with arithmetic mean (UPGMA) in NTSYS-pc version 2.1 (Rohlf, Reference Rohlf2000). The goodness of fit between clusters in the dendrogram and the similarity index was tested by computing the cophenetic values using the COPH and MXCOMP procedures in NTSYS-pc version 2.1. For a comparison and to verify the robustness of the clusters, a bootstrap analysis with 10,000 replications was performed using PAUP version 4.0b (Swofford, Reference Swofford2002). The genetic distance matrix was also subjected to a non-metric multidimensional scaling (NMDS) analysis using PROC MDS in SAS version 8.2 (SAS Institute, 2004) with the ORDINAL option to highlight the resolving power of the ordination. A Shepard's plot was generated to assess the goodness of fit of the NMDS plot to the distance matrix.
Sequencing of SRAP-derived DNA fragments
Some of the SRAP-derived DNA fragments of a S. officinarum (La Striped) and S. spontaneum (SES 147b) genotype amplified with SF1/T3, SF2/T3 and SF3/T3 primer combinations were excised from a silver-stained polyacrylamide gel electrophoresis gel. The DNA fragments were re-amplified with the corresponding primer sequences and both monomorphic and polymorphic fragments were sequenced directly without cloning. The sequences obtained were compared against expressed sequence tag (EST) sequences available in The Institute for Genomic Research (TIGR) database web site (http://www.tigr.org/) using the BLASTn search algorithm. Monomorphic fragments were compared for homology using the ClustalW2 algorithm found at the European Bioinformatic Institute web site (http://www.ebi.ac.uk/).
Results
SRAP marker profile, polymorphism and PIC values
Distinct DNA profiles were produced on all 30 genotypes by each of the 31 SRAP primer combinations with fragments ranging in size from 50 to 700 bp. A total of 1364 such DNA fragments were produced, with individual primer combinations amplifying from 18 (SF4/T8) to 92 (SF4/T2) for an average of 44 fragments (Supplementary Table 2, available online only at http://journals.cambridge.org). A total of 1135 fragments (83%) were polymorphic, with 17 (SF4/T8) to 84 (SF4/T2) polymorphic fragments produced per primer combination for an average of 37 polymorphic fragments. The overall per cent polymorphism was generally high and comparable to that reported from AFLP analyses of sugarcane germplasm (Besse et al., Reference Besse, Taylor, Carroll, Berding, Burner and McIntyre1998; Arro et al., Reference Arro, Veremis, Kimbeng and Botanga2006; Selvi et al., Reference Selvi, Nair, Noyer, Singh, Balasundaram, Bansal, Koundal and Mohapatra2006). However, fewer fragments (44) were amplified with SRAP than with AFLP (about 110 fragments) on average.
The PIC value is often used to measure the informativeness of a genetic marker system (Vuylsteke et al., Reference Vuylsteke, Mank, Brugmans, Stam and Kuiper2000) and the theoretical maximum PIC value for a dominant marker is 0.5. In this study, PIC values varied among SRAP primer combinations, ranging from 0.16 (SF1/T7) to 0.32 (SF2/T5) with an average of 0.22. These values are comparable to those previously reported in a related study using TRAP markers (Alwala et al., Reference Alwala, Suman, Arro, Veremis and Kimbeng2006).
Genetic diversity and relationships among genotypes
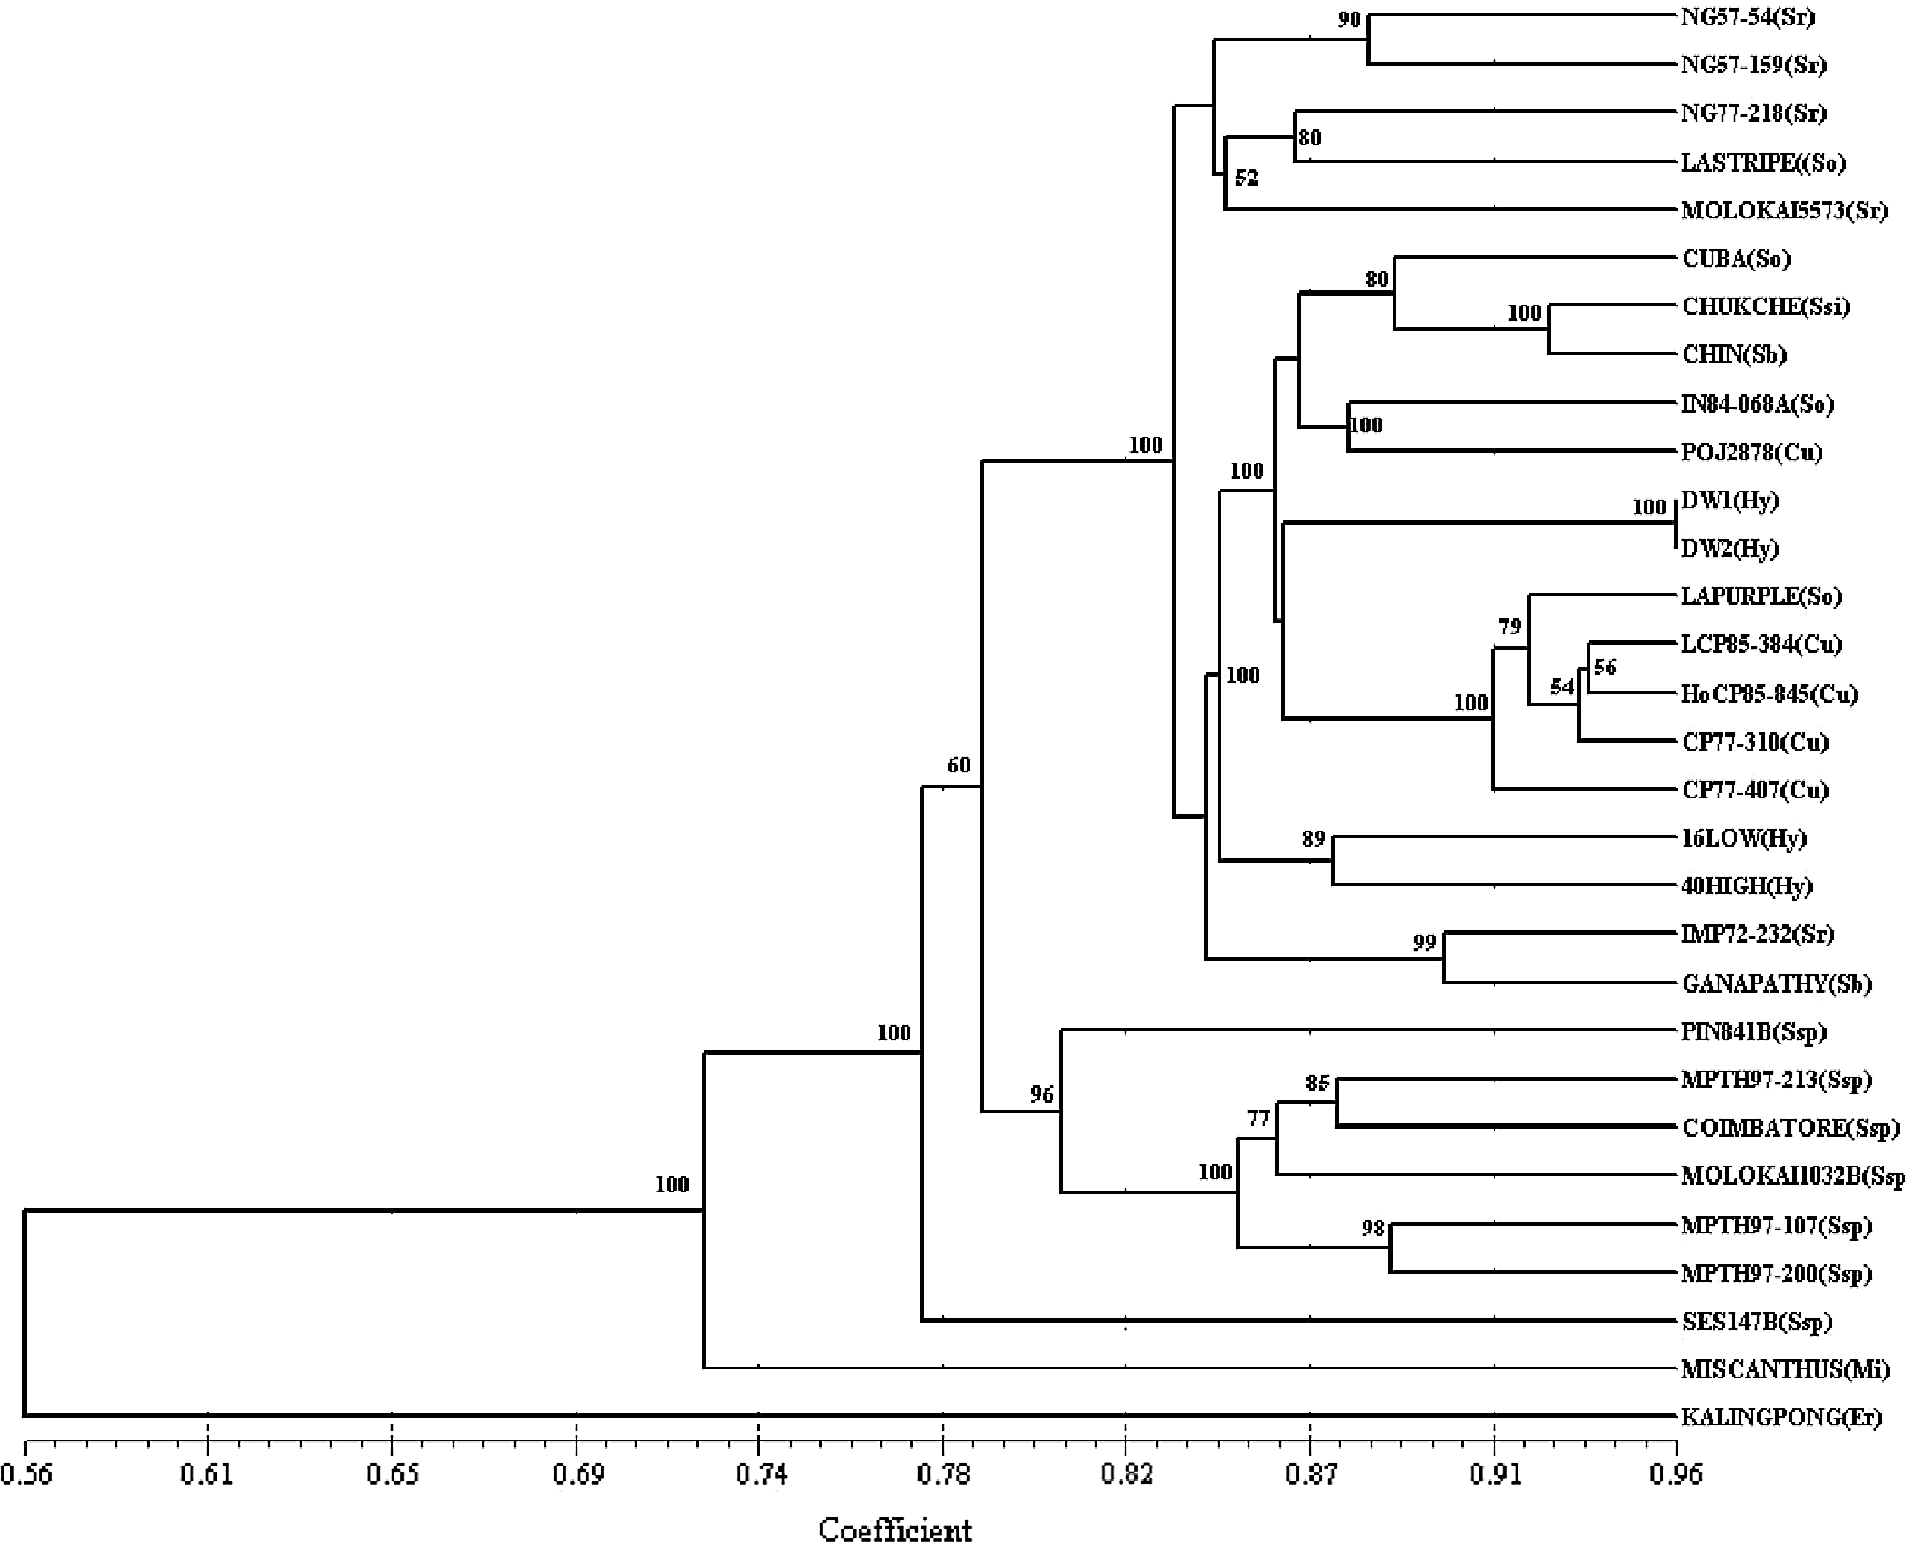
Cluster analysis and NMDS were used to assess the genetic diversity and relationships among the genotypes used in this study. Two major clusters, supported by high bootstrap values (>96%), were identified and included 27 out of the 30 genotypes (Fig. 1). The other three genotypes [SES 147b (S. spontaneum), Miscanthus and Kalingpong (Erianthus)] made three single-clone clusters that joined the two major clusters at GS levels of 0.78, 0.72 and 0.56, respectively, with branches supported by high bootstrap values. The S. officinarum, S. sinense, S. barberi and S. robustum clones, along with the cultivar-derived mutants and hybrids, were included in cluster I. All the S. spontaneum genotypes were grouped in cluster II, except SES 147b (Ssp1) which was found to be distinct. At the 0.84 similarity level, cluster I was divided into five subgroups. La Striped clustered closer to a group of S. robustum clones having GS values ranging from 0.85 to 0.88. A mixed subgroup of S. officinarum, S. sinense, S. barberi and POJ 2878 was formed at GS values ranging from 0.88 to 0.93. The two dwarf genotypes shared the closest relationship (GS = 0.96) in the study and were joined to a tight subgroup formed by cultivars and La Purple with GS values ranging from 0.92 to 0.94. The two F1 hybrids (16 Low and 40 High) between La Striped and SES147b with a GS = 0.88 were closer to each other than to any of the studied genotypes and were quite distant from their parents. In general, the high (>0.80) cophenetic correlation value of 0.92 and the strong bootstrap support for branches in the dendrogram indicate that the UPGMA clustering in this study represented a good fit to the distance matrix.
UPGMA dendrogram showing relationships among 30 genotypes of the Saccharum complex, represented by Erianthus, Miscanthus, five Saccharum species, and cultivars. So = S. officinarum; Sr = S. robustum; Ssp = S. spontaneum; Sb = S. barberi; Ssi = S. sinense; Cu = cultivars; DW = dwarf genetic mutants derived from the cultivar LCP 81-137; Hy = low and high-sucrose hybrids derived from a cross between La Stripe (S. officinarum) × SES 147b (S. spontaneum).
Non-metric multidimensional scaling
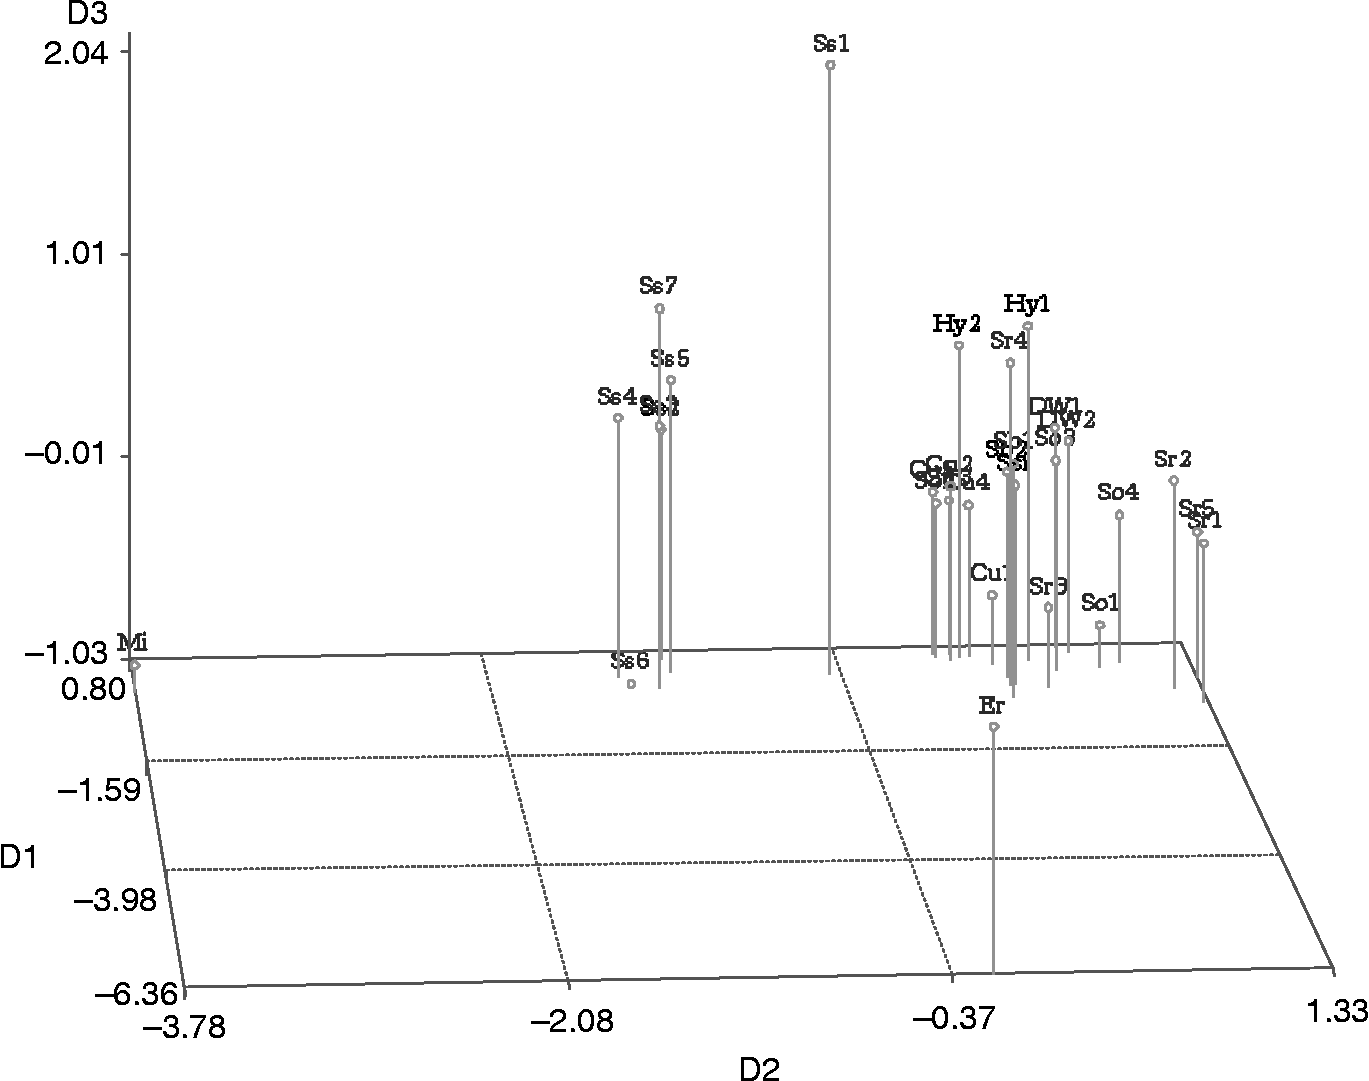
The genetic distance matrix was also analysed using the NMDS method based on three dimensions. The stress value for the three axes was 0.09, which explained 91% of the variation among the genotypes. In the three-dimensional plot (Fig. 2) generated, the position of the genotypes was found to be consistent with the grouping pattern of the UPGMA clustering. The first and third axes separated the Erianthus (Kalingpong) and S. spontaneum clones (SES 147b) from the other genotypes, respectively; the second axis separated the Miscanthus and S. spontaneum clones from the group of hybrids, cultivars, S. sinense, S. barberi, S. robustum and S. officinarum clones. The Shepard's plot (Supplementary Fig. 1, available online only at http://journals.cambridge.org) indicated that the NMDS plot represented an excellent fit to the distance matrix.
A non-metric multidimensional scaling plot for 30 genotypes of the Saccharum complex based on the SRAP markers.
Mean genetic distance between Saccharum spp
Based on the genotypes included in this study, S. officinarum, S. spontaneum and S. robustum had the same level of intra-species GS, with GS values around 0.74, 0.70 and 0.73, respectively (Table 2). The highest GS (83%) was observed within cultivars. As groups, the S. officinarum, S. robustum and cultivars were more similar among themselves than to the S. spontaneum group. On the other hand, S. spontaneum shared the least GS with S. robustum (0.62) and S. officinarum (0.64).
Mean genetic similarity (GS) estimates within and between Saccharum species and cultivars based on the SRAP marker analysis
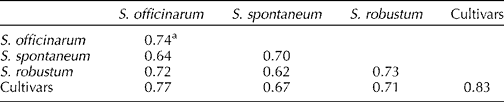
a Estimated as per the Dice coefficient (Nei and Li, Reference Nei and Li1979).
Species-specific markers
Of the 1364 amplified SRAP fragments, 119 (8.7%) were either genus or species specific when considering the four S. officinarum, five S. robustum and seven S. spontaneum clones included in this study (Supplementary Table 3, available online only at http://journals.cambridge.org). Markers that were present in at least two genotypes of a species and completely absent in other species were regarded as species specific (Jannoo et al., Reference Jannoo, Grivet, Seguin, Paulet, Domaingue, Rao, Dookun, d'Hont and Glaszmann1999). Only three primer combinations (SF2/T4, SF3/T7 and SF4/T8) did not amplify bands unique to any of the Saccharum species. Fifteen bands were found to be specific to S. officinarum or S. robustum, whereas 89 markers differentiated the S. spontaneum clones from the other species. The primer combination SF3/T1 yielded the highest number of unique bands across all three species within a size range of 300–500 bp. The three primer combinations (viz. SF1/T3, SF2/T1 and SF4/T2) amplified from eight to ten unique bands in the S. spontaneum clones. On the other hand, S. robustum was identified with a total of 15 species-specific markers with band sizes ranging from 300 to 400 bp.
The SRAP fingerprinting data of cultivars were compared with those of S. officinarum and S. spontaneum to determine the genomic contribution of these progenitor species to modern cultivars. Species-specific markers in S. officinarum and S. spontaneum were traced for their presence and absence in the modern cultivars. Among the markers traced in the cultivars, 98 (71.5%) were inherited from S. officinarum and 39 (28.5%) from S. spontaneum.
Sequencing of SRAP-derived fragments
Sequences were obtained for seven monomorphic and four polymorphic fragments with sizes ranging from 99 to 184 bp (Supplementary Table 4, available online only at http://journals.cambridge.org). The GC content of the sequenced SRAP fragments was high ranging from 41 to 58%. The per cent homology among the monomorphic fragments following alignment with ClustalW2 ranged from 76 to 83%. Although not ideal, this is high considering the large genome size of sugarcane and the ability of the dominant SRAP markers to produce co-migrating fragments from different regions of the genome. Additional steps in purifying and cloning before sequencing would be necessary to achieve sequences with a high level of fidelity.
For monomorphic fragments, the BLASTn search was conducted using only one of the two sequences taken from a portion displaying the most homology following alignment. BLASTn search of the TIGR EST database (http://www.tigr.org/) revealed homology with EST sequences of rice (Oryza sativa), maize (Zea mays) and S. officinarum. A monomorphic fragment of 163 bp amplified by SF3+T3 showed high homology with S. officinarum (84%, E = 8.6 × 10− 18) and O. sativa (68%, E = 1.2) ESTs in TIGR. The O. sativa EST was found to be similar to a plastid division protein (FtsZ) of Arabidopsis thaliana, and a Blastx search of the NCBI database (http://www.ncbi.nlm.nih.gov/) using the O. sativa EST sequence revealed high homology (65%, E = 2 × 10− 19) with the protein. Similarly, a polymorphic fragment of 148 bp amplified by SF1+T3 in S. spontaneum showed high homology with S. officinarum (93%, E = 4.1 × 10− 22) and Z. mays (61%, E = 5.1) ESTs in TIGR. The Z. mays EST has been tentatively annotated to a response regulator receiver which is a transcriptional regulatory protein.
Discussion
While various molecular marker techniques have been used to characterize sugarcane germplasm, this study is the first one to evaluate the potential of SRAP markers at inferring genetic diversity within and among Saccharum and related genera. The SRAP technique, by amplifying both intronic and exonic regions of the genome, has the potential to reveal valuable markers to use in plant breeding. High levels of polymorphism were detected with an average PIC value of 0.22 and an average number of 37 polymorphic fragments per primer pair. This generated more than enough polymorphism (1135 out of 1364) to discriminate each of the 30 genotypes under study (Dudley, Reference Dudley1994) and makes SRAP very comparable to the AFLP technique at amplifying the Saccharum genome.
The levels of polymorphism revealed a relatively low to moderate amount of intra- and intergenetic variability among this group of 30 genotypes. Very close relationships exist among them with GS values ranging from 0.60 to 0.96. The two major clusters illustrated in the dendrogram were connected at a similarity level of 0.79 with GS values ranging from 0.80 to 0.96. As expected, the closest relationships were detected among the group of cultivars, F1 interspecific hybrids and La Purple. These cultivars represent different generations of a recurrent selection programme and La Purple is one S. officinarum clone that was used repeatedly in the parentage of cultivars released in both the Florida and Louisiana industries (Deren, Reference Deren1995).
Despite such close relationships, the SRAP system was effective at discriminating the genotypes according to the accepted lineages among members of the Saccharum complex. The Erianthus and Miscanthus clones appeared as two outgroups in the dendrogram, sharing GS values of 0.40 and 0.57, respectively, with the two major clusters. This result supports the classification of Erianthus and Miscanthus as separate genera, but would indicate some evolutionary relationship to the Saccharum species (Daniels et al., Reference Daniels, Smith, Paton and Williams1975). The S. spontaneum clones formed a very distinct and more diverse cluster, which is supported by previous research using isozyme analysis (Glaszmann et al., Reference Glaszmann, Noyer, Fautret, Feldmann and Lanaud1989), RAPD markers (Nair et al., Reference Nair, Nair, Sreenivasan and Mohan1999), SSR markers (Selvi et al., Reference Selvi, Nair, Balasundaram and Mohapatra2003), comparative chloroplast genome analysis (Takahashi et al., Reference Takahashi, Furukawa, Asano, Terajima, Shimada, Sugimoto and Kadowaki2005) and TRAP markers (Alwala et al., Reference Alwala, Suman, Arro, Veremis and Kimbeng2006). S. spontaneum is a progenitor of modern sugarcane and it is characterized by a large intraspecific diversity in terms of morphology, species distribution and chromosome number (Guimaraes and Sobral, Reference Guimaraes, Sobral and Janick1998).
The SRAP fingerprinting differentiated S. robustum from the other genotypes; however, a tight relationship seems to exist between some S. officinarum and S. robustum genotypes. Saccharum officinarum is believed to be a cultivated form of S. robustum, and morphological, cytological and molecular studies have revealed considerable similarities between S. robustum and S. officinarum, in spite of differences in sugar and fibre content (Nair et al., Reference Nair, Nair, Sreenivasan and Mohan1999; Irvine, Reference Irvine1999; Selvi et al., Reference Selvi, Nair, Balasundaram and Mohapatra2003; Takahashi et al., Reference Takahashi, Furukawa, Asano, Terajima, Shimada, Sugimoto and Kadowaki2005; Alwala et al., Reference Alwala, Suman, Arro, Veremis and Kimbeng2006). In this study, the S. robustum clones clustered closer to S. officinarum than to S. spontaneum. The dendrogram also revealed that there are differences within the S. officinarum, S. robustum and S. barberi clones. Aitken et al. (Reference Aitken, Li, Jackson, Piperidis and McIntyre2006) in an AFLP review of the S. officinarum germplasm, found great diversity within this species. S. sinense and S. barberi appeared together in the group, suggesting a significantly close relationship (0.93) between these species. S. barberi and S. sinense are thought to be interspecific hybrids between S. officinarum and S. spontaneum (Daniels and Roach, Reference Daniels, Roach and Heinz1987), and this has been substantiated in sugarcane using evidence from studies based on chromosome number (Price, Reference Price1965), RFLP markers (Lu et al., Reference Lu, d'Hont, Walker and Rao1994), RAPD markers (Nair et al., Reference Nair, Nair, Sreenivasan and Mohan1999), maize-derived microsatellite markers (Selvi et al., Reference Selvi, Nair, Balasundaram and Mohapatra2003), comparative chloroplast genome analysis (Takahashi et al., Reference Takahashi, Furukawa, Asano, Terajima, Shimada, Sugimoto and Kadowaki2005) and TRAP markers (Alwala et al., Reference Alwala, Suman, Arro, Veremis and Kimbeng2006).
Modern sugarcane cultivars originated from crossing the S. officinarum ‘noble’ clones with S. spontaneum, followed by a few backcrosses to S. officinarum. During this ‘nobilization’, the 2n somatic chromosome number of S. officinarum was transferred to the progeny (Bremer, Reference Bremer1961; Bhat and Gill, Reference Bhat and Gill1985; Sreenivasan et al., Reference Sreenivasan, Ahloowalia, Heinz and Heinz1987; d'Hont et al., Reference Sreenivasan, Ahloowalia, Heinz and Heinz1996). It resulted from this process that cultivars share a greater portion of their genome with S. officinarum than with S. spontaneum. This explains why cultivars clustered closer to and shared more unique bands with S. officinarum than with S. spontaneum in this and other studies.
Generation-wise, POJ 2878, being a less advanced cultivar, was in a different subgroup than the more modern cultivars. The latter, however, share a closer relationship with La Purple, which is a S. officinarum clone that was used extensively in their pedigree (Deren, Reference Deren1995). Furthermore, the leading cultivar in Louisiana, LCP 85-384 (CP 77-310 × CP 77-407), shared a slightly closer relationship (0.94) with HoCP 85-845 compared with either of its parents. This relationship is supported by the fact that their grandparents were full siblings. The SRAP technique seems robust enough to describe the subtle relationship that exists among these four cultivars, some of which may have resulted from breeding and directional selection and which is generally not accounted for by pedigree data.
An appealing aspect of the SRAP system in this study is its ability to amplify species-specific markers across the Saccharum species, with 75% of those markers scored in the S. spontaneum genome. Pending an assessment of their breeding values, these markers can be useful in introgression breeding and in broadening the genetic base of sugarcane cultivars. Most of the SRAP alleles amplified in Brassica were evenly distributed across the genome (Li and Quiros, Reference Li and Quiros2001). A similar propensity to amplify markers across the Saccharum genome would be a valuable addition to genetic mapping projects that particularly employ interspecific populations.
Another appealing aspect of the SRAP system is its ability to amplify exonic regions of the genome (Li and Quiros, Reference Li and Quiros2001; Ferriol et al., Reference Ferriol, Pico and Nuez2003a, Reference Ferriol, Picó and Nuezb). All the sequenced fragments in this study showed homology with EST sequences of S. officinarum and several other related species [wheat (Triticum aestivum L.), rice and maize]. Additional searches with the rice and maize EST, to benefit from the large (relative to sugarcane) bioinformatics resources available to these crops, found high homology with known or putative protein sequences. Furthermore, the high GC content (>41%) of the sequenced SRAP fragments in this study is indicative of their affinity to amplify exons. A GC content of over 35% from sequences of the Arabidopsis genome has often been associated with exonic regions (Li and Quiros, Reference Li and Quiros2001).
Conclusion
This study was the first report on the utility of the SRAP marker technique to assess genetic relationships and diversity among genotypes of Saccharum and allied genera and should be regarded as a baseline since only a small representative number of clones were included from each species and genus. The level of polymorphism observed proved that the SRAP system was robust at amplifying markers across species and genera and did so according to the evolutionary history interconnecting members of the Saccharum complex. The ability to amplify species and genus-specific markers would prove to be a valuable asset during efforts to introgress useful genes and, at the same time, broaden the genetic base of modern sugarcane. The resolving power of the SRAP markers, even for the narrow genetic structure of modern cultivars, coupled with the fact that some of the amplicons could be amplifying gene-rich regions from diverse loci of the genome, is indicative of its potential usefulness for linkage and quantitative trait loci mapping in sugarcane.
Acknowledgements
This research was supported in part through grants from the USDA-NRI (Award No. 2003-35 300-13 115) and the American Sugarcane League of the USA, Inc. Technical assistance was provided by Anna Johnson of the USDA-ARS, SRRC, Sugarcane Research Unit, Houma, LA, USA.



