INTRODUCTION
The application of DNA methods to studies on the systematics and population genetics of platyhelminth parasites has become widespread in recent years. These molecular studies have led to the chance discovery of many genetically distinct but morphologically very similar species (Jousson, Bartoli and Pawlowski, 2000; Macnish et al. 2002; Criscione and Blouin, 2004; Xiao et al. 2005). What is not commonly done is to use a DNA marker to deliberately search for evidence of cryptic species (e.g., Jousson and Bartoli, 2000; Haukisalmi et al. 2001; Hu et al. 2005; Wu et al. 2005), an approach sometimes referred to as molecular prospecting (Blouin, 2002; Criscione, Poulin and Blouin, 2005). Molecular prospecting is usually initiated when one suspects the presence of cryptic species or when one needs to be sure they are dealing with a single species or population. For example, if a species occurs in multiple hosts or habitats it may be prudent to check for evidence of cryptic species. If one uses DNA sequence data, then cryptic species might be indicated if one finds unusually large genetic distances between certain individuals (distances greater than typically found within species of that taxon), or if one finds evidence of reciprocally monophyletic groups in large population samples. Note that prospecting is simply a first pass to look for evidence that species may be present. Given such evidence (e.g., a few individuals having unusually large genetic distance), the next step would be to formally test the hypothesis of absence of gene flow or lineage exclusivity by collecting more samples and applying multiple markers. This second step can be called species delimitation. In that sense prospecting is a form of exploratory data analysis that generates hypotheses, and delimitation is the next step of hypothesis testing. Finally, we of course recognize that using an arbitrary genetic distance yardstick is not a sound way to delimit species. But it is a rational approach in prospecting.
An ideal molecular marker for prospecting would be easy to obtain, provide unambiguous data, and have a rapid evolutionary rate. Mitochondrial DNA and ITS are commonly used on platyhelminths for phylogenetics and species identification (distinguishing between previously identified, but morphologically similar, species; Morgan and Blair, 1995, 1998; León-Règagnon, Brooks and Pérez-Ponce de León, 1999; Tkach, Pawlowski and Sharpilo, 2000; Kostadinova et al. 2003; Scholz et al. 2004). Given that cryptic species of platyhelminth parasites are probably common, it is useful to review the relative merits of mtDNA and ITS for their use in the molecular prospecting in this group of organisms. Little is known about the relative divergence rates of nuclear versus mtDNA in flatworms (Morgan and Blair, 1998), so here we first establish the relative levels of intra-versus inter-specific variation typical of the two types of markers in flatworms. Then we review data on molecular evolution of each marker and discuss caveats that may be encountered when using either mtDNA and ITS as a prospecting marker in platyhelminths.
MATERIALS AND METHODS
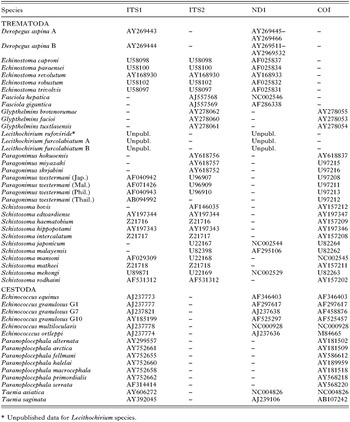
We obtained DNA sequences from GenBank for pairs of congeners for which both mitochondrial sequence data and ITS data were available (Table 1). When available, previous phylogenetic information was used to ensure that comparisons were among closely related or sister species. Our goal is not to use this information to identify a minimum genetic distance for defining species, but to compare the relative rates of evolution of the two markers, and evaluate which is more useful in molecular prospecting for cryptic species. Because certain studies suggest that ITS1 appears to accumulate substitution at higher rate than ITS2 (Morgan and Blair, 1995; van Herwerden, Blair and Agatsuma, 1999; Tkach et al. 2000), we included data from both loci separately. Although the mitochondrial genome contains different functional units (genes), the whole molecule is a single genealogical unit due to a lack of recombination. However, the rate of substitution among mitochondrial genes is variable. Thus, we restricted the data set to species pairs for which nicotinamide adenine dinucleotide dehydrogenase subunit 1 (ND1) and cytochrome c oxidase subunit 1 (COI) sequences were available. These are the most commonly used mitochondrial markers in molecular systematics of flatworms. According to the identification given in Kostadinova et al. (2003), the Echinostoma robustum sequences used in this study were those provided by Morgan and Blair (1998) as a German isolate of Echinostoma revolutum. Several strains of Echinococcus granulosus that could represent different species were included in the comparative analyses. We followed the recent proposition of species status for 2 ‘strains’ (G4 and G5) of Echinococcus granulosus, which were named E. equinus and E. ortleppi, respectively (see Thompson and McManus, 2002). We also compared specimens identified as Paragonimus westermani from different localities that probably constitute cryptic species (Blair et al. 1997). Recently, the reduction of Paragonimus skrjabini and P. miyazakii to subspecific status has been suggested (Blair et al. 2005); however, we retain the original designation. Species of Lecithochirium show both repetitive elements within ITS1 and length variation for this spacer within a single individual (unpublished observation). We assumed that intra-individual ITS1 length variation found within Lecithochirium species was due to variation in the number of repeats and not owing to the presence of paralogues in other rDNA loci. Because of the size of the repetitive region, only the 5′ end was compared among species. Similarly, a repeat region present in ITS1 of some species of Schistosoma was not included in the comparisons between S. mekongi and S. malayensis, and species of the S. haematobium group. Repeats in the ITS were not observed for other species in our data set. The mtDNA sequences aligned unambiguously with no gaps. However, because ITS is a non-coding sequence, frequent insertions or deletions (indels) were present in the comparison of different taxa, making the alignment more complicated than in the case of mtDNA genes. In order to be consistent we aligned each species pair using Clustal W, applying the same algorithm in all cases. The percentage of sequence difference was computed as the proportion of nucleotide sites at which 2 sequences are different (uncorrected p). No correction is necessary for multiple changes because the sequences of closely related species exhibit little divergence. Thus, uncorrected p is an estimate of the accumulated number of nucleotide substitutions per site. Because ND1 sequences of multiple individuals were available for Lecithochirium and Deropegus species, we computed average distances between sibling species in each case. MEGA 2.0 (Kumar et al. 2001) was used to make all calculations.

RESULTS AND DISCUSSION
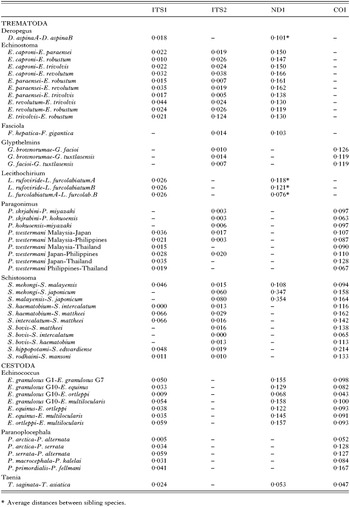
Comparisons of genetic distances from pairs of congeners for both mtDNA and ITS sequences clearly demonstrated that mtDNA sequences of platyhelminths accumulate nucleotide substitutions at a much higher rate than ITS (Fig. 1). It is notable that several pairs of congeners showed up to 10% divergence at the mtDNA, but about 1% at the ITS (Table 2). Species pairs of platyhelminths that have approximately 1% divergence between ITS sequences are relatively frequent (Després et al. 1992; Kane and Rollinson, 1994; Anderson and Barker, 1998; Criscione and Blouin, 2004). This degree of variation in the ITS was also typical of the variation within and among individuals of the same species (e.g., van Herwerden et al. 1999; Macnish et al. 2002). In contrast, large population samples from species of trematodes show maximum intraspecific divergences ranging from 0·3 to 2·2% at mtDNA (Table 3). These values do not overlap with divergences between species (Table 2). Thus, for example, if one has a sample of individuals that are putatively from a single population, then the presence of individuals differing by more than say, 5% at mtDNA should raise a red flag and motivate further investigation.

Fig. 1. Cytochrome c oxidase I uncorrected p distance versus ribosomal DNA internal transcribed spacer1 uncorrected p distance for each species pair. The diagonal line indicates where equal distances for both markers would lie.


In accordance with previous data on flatworms (Gasser, Zhu, and McManus, 1999; Obwaller et al. 2004), our results suggest that COI exhibits less divergence between pairs than ND1 (Table 2). Nevertheless, even COI accumulates substitutions substantially more quickly than ITS1 (Fig. 1), which is considered more variable than ITS2. Interestingly, comparisons between ITS1 and ITS2 did not reveal a consistent pattern in terms of which region had a higher nucleotide substitution rate. This inconsistent pattern is in contrast to previous studies in flatworms that suggest ITS1 is more variable than ITS2 (Luton, Walker and Blair, 1992; Morgan and Blair, 1995; van Herwerden et al. 1999; Tkach et al. 2000; Galazzo et al. 2002).
A prospecting marker should exhibit relatively low intra-specific variation and a high level of divergence between closely related species. Moreover, it is important that the marker lacks intra-individual variation because one may not be able to determine which variant should be compared among samples. Low intra-individual and intra-specific variation for ITS markers is traditionally assumed due to the action of molecular turnover mechanisms (Dover, 1982). However, the efficiency of concerted evolution depends on whether rDNA variants are on nonhomologous chromosomes (Polanco, González and Dover, 1998; Parkin and Butlin, 2004), on the speciation rate (Vogler and DeSalle, 1994; Harris and Crandall, 2000), and on the frequency of chiasmata (the sites of crossing over), which may be highly variable in trematodes (van Herwerden et al. 1999). Under circumstances of slow concerted evolution, processes such as hybridization, incomplete lineage sorting or retention of an ancestral polymorphism could cause the sharing of different ITS types among species of flatworms, and could therefore confound a prospecting study by using this marker (e.g., Rollinson et al. 1990; Huang et al. 2004). Hybrids having mtDNA and ITS sequences from different species were recently reported for Schistosoma (Morgan et al. 2003). These potential problems are generally recognized for mtDNA (Ballard and Whitlock, 2004). However, the importance of hybridization and lineage sorting for ITS probably has been overlooked because of the assumption of concerted evolution. There are several observations that indicate concerted evolution may not be efficient in platyhelminths. For example, 2 distinct ITS1 types were found in a single isolate of Echinococcus granulosus (see Bowles, Blair and McManus, 1995). Intra-individual variation in ITS of trematodes and cestodes may result from a variable copy number of tandem repeats within the spacer (van Herwerden, Blair and Agatsuma, 1998, 1999; Luo et al. 2002). Such repetitive elements are common in ITS of flukes (Luton et al. 1992; Kane and Rollinson, 1994; Kane et al. 1996; van Herwerden et al. 1998; León-Regàgnon et al. 1999; van Herwerden et al. 1999; Jousson and Bartoli, 2000; Bell and Sommerville, 2002; Dvorák et al. 2002). Indeed, the evolution by internal repetition in the ITS may be a general process in a variety of taxa (von der Schulenburg et al. 2001).
Intra-individual variation for mtDNA may be explained by heteroplasmy or the presence of pseudogenes. Heteroplasmy has been described for flatworms (Pena et al. 1995), and can result from somatic mutations, introgression or bi-parental inheritance (Avise, 2000). The rapid sorting of mtDNA molecules in cell lineages should maintain identical or very similar sequences within individuals (Avise, 2000). Thus, heteroplasmy by somatic mutations should not present a problem for molecular prospecting. However, mtDNA may introgress faster than nuclear genes (Ballard and Whitlock, 2004; Chan and Levin, 2005), and both introgression and bi-parental inheritance can lead to divergent mtDNA lineages within individuals. Bi-parental inheritance was reported for Schistosoma mansoni (Janotti-Passos et al. 2001, but see Bieberich and Minchella, 2001 for an alternative explanation). Although more work is needed to determine if mtDNA heteroplasmy is common among parasitic flatworms, the typically maternal inheritance of animal mtDNA suggests that the influence of heteroplasmy in molecular prospecting for cryptic species is probably of little importance. Large divergence between samples may also be falsely concluded if a comparison is made between a pseudogene and a functional gene. Both mitochondrial and ITS pseudogenes have been found in parasitic helminths (Morgan and Blair, 1998; Hugall, Stanton and Moritz, 1999; van Herwerden, Blair and Agatsuma, 2000; Obwaller et al. 2004). Because frame-shift mutations or premature stop codons are common in pseudogenes, protein-coding genes of the mtDNA can be error checked by translating the nucleotide sequence (Benasson et al. 2001). However, detection of ITS pseudogenes might be more difficult because they are not protein-coding genes.
Undetected paralogy, incomplete lineage sorting and introgressive hybridization could mislead a prospecting study using either ITS or mitochondrial sequences. However, a rapid rate of evolution is a key requirement for a prospecting marker, and the results obtained here indicate mtDNA of flukes evolves much faster than ITS. Furthermore, mtDNA generally has a smaller effective population size than nuclear genes. Given that small populations reach a state of reciprocal monophyly faster than large populations, the probability of detecting diagnostic characters between cryptic species is increased by the use of mtDNA. Thus, despite limitations, mtDNA is preferable to ITS to prospect for cryptic species of parasitic platyhelminths owing to its higher sensitivity to reveal species with recent ancestry.
R.V. was the recipient of a PD/MEC Fellowship from the European Union and the Spanish Ministry of Education and Science. C.D.C. is supported by a US Environmental Protection Agency STAR Fellowship.