

1. INTRODUCTION
The interaction of hot plasma with the reactor components, placed inside the chamber, represents a complex problem in the physics of thermonuclear reactors. Investigation of the interaction processes is important for selecting materials of the wall of the thermonuclear reactor, as well as for its correct operation, taking into account the constraints imposed by the interaction with the wall. Although active research in this area has cleared up a large number of questions related to the interaction of plasma with solids, it has left a lot of unsolved problems. The state of research in this area is reflected in a large number of scientific papers (Baron-Wiechec et al., Reference Baron-Wiechec, Widdowson, Ayres, Coad, Hardie, Heinola and Matthews2015; Brezinsek et al., Reference Brezinsek, Widdowson, Mayer, Philipps, Baron-Wiechec, Coenen, Heinola, Huber, Likonen, Petersson, Rubel, Stamp, Borodin, Coad, Carrasco, Kirschner, Krat, Krieger, Lipschultz, Linsmeier, Matthews and Schmid2015; Rubel et al., Reference Rubel, Brezinsek, Coenen, Huber, Kirschner, Kreter, Petersson, Philipps, Pospieszczyk, Schweer, Sergienko, Tanabe, Ueda and Wienhold2017). To date, we can identify the following main problems playing a key role in the interaction of plasma with the material of the front wall of the reactors: Working resource of materials facing the plasma; formation of dust as a result of erosion of materials; accumulation of tritium in the materials of the vacuum chamber.
Thus, the accumulation of dust and the deposition of a film in the volume of the reactor mainly play a negative role. Firstly, it leads to the instability of high-temperature plasma, the instability of the balloon mode (magnetohydrodynamics peeling-ballooning mode), and initiation of disruptions; secondly, the capture and accumulation of tritium, which is a problem for the safe operation of the reactor and its cost-effectiveness (Connor, Reference Connor1998; Federici et al., Reference Federici, Skinner, Brooks, Coad, Grisolia, Haasz, Hassanein, Philipps, Pitcher, Roth, Wampler and Whyte2001; Krasheninnikov & Soboleva, Reference Krasheninnikov and Soboleva2005; Wilson et al., Reference Wilson, Cowley, Kirk and Snyder2006; Likonen et al., Reference Likonen, Coad, Vainonen-Ahlgren, Renvall, Hole, Rubel and Widdowson2007; Flanagan et al., Reference Flanagan, Sertoli, Bacharis, Matthews, de Vries, Widdowson, Coffey, Arnoux, Sieglin, Brezinsek, Coenen, Marsen, Craciunescu, Murari, Harting, Cackett and Hodille2015; Tong et al., Reference Tong, Hou and Cao2015; Budaeva et al., Reference Budaeva, Martynenko, Grashin, Giniyatulin, Arkhipov, Karpov, Savrukhin, Shestakov, Solomatin, Begrambekov, Belova, Fedorovich, Khimchenko and Safronov2016).
It is known that dust formation in tokamaks is caused by various processes in the chamber of the thermonuclear installation. For instance, in many papers (Tsytovich & Winter, Reference Tsytovich and Winter1998; Federici et al., Reference Federici, Skinner, Brooks, Coad, Grisolia, Haasz, Hassanein, Philipps, Pitcher, Roth, Wampler and Whyte2001; Winter, Reference Winter2004) various mechanisms of formation of dust particles in thermonuclear devices, including erosion of walls, ion-molecular reactions and coalescence of dust particles into large-sized particles, were considered. The particle sizes typically vary over a very wide range from nanometers to hundreds of micrometers. The composition of the particles includes materials used for the plates of the divertor, the first wall and other internal structural elements, which are usually graphite, titanium, tungsten, beryllium, and steel.
This work is devoted to the study of dust formation in the interaction of an accelerated pulsed plasma flow with the graphite plates and the dynamics of the flow itself. To simulate and study this process, a plasma accelerator of the coaxial type was used. Coaxial type accelerators are universal installations for generating a pulsed plasma flow and for studying its interaction with candidate materials for the first wall of thermonuclear installations.
2. EXPERIMENTAL SETUP
The authors of this work have previously investigated the properties of plasma-dust structures at various installations, such as plasma of radio-frequency (RF) and direct-current (DC) discharges, where the structural and dynamic properties of plasma with dust particles at different discharge parameters (plasma current in DC discharge, peak-to-peak voltage in RF discharge, and various kinds of gases, for example, pure Ar, pure He, mix of Ar-He, and Ar-H2) were studied (Ramazanov et al., Reference Ramazanov, Dzhumagulova, Jumabekov and Dosbolayev2008; Dosbolayev et al., Reference Dosbolayev, Utegenov, Ramazanov and Daniyarov2013; Orazbayev et al., Reference Orazbayev, Ussenov, Ramazanov, Dosbolayev and Utegenov2015).
In this paper, we studied the moving processes of a plasma column along a pulsed plasma accelerator and dust formation during the interaction of a pulsed plasma flow with a graphite target in the laboratory of dusty plasma and plasma technologies of the Institute of Experimental and Theoretical Physics (IETP), Al-Farabi Kazakh National University (KazNU). The picture of the experimental setup is shown in Fig. 1. The choice of graphite is due to the fact that it is one of the possible candidate materials for the first wall of the thermonuclear reactor (Singheiser et al., Reference Singheiser, Hirai, Linke, Pintsuk and Rodig2009).
Photo of the experimental setup.

The experimental setup consists of a plasma accelerator, a plasma channel with a length of 1 m, grounding and protection system, a control panel located in a separate room, diagnostic equipment, and communications. The accelerator is powered by capacitor banks, which consists of six sections with a total capacitance of 100 µF. The circuit of commutation of batteries allows us to vary the duration of the discharge current, and consequently, of the plasma flow. The operating voltage varies in the range of 6–13 kV. The principle of operation of the installation is based on the acceleration of the plasma bunch formed in the inter-electrode space by an electric arc discharge in the intrinsic magnetic field. For this purpose, a high voltage is applied to the electrodes, and a high vacuum is created in the working chamber by a fore-vacuum (rotor) pump. The discharge to the inter-electrode space is supplied by a vacuum spark gap consisting of two circular massive copper disks separated by a fluoroplastic insulator. The breakdown of the vacuum gap occurs when the initiating spark is ignited, for which an igniting electrode is installed in the grounded disk of the vacuum spark. Argon, hydrogen, and air were used as the working gas. The gas pressure in the chamber during the experiments was 10−2 Torr.
3. RESULTS AND DISCUSSION
3.1. Determination of Pulsed Plasma Flow Velocity
The motion of the pulsed plasma beam was recorded using a high-speed Phantom camera version v2512 with a maximum rate of 677,000 frames per second. In our experiment, to study the dynamics of the plasma stream, the video was recorded at a rate of 470,000 frames per second.
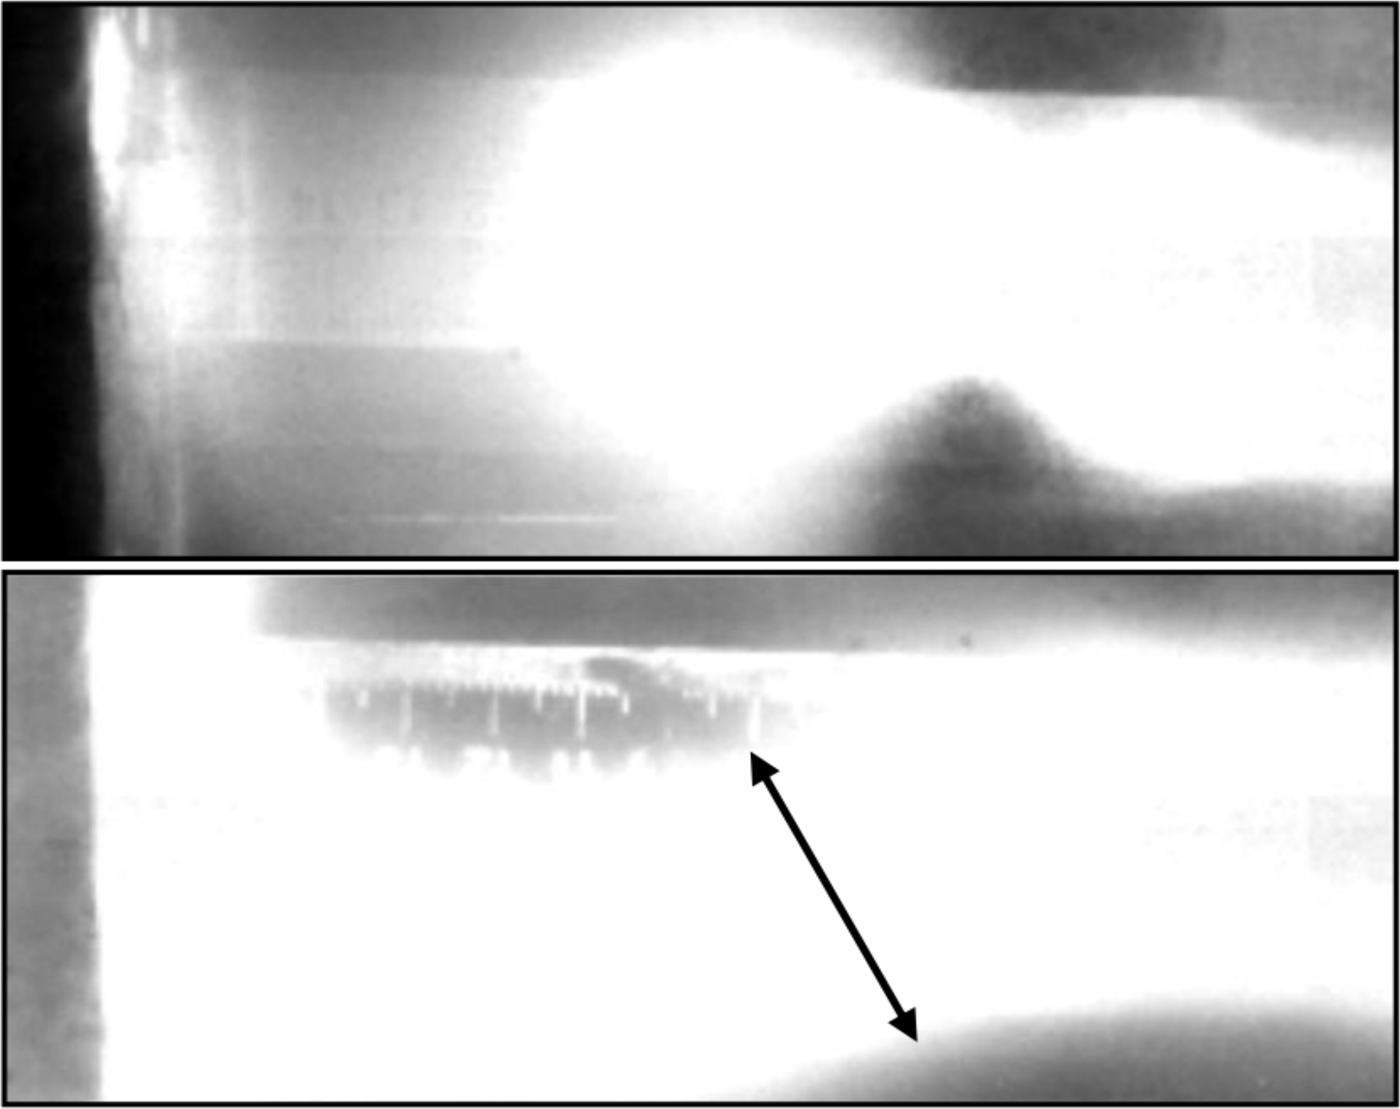
Figure 2a shows the fixed frame of the beginning of a pulsed plasma beam. It is seen that it has a spherical shape with a diameter of ~5 cm. Also, according to the results of video shooting, the average diameter of the plasma cord is ~4 cm (Fig. 2b).
Photo image of the plasma cord.
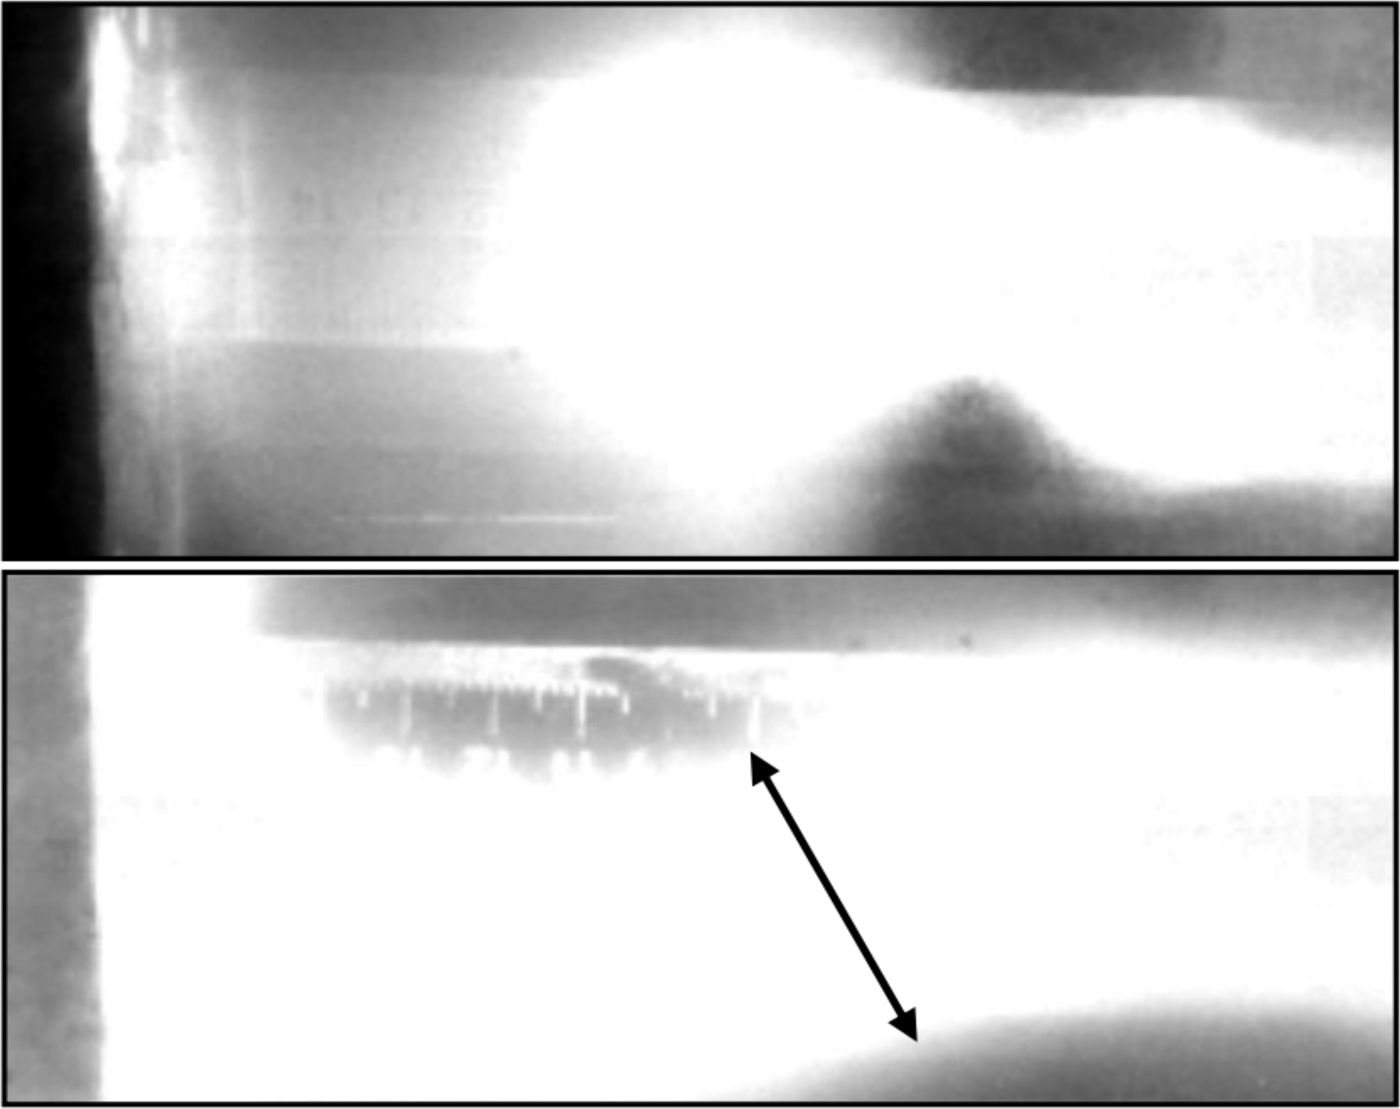
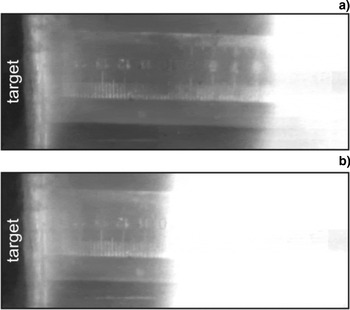
The results of determining the flow rate are shown in Figure 3. In the first frame, the beam origin was located at a distance of ~5 cm (Fig. 3a) and in the next frame, at a distance of ~10 cm from the electrode system (Fig. 3b).
Photo image of a plasma beam directed from a system of electrodes to the graphite target located at a distance of 16 cm: (a) The first frame; (b) the second frame.

Thus, knowing the time between successive frames, the plasma flow speed at a voltage of 8 kV was estimated, which was ~ 23 km/s. The speed of the plasma flow in our setup corresponds to the speed obtained in the works of other authors (Zhukeshov, Reference Zhukeshov2009; Krauz et al., Reference Krauz, Vojtenko, Mitrofanov, Myalton, Arshba, Astapenko, Markoliia and Timoshenko2015), where the speed was of the order of ~106 cm/sec. It should be noted that, depending on the working gas, the propagation speed of the plasma flow is changed. Thus, in work (Voronin et al., Reference Voronin, Gusev, Gerasimenko and Sudenkov2013) it was revealed that at the output of the accelerator it was ~100–200 km/s.
3.2. Determination of the Plasma Energy by the Wire Calorimeter Method
It is known that contact methods of diagnostics, for example, detectors, calorimeters, etc. placed inside the chamber are used to study the energy characteristics of pulsed plasma flows and after interaction with the plasma flow to measure changes in various characteristics (changes in current, voltage, temperature, etc.). Earlier, to study the energy content of the plasma, we used a cone-shaped solid calorimeter (Dosbolayev et al., Reference Dosbolayev, Utegenov, Tazhen, Ramazanov and Gabdullin2016). The main disadvantage of this calorimeter is a very small inertia. Thus, the energy of rapidly flowing plasma does not have time to absorb.
In this experiment, to determine the energy properties of a pulsed plasma flow, a wire calorimeter, which has a frame with tungsten wires spaced at equal distances with a diameter of 40 µm (grid-like frame), had been used. When a plasma bunch passes through a grid, it gives it its energy (the heat is absorbed by the wires). Heating the wires leads to a change in its initial resistance (resistance at room temperature). The gradient of this change determines the amount of absorbed energy of the plasma flow.
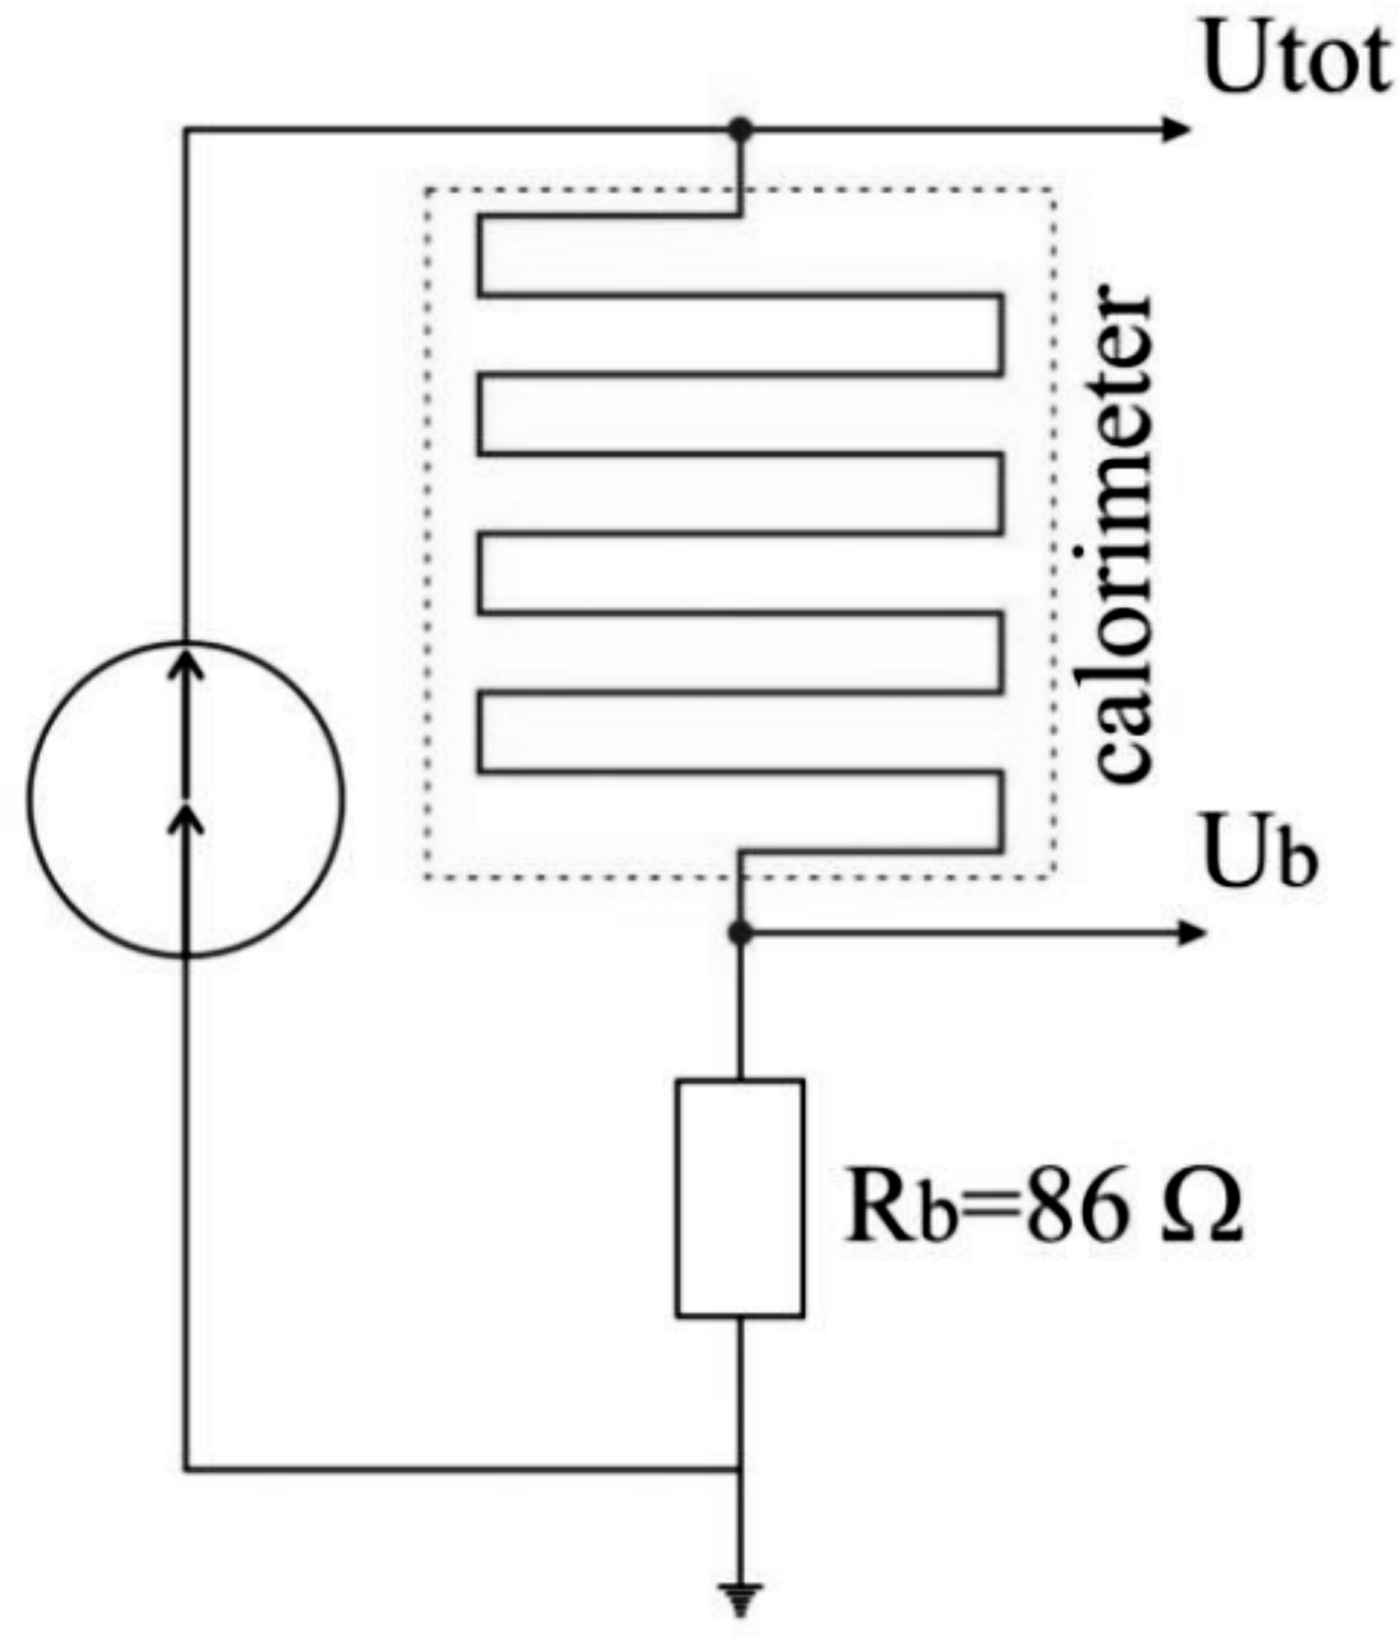
Changes in the resistance of the calorimeter were recorded by the electronic oscilloscope LeCroy 354 A. The oscilloscope was connected to the calorimeter through the electrical circuit as shown in Figure 4.
The electrical diagram of the calorimeter.
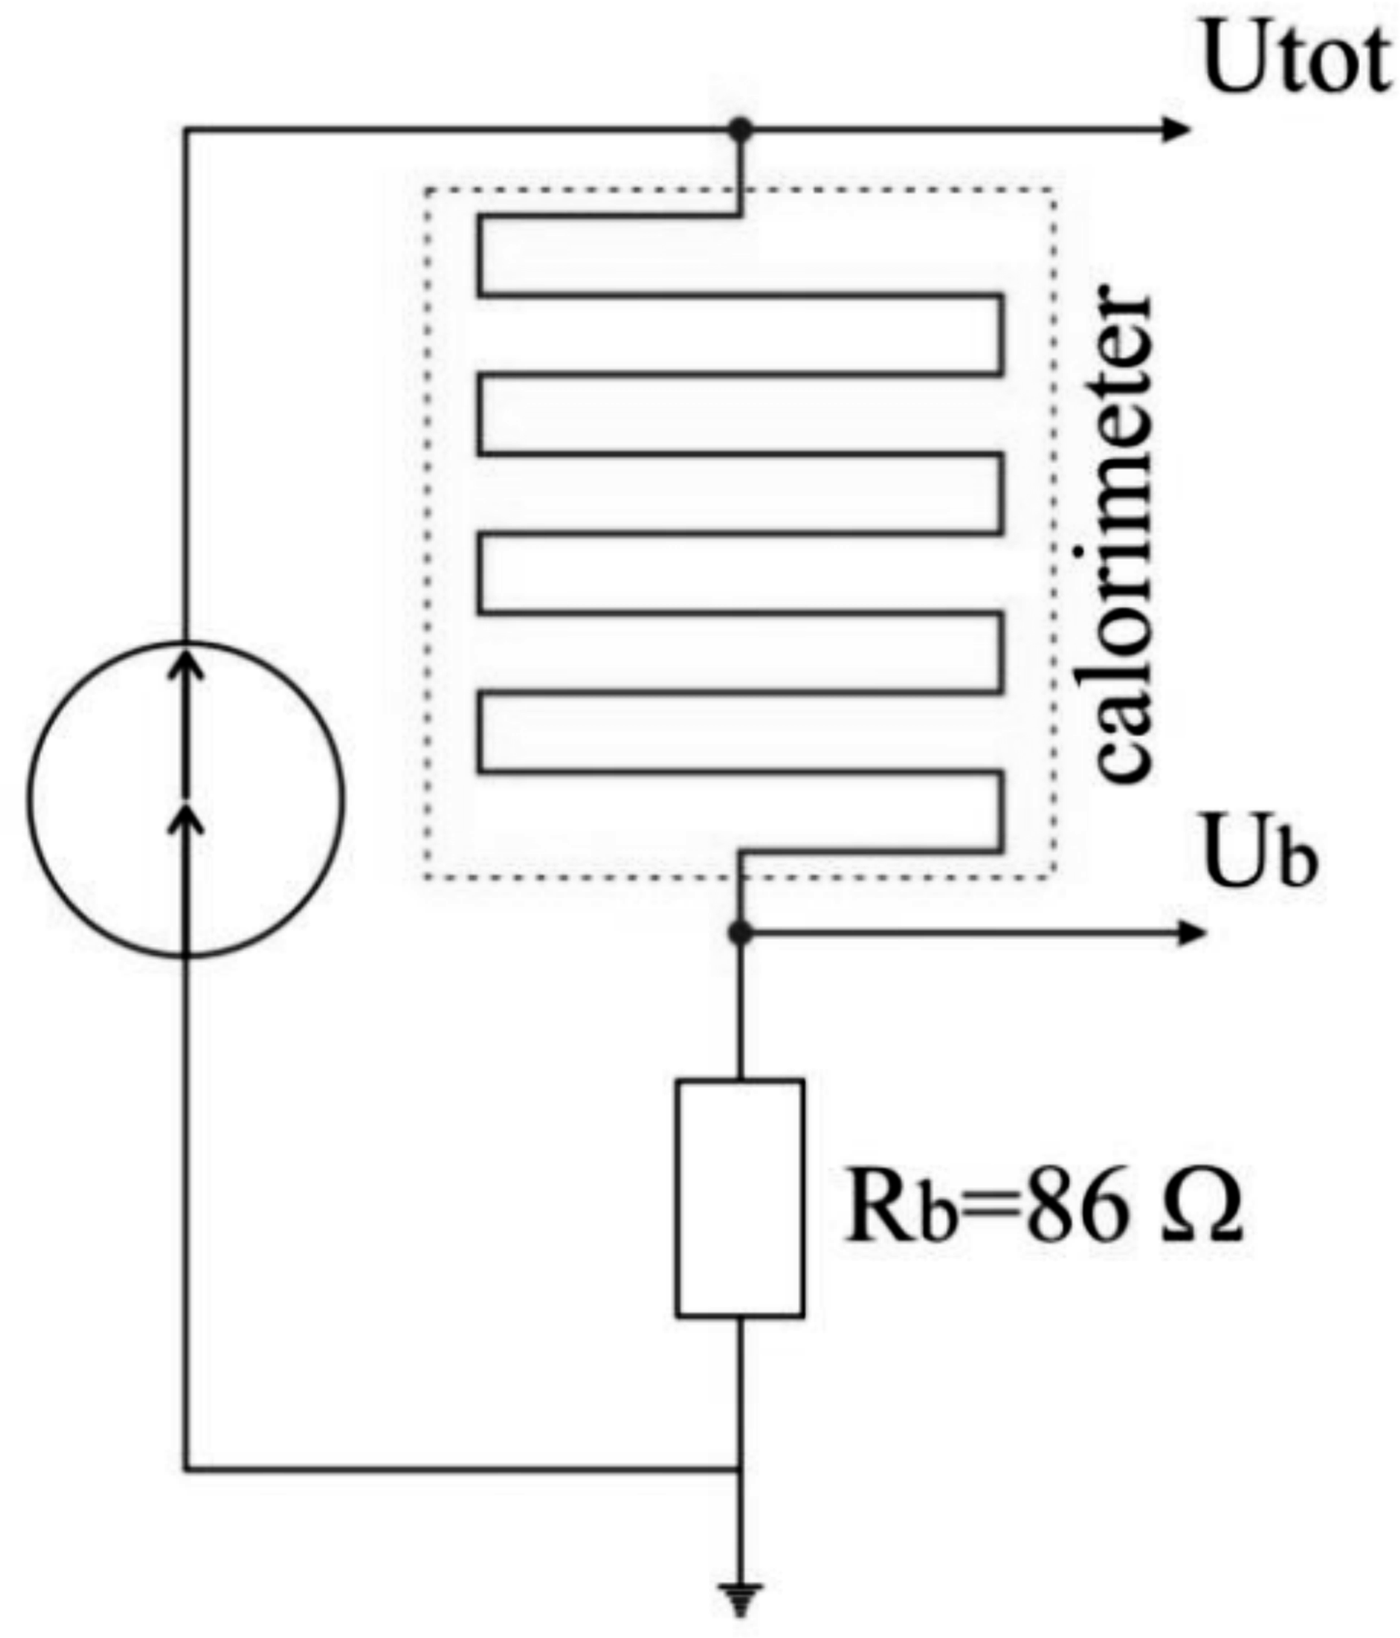
The measurements were carried out as follows: During the measurements, electric current was passed through the wires. If we take into account the resistance of the bypass, the total resistance of the circuit after heating will be:
 $$R_{{\rm total}} = R_{{\rm wire\; tot}.} + R_{\rm b} = R_0 + {\rm \Delta} R + R_{\rm b}$$
where R b is the bypass.
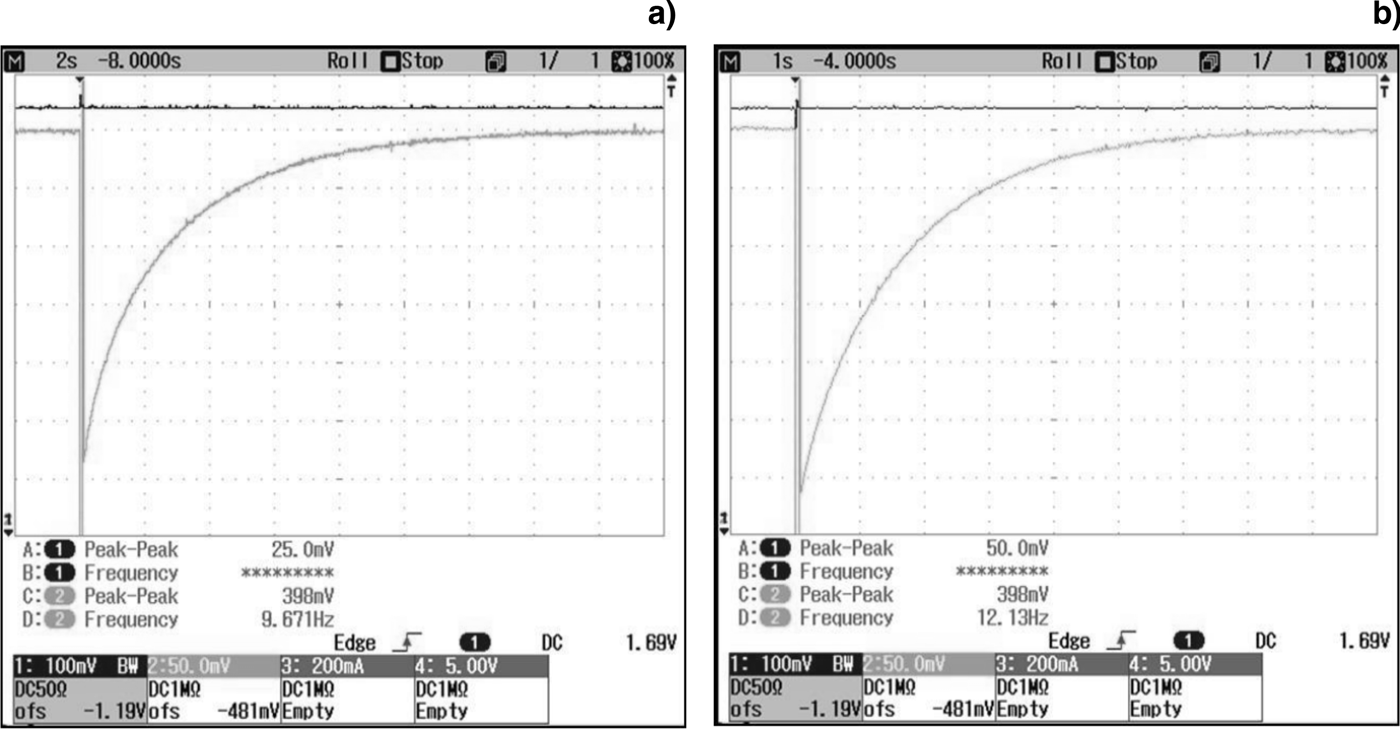
Figure 5 shows a typical oscillogram obtained during the experiments.
Oscillogram of voltage changes on a wire calorimeter: (а) U = 9.1 kV, P = 1.5·10−2 Torr; (b) U = 9.5 kV, P = 6·10−1 Torr.
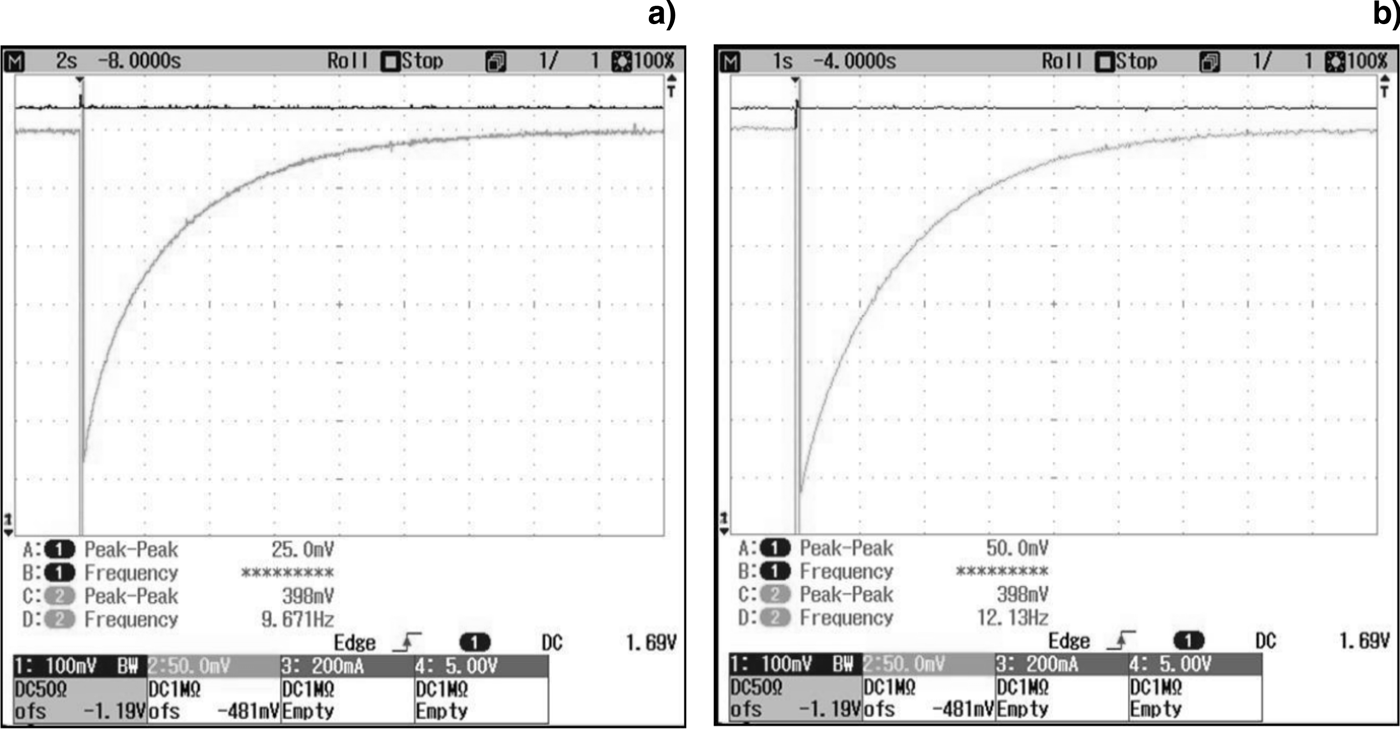
As can be seen from Figure 6, at high pressures the wire cools faster (~8 s, Fig. 6b) than at low pressures (~16 s, Fig. 6a). This phenomenon is due to the fact that at relatively high pressures (P = 6·10−1 Torr) a large concentration of neutral particles contributes to the transfer of a large amount of heat to the wires, thereby the cooling time is reduced compared with the experiments when the chamber pressure was P = 1.5·10−2 Torr.
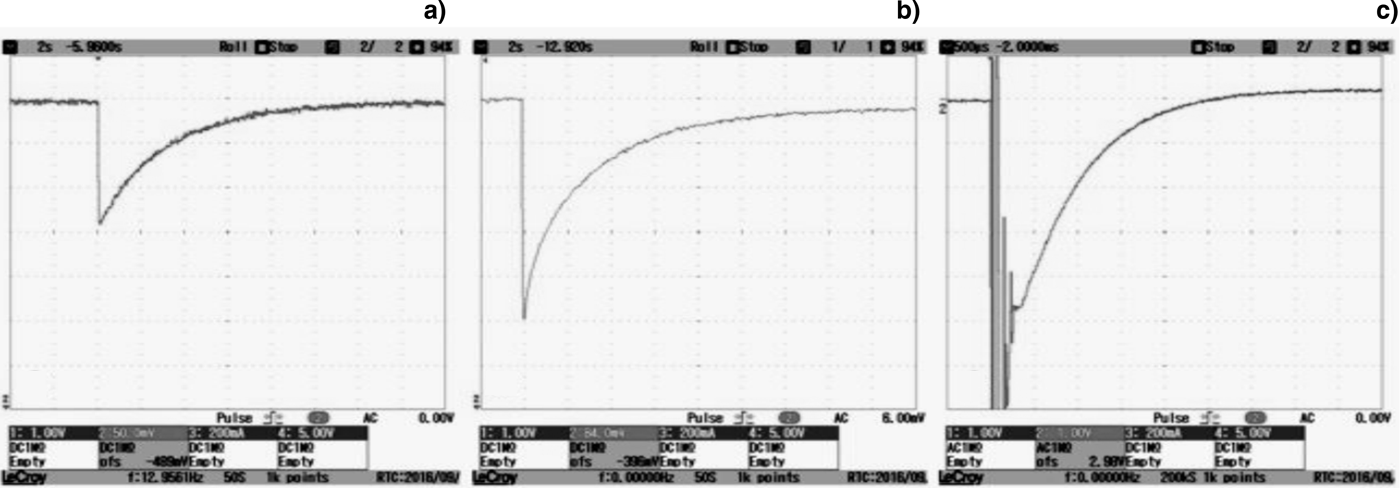
Oscillogram of voltage changes on a wire calorimeter: (а) U = 6.1 kV, P = 1.9·10−2 Torr; (b) U = 7.1 kV, P = 1.8·10−2 Torr; (c) U = 13.1 kV, P = 1.9·10−2 Torr.
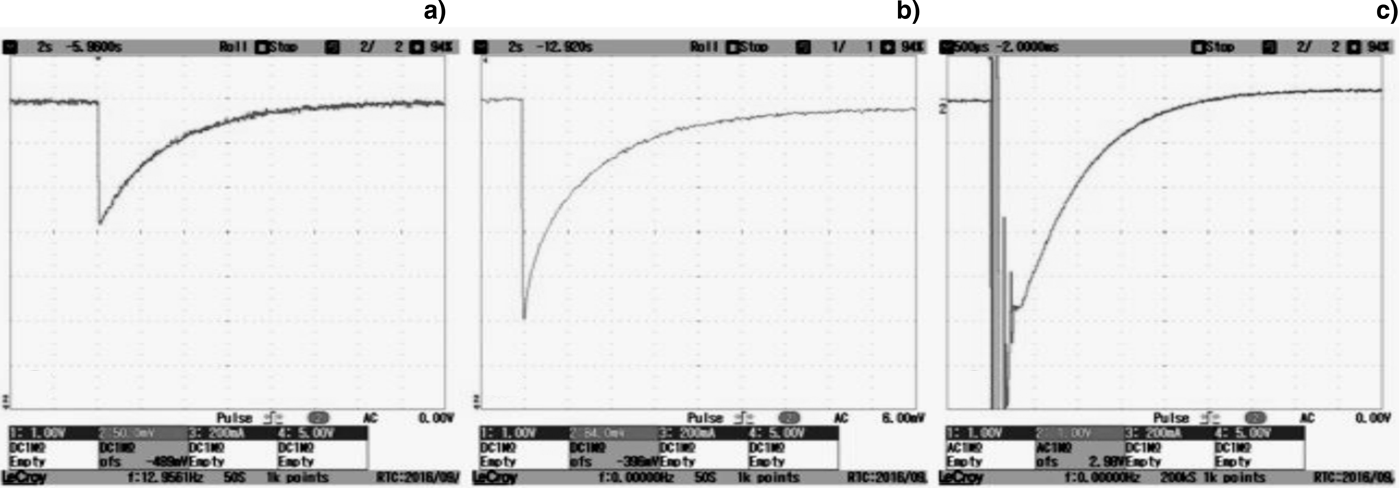
The wire grid was installed from the electrode systems at a distance of 25 cm, to pass an electric current through it, the grid was connected to a battery with a potential of 1.5 V. By changing the discharge voltage from 5 to 13 kV at constant gas pressure in the chamber (air pressure) of (1.7–1.9)·10−2 Torr, we obtained oscillograms of the calorimeter, as shown below in Figure 6.
As can be seen in Figure 6, when the discharge voltage increases, the voltage drop across the bypass decreases, as the resistance of the wire becomes higher than its original value. For further calculations, from all these oscillograms, the final voltage on the bypass was selected. Analyzing Figure 6c, it was found that up to the time point 300 µs on the oscillograms, perturbations appeared due to absorption of charged plasma particles by the bare wires of the calorimeter (electric probe mode). After this, the wires cooled down for approximately 3.7 s. In Figure 6a and 6b, the cooling time of the wire are 12 and 18 s, respectively. This is explained by the fact that when the discharge voltage is increased due to high energy, the wires are heated more strongly and more time is required for cooling.
In calculations the following factors were taken into account: Before the appearance of the plasma, the current flowing through the wire grid was kept constant, that is, the voltage at the ends of the electrical circuit, the total circuit voltage remained unchanged. When the voltage was applied to the electrodes of a pulsed plasma accelerator, the plasma was injected and directly moved to the wire grid. After the wire grid was heated by plasma, its resistance changed by an order of ΔR. Because of this, the voltage on the wire increased by ΔU. These changes led to a drop in the voltage at the bypass (from the initial U initial bypass = 620 mV).
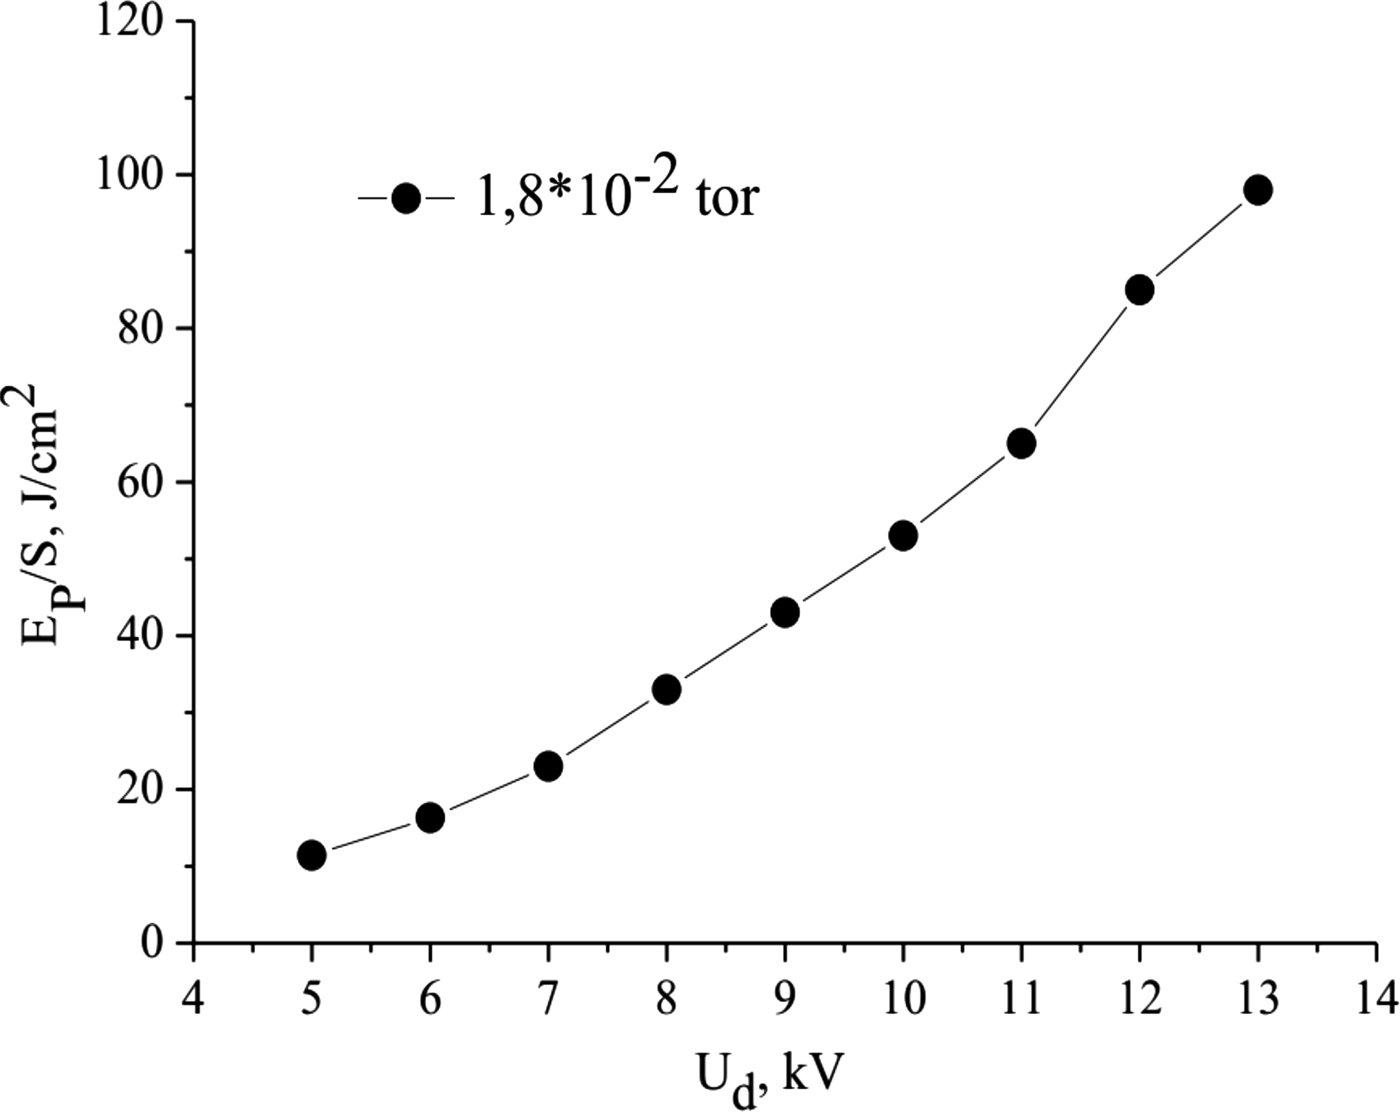
It can be seen that as the discharge voltage increases, the amount of heat absorbed per unit area of the wire becomes larger. As we know, charged particles of pulsed plasma have kinetic energy, which depends on the discharge voltage. The magnitude of the discharge voltage determines the magnitude of the kinetic energy. If it is gradually increased, the mobility of the charged particles will increase, and accordingly the kinetic energy increases (Table 1). As a consequence, particles transmit this energy to the wires, and we get the dependence shown in Figure 7.
Dependence of the energy density on the discharge voltage.

Thus, the maximum energy density of the impulse flow is 98 J/cm2, which corresponds to the value of the heat load that the first wall of the thermonuclear reactor receives (Kovalenko et al., Reference Kovalenko, Klimov, Zhitlukhin, Muzychenko, Podkovyrov, Safronov and Yaroshevskaya2014).
3.3. Dust Formation in the Pulsed Plasma Accelerator
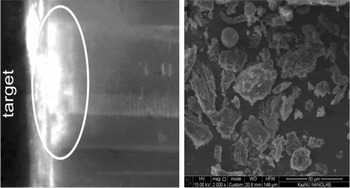
During the interaction of a pulsed plasma flow with a graphite plate, a “plasma-dust” cloud is formed. As the dust scatters on the surface of the graphite plate, it can also be detected after interaction with the plasma flow. An instant photo of this process is shown in Figure 8a (highlighted by a white circle).
Formed plasma-dust cloud near the graphite target.

Thus, after the collision of the plasma flux with the target, the dust particles are collected in a separate container for further analysis. With the help of a scanning electron microscope, images of the obtained samples (dust particles) were taken (Fig. 8b). As can be seen from Figure 8b, the surface structures and sizes of the obtained particles are different. Thus, for example, in this figure, most particles have a rough surface, and the particle size varies within the range of ~1–45 µm.
According to these data, it can be concluded that the experimental results obtained in the IETP, Al-Farabi KazNU pulsed plasma accelerator show a behavior similar to that obtained in tokamaks (Rubel et al., Reference Rubel, Cecconello, Malmberg, Sergienko, Biel, Drake, Hedqvist, Huber and Philipps2001).
3.4. Optical-Emission Properties of a Pulsed Plasma Flow
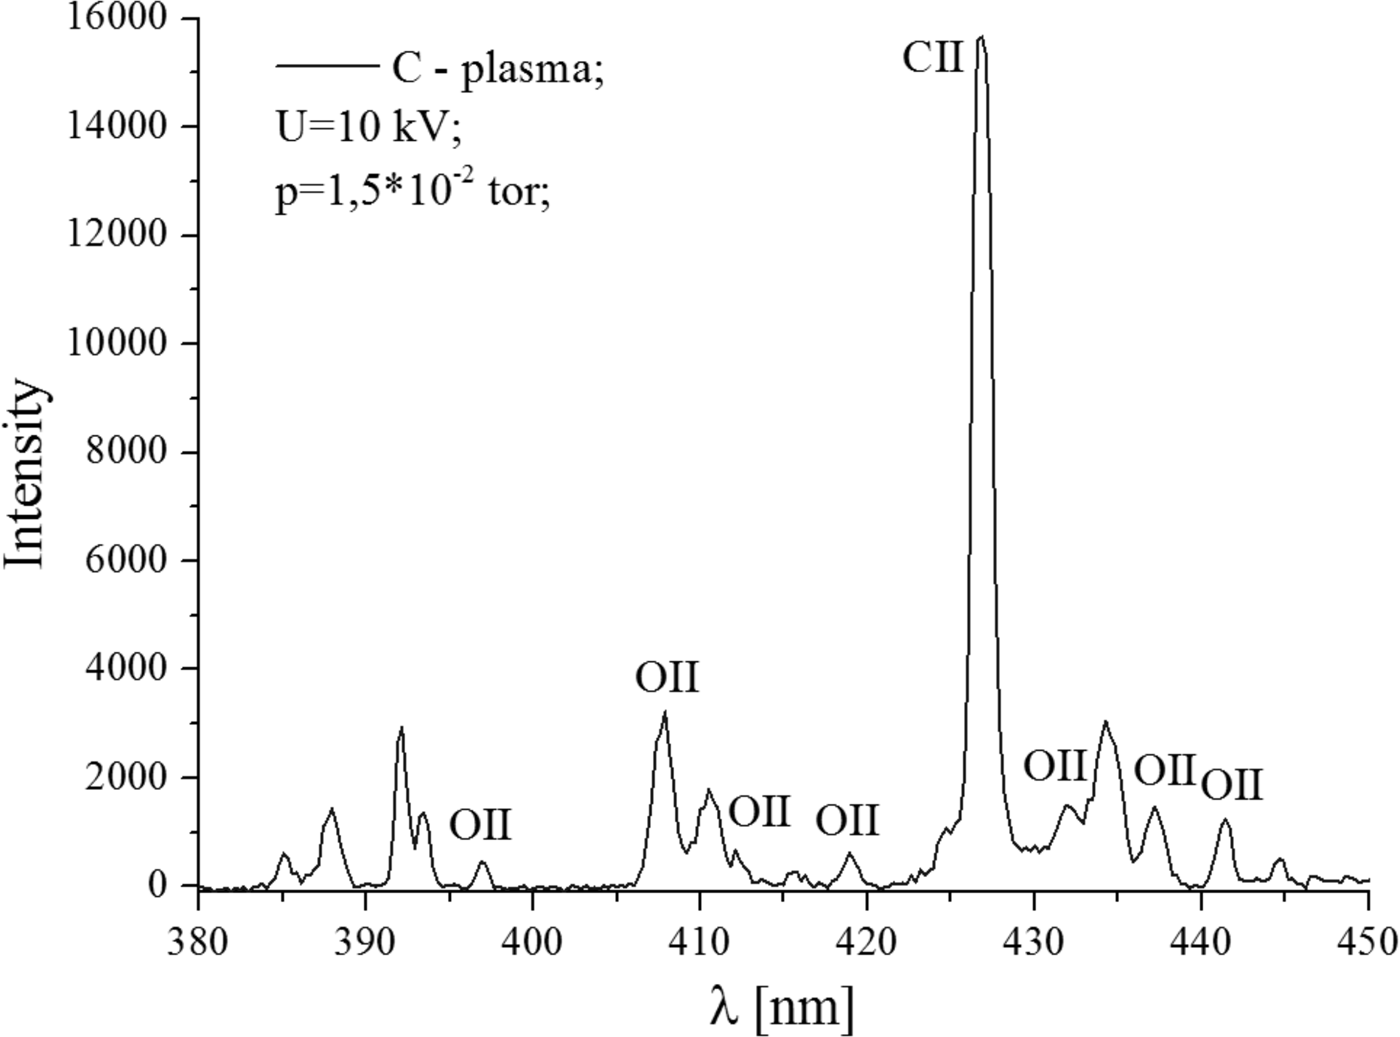
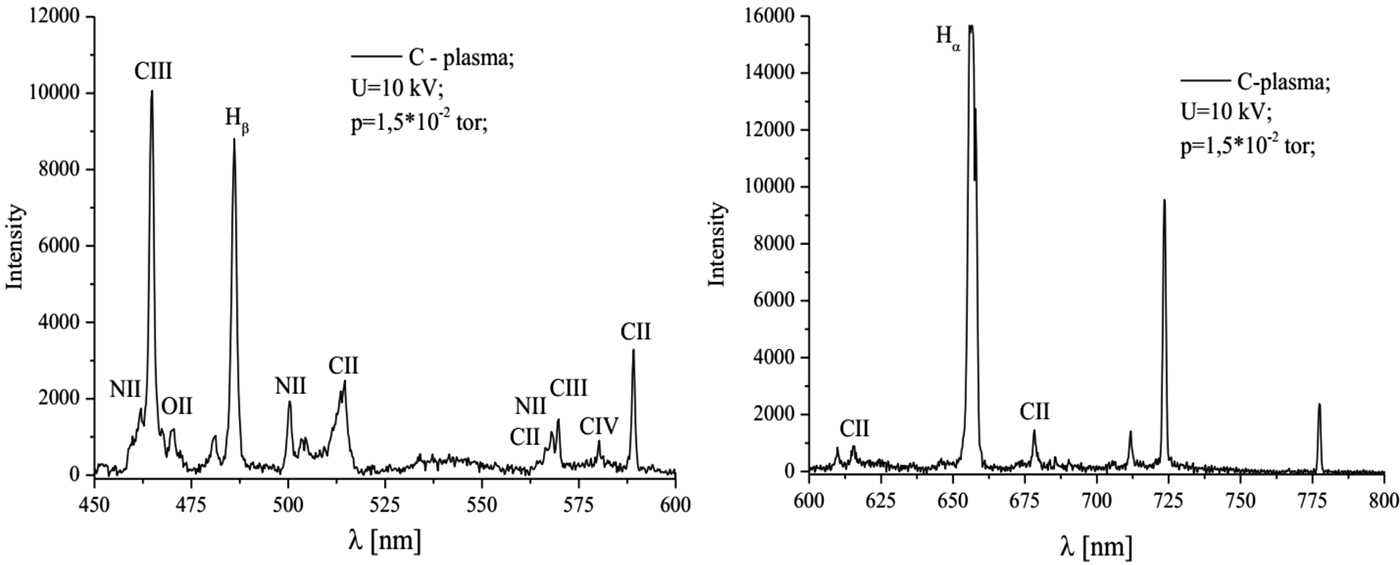
Optical properties of the plasma-dust formation near the graphite target can provide qualitative evidence that the pulsed plasma, after interaction with the surface, turns into a plasma with dust particles (Gorbunov et al., Reference Gorbunov, Klyuchnikov and Korobov2015). In our experiments, using the S100 linear spectrometer, optical emission spectra of the plasma were obtained by interaction with a graphite plate. The spectral lines are shown in Figures 9 and 10.
The optical-emission spectrum of plasma.
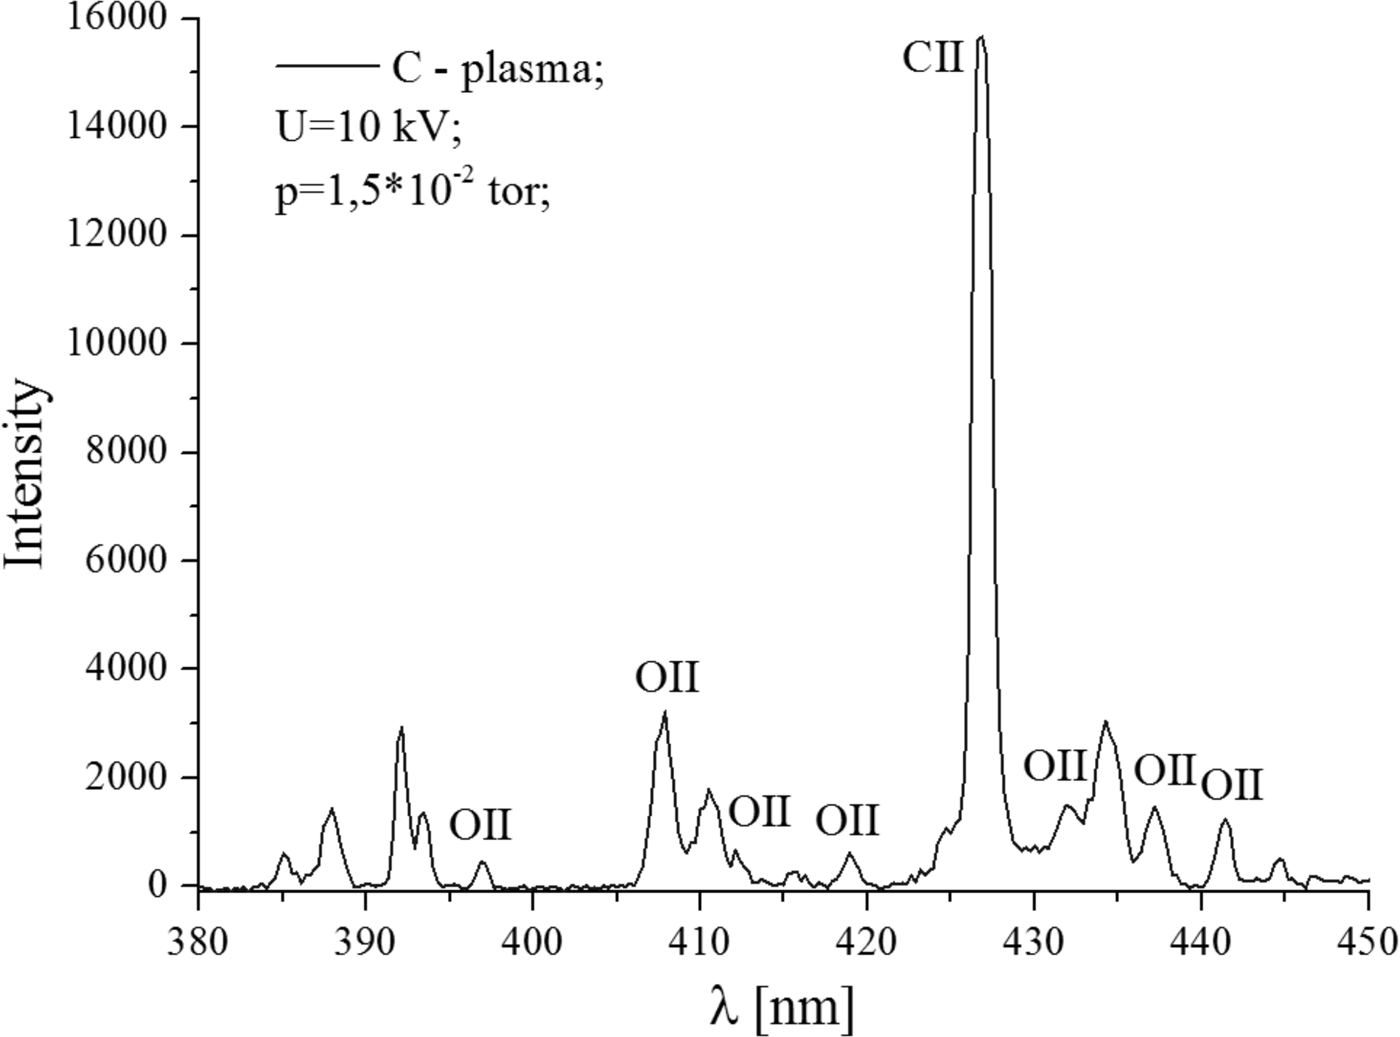
The optical-emission spectrum of plasma.
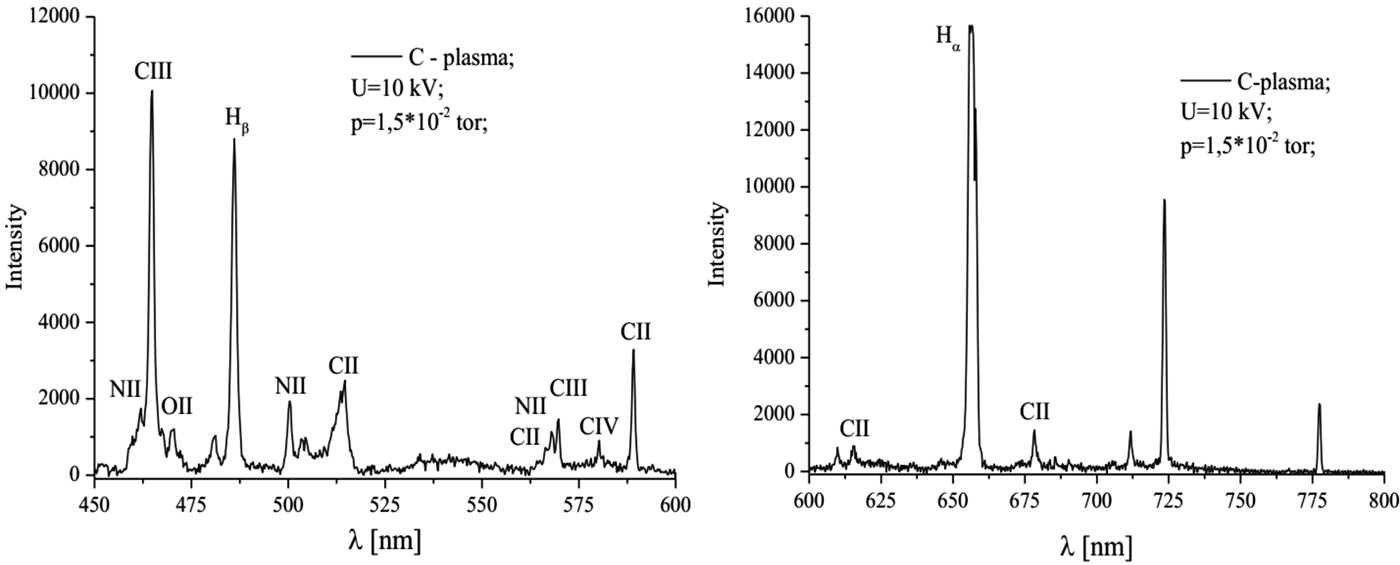
The spectral lines correspond to the chemical elements of the working gas: Nitrogen ions NII and NIII (Fig. 10b), oxygen OII, as well as carbon that makes up the irradiated target.
It should be noted that in this case the spectra measurements were carried out near the graphite target, which is a strong source of carbon. The measured spectrum contains information about the spatially localized arrival of carbon particles into the plasma. As indicated above, this is a consequence of the erosion of the surface of the carbon material.
3.5. Synergetic Analysis of Obtained Dust Structures
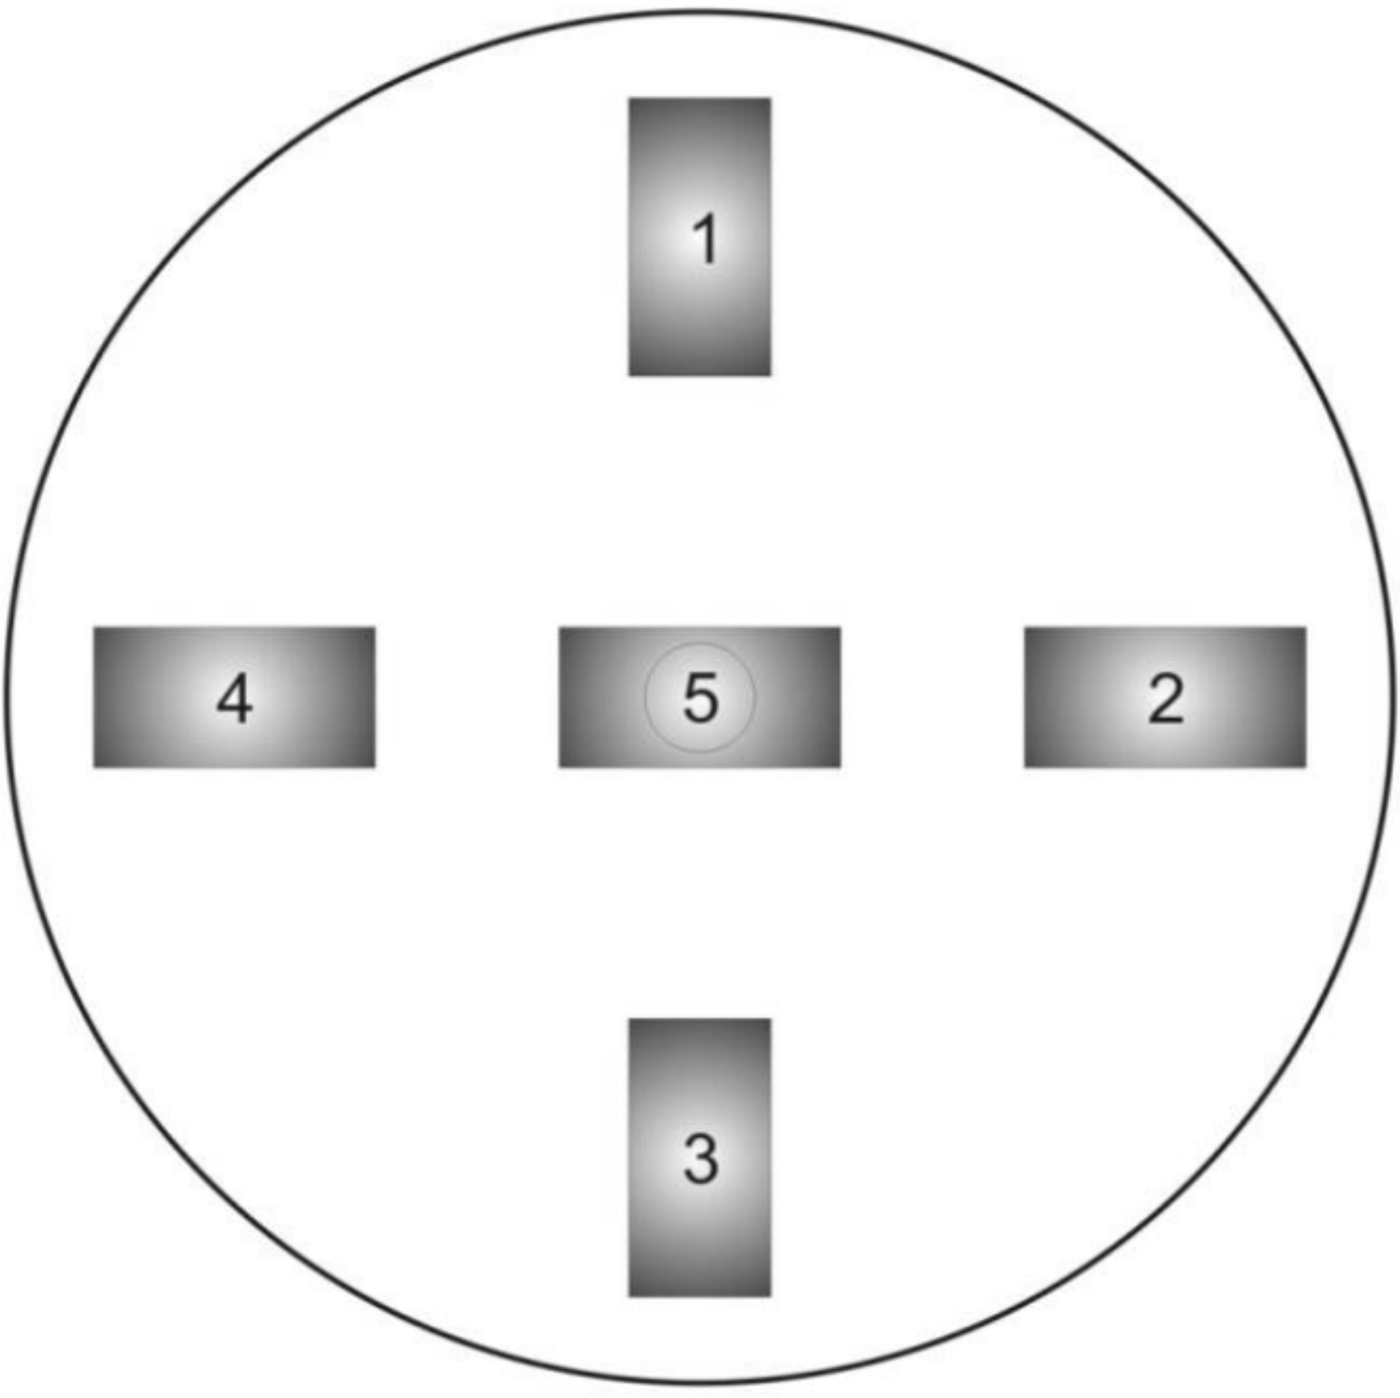
For the synergetic analysis of the resulting erosion products caused by the interaction of a pulsed plasma beam with a graphite target, the following experiment was made: Five graphite plates were chosen as the samples in order to analyze, the arrangement of which is shown in Figure 11. Samples No. 1–4 were located along the edges of the fluoroplastic substrate, and the middle sample No. 5 was placed in the center above the metal rod. At the bottom of the system, a container for collecting particles – products of erosion was placed.
Location of graphite plates.
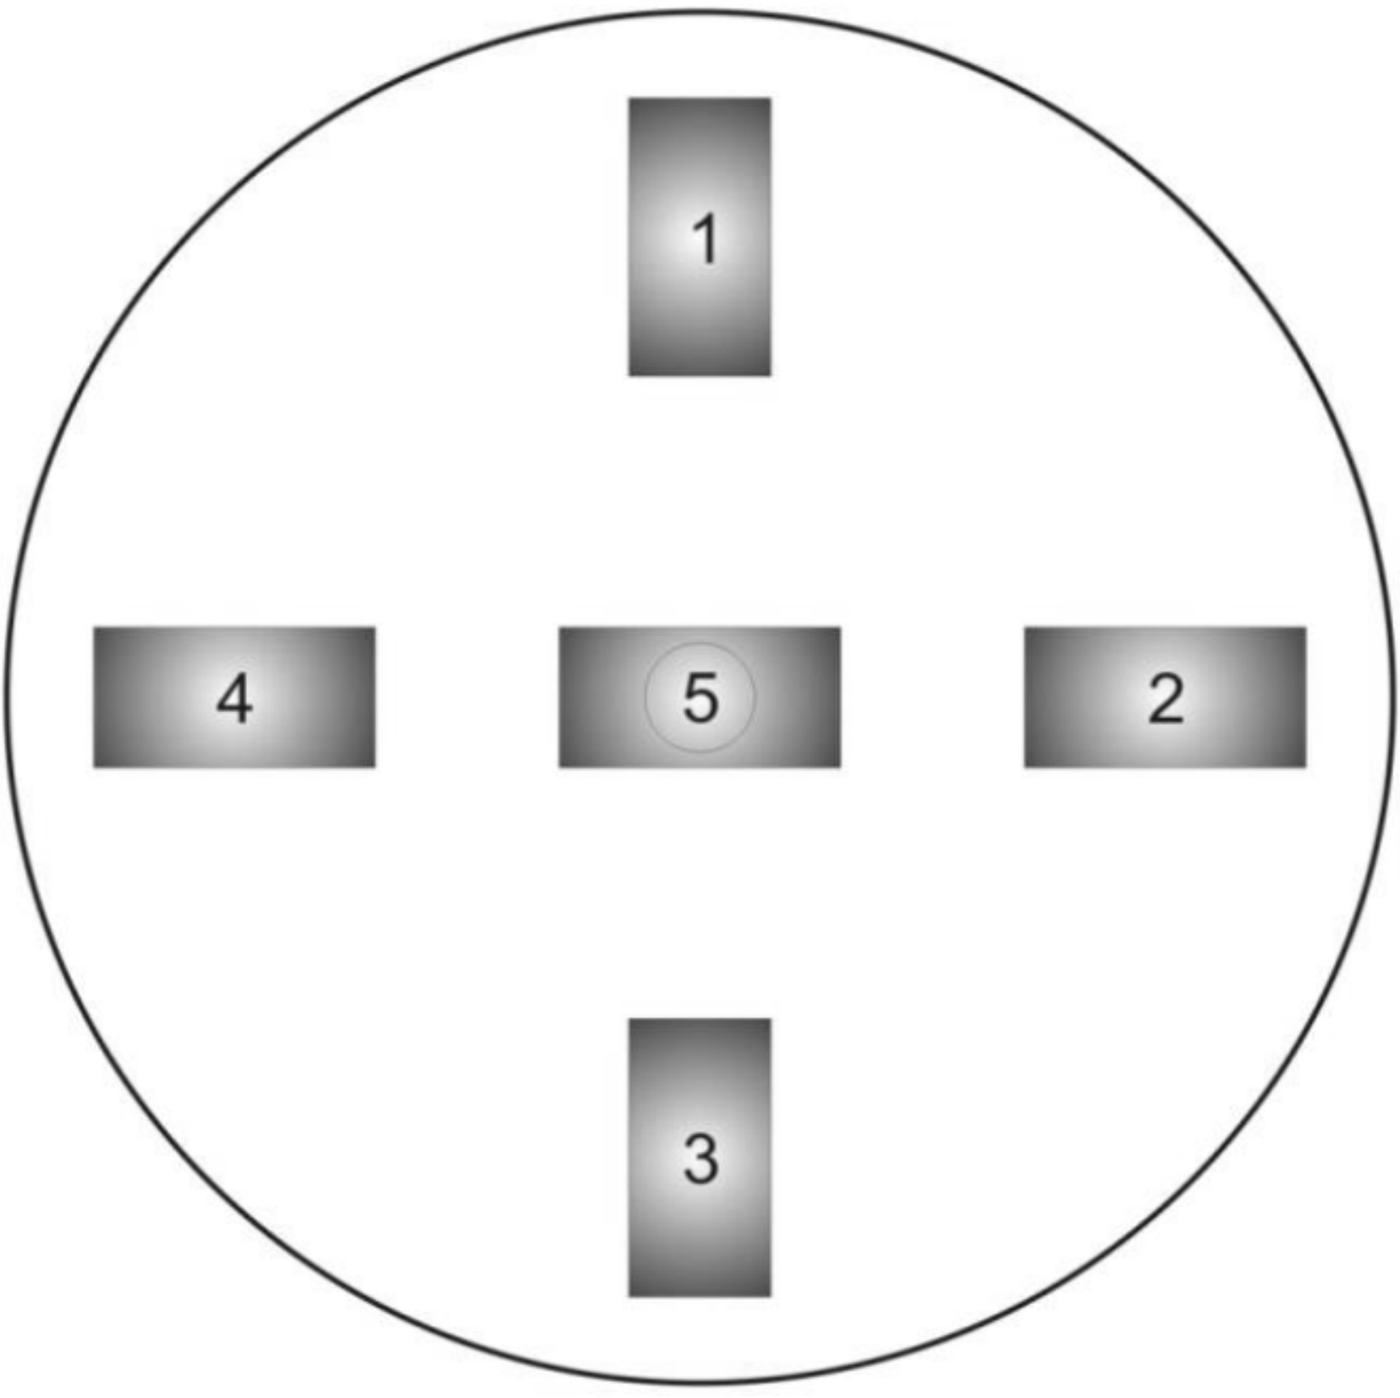
After interaction of graphite targets with pulsed plasma flow, target surfaces are subjected to erosion, resulting in the formation of dust particles. Further, using various methods of microscopy, the properties of the surface of graphite targets and collected particles were studied.
At this stage, the results of analysis of surface properties of graphite plates and erosion products obtained with the scanning electron microscope at different magnification magnitudes are presented.
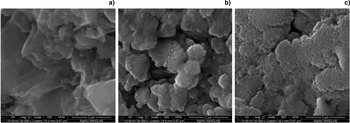
As can be seen from Figure 12a, the initial view of the graphite plate has a rough surface. After interaction with the pulsed plasma flow, the surfaces change, it is also noticeable that the surfaces of the graphite plates at the edges differ significantly from sample No. 5, which was located in the center of the substrate (Figs 12b and 12c).
The surface of graphite plate in 50 000 times magnification: (а) Initial sample; (b) samples No. 1–4; (c) sample No. 5.

At 10,000 times magnification, it is clearly seen that the surface of the samples after interaction with the pulsed plasma flow becomes smoother, roughness disappears (Figs 12b and 12c), and surfaces with fractal structures appear.
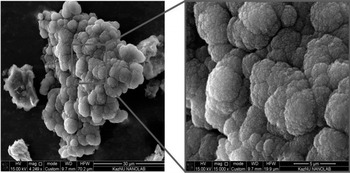
It is seen from Figures 12a and 12c, surfaces of the samples are porous and have a self-similar relief at scales from ~2 nm to ~10 µm. It should be noted that the graphite plates were subjected to 21 pulses of the plasma flow. Figure 13 shows the surface of the erosion products and, as can be seen from the figure, the surfaces of the obtained samples of the target material are also fractal. This fact indicates that particles, torn from the surface of graphite targets, are in plasma for some time, after which they acquire a fractal surface.
The surface of erosion products.

3.6. Analysis of Surfaces of Particles and Graphite Targets Using the Raman Spectrometer
It is known that the Raman spectroscopy is based on the ability of monochromatic light to scatter inelastically on the studied system. In this method of spectroscopy a beam with a certain wavelength is passed through a sample of the test substance and, upon contact with the sample, is scattered. The obtained rays are collected into a single beam using a lens and passed through a light filter separating weak (0.001% intensity) Raman rays from more intense (99.999%) Rayleigh rays. Raman rays are amplified and sent to the detector, which fixes the frequency of their oscillation (Ferrero et al., Reference Ferrero, Nakamoto and Brown2003). Our samples of graphite plates were studied using a Raman spectrometer NT-MDT NTegra Spectra with a laser wavelength of 473 nm.
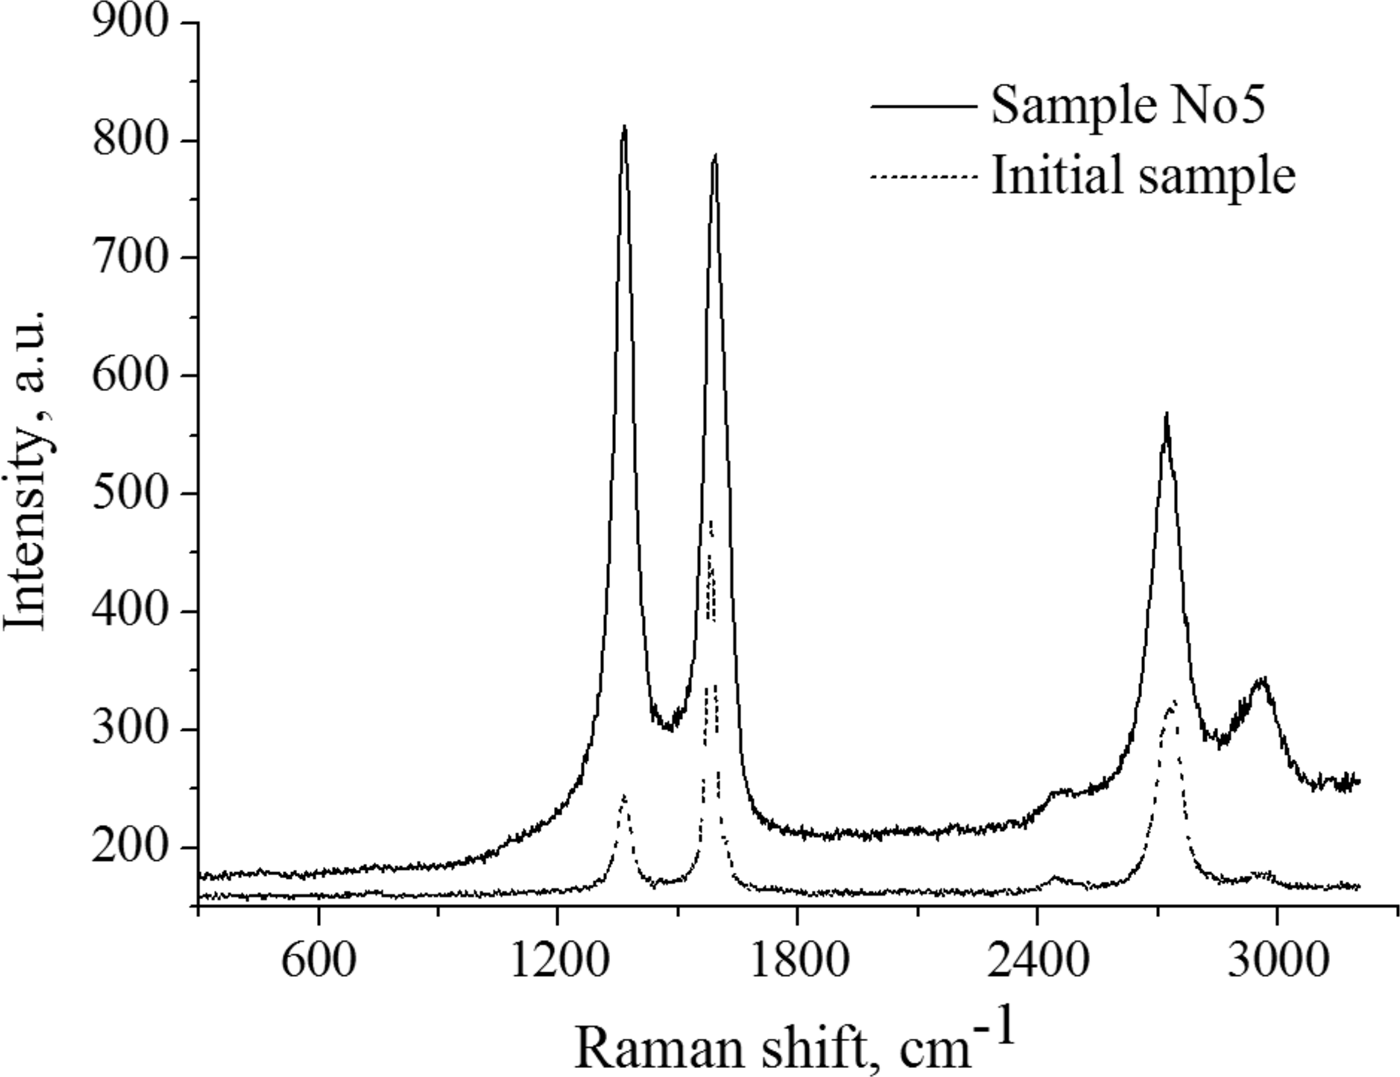
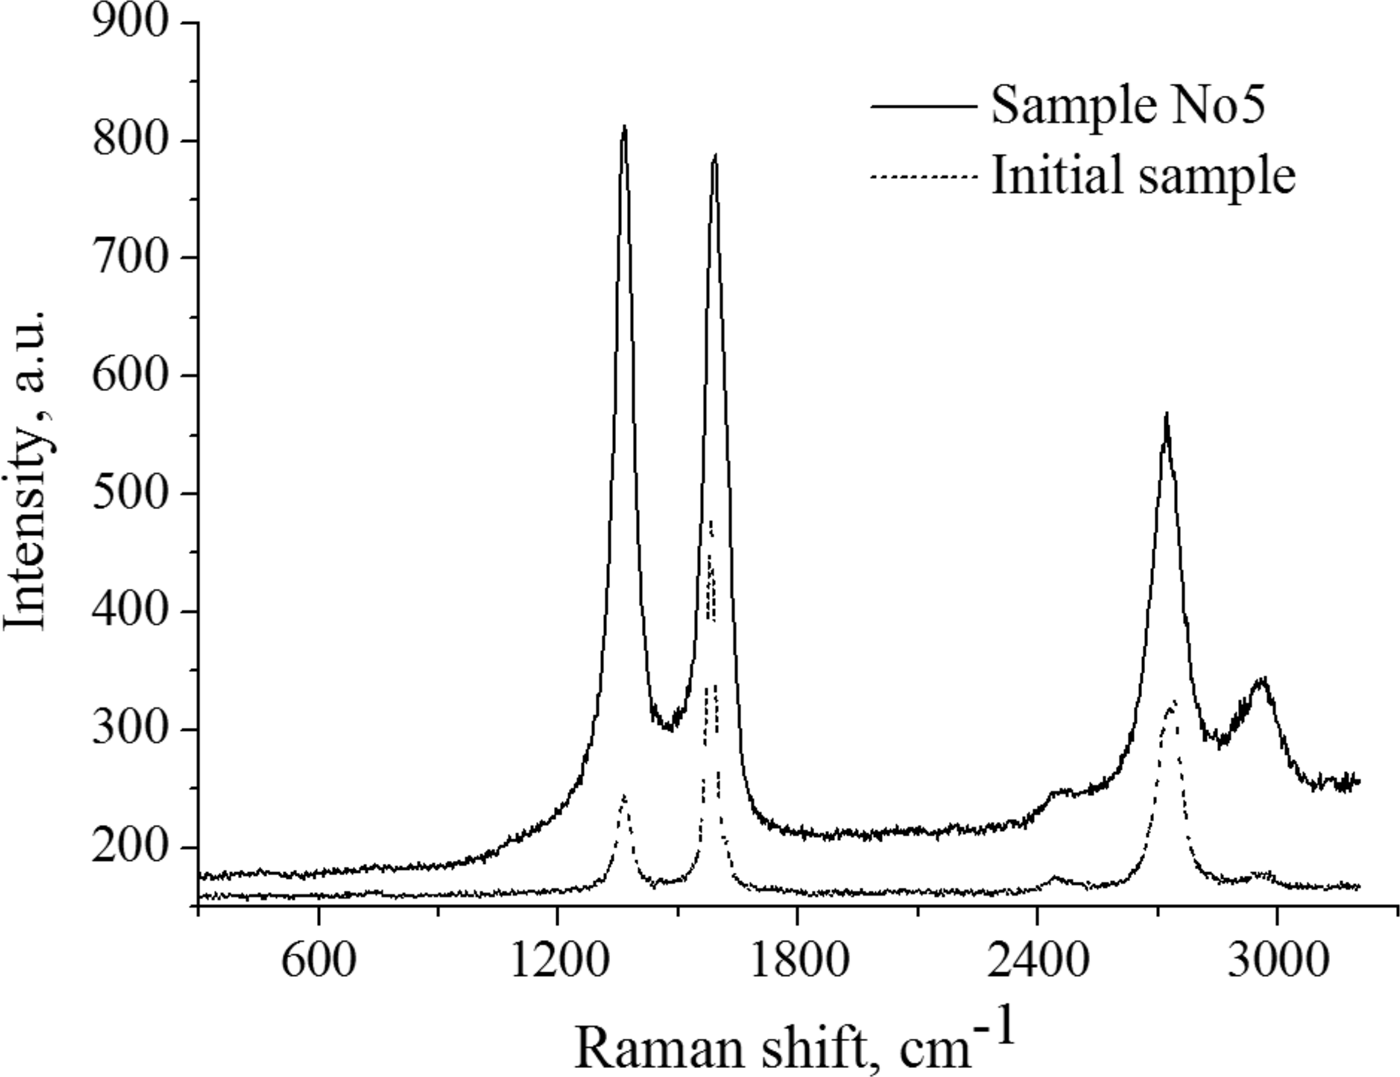
As is known, a typical graphite spectrum has three peaks: The first peak D, at 1351 cm−1 is called the “defective Raman zone”, which is due to inelastic Raman scattering on structural defects; the second peak G at 1580 cm−1 corresponds to the phonon spectrum of the graphite crystal near the center of the Brillouin zone (1580–1582 cm−1) (Reich et al., Reference Reich, Thomsen and Maultzsch2004); and the third peak of 2D at 2700 cm−1 having a compound nature (overtones), corresponds to the double frequency of the “defective Raman zone”. The ratio between the intensity of the peaks G (I G) and D (I D) gives an estimate of the defectiveness (I G/I D), and the I G/I 2D ratio estimates the defectiveness of the layers (Memon et al., Reference Memon, Tse, Al-Sharab, Yamaguchi, Goncalves, Kear, Jaluria, Andrei and Chhowalla2011; Baitinger et al., Reference Baitinger, Kovalev, Vekesser, Ryabkov and Victorov2013; Prihodko et al., Reference Prihodko, Lesbayev, Auelkhankyzy, Nazhipkyzy and Mansurov2014).
Figure 14 shows the Raman spectrum of the initial graphite, the position of the peak G (graphite) is 1582 cm−1, which is the tabulated value for pyrolytic graphite. The peak D (disorder) at 1360 cm−1, as mentioned above, is responsible for the structural defect and in the case of microcrystalline graphite its intensity increases with decreasing grain size.
Raman spectrum of the initial graphite sample.
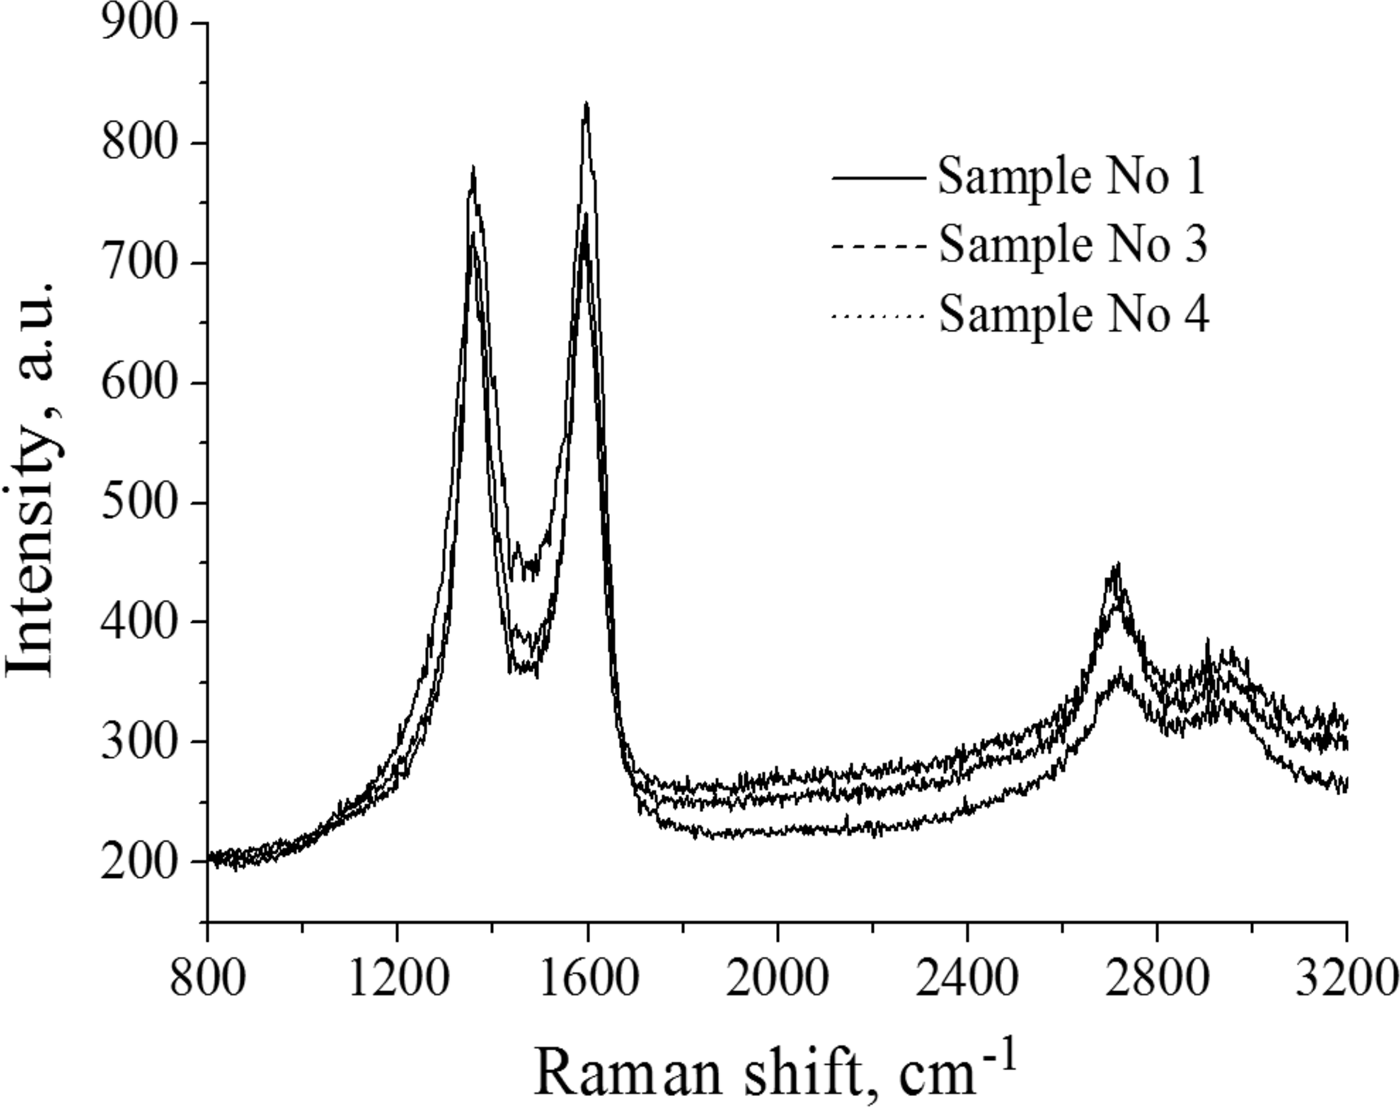
From the Raman spectra, it is seen that the surface of sample No. 1 is inhomogeneous. Figure 15 shows the Raman spectrum of the defect region of sample No. 1 (black line), which is characterized by an increase in the intensity of the peak D, the overall peak broadening and the shift of the G peak to the high-frequency region with a value of 1595 cm−1, indicating a certain degree of amorphous structure.
Raman spectrum of samples.
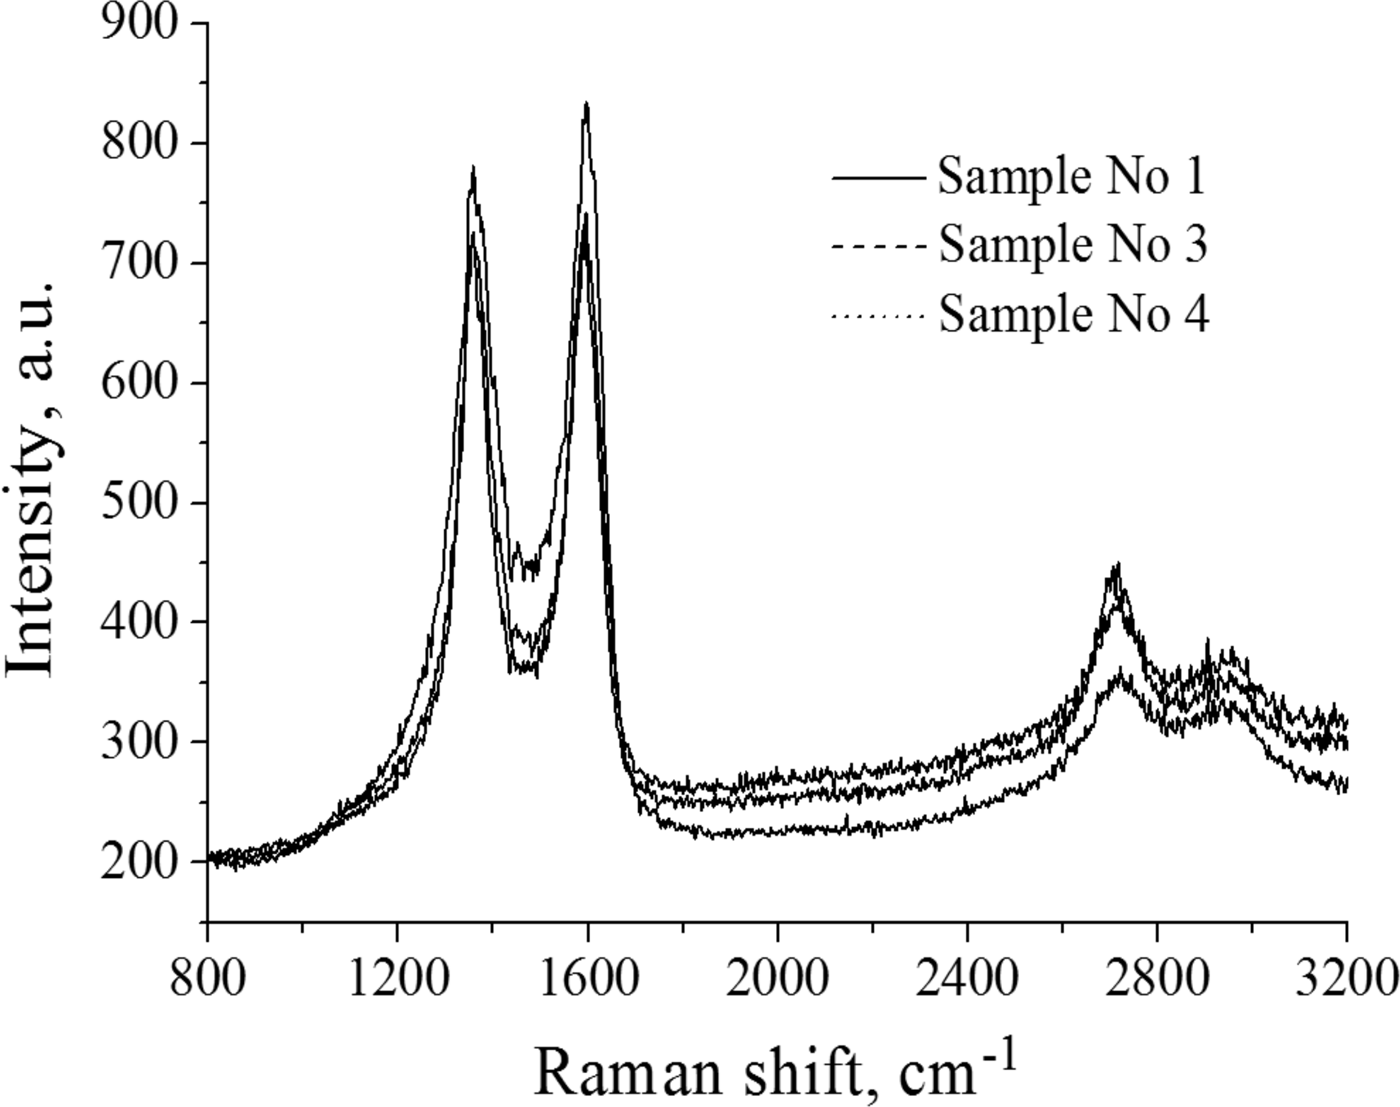
On the Raman spectrum of other samples, in comparison with the initial graphite, an increase in the defect peak D responsible for the structure disorder and broadening of the D and G peaks are observed. Along with defective regions, there are initial defect-free regions as in Figure 14.
Also, the degree of defectiveness (I G/I D) of each sample was determined from the spectra. From the spectrum of the original sample, I G/I D was 0.52. This means that this pyrolytic graphite has some defects, but basically, the ordering is preserved, as G peak is much higher than D one. After processing the samples with a pulsed plasma flow, the I G/I D increased to 0.94, that is, an increase in the number of defects was observed. Figure 14 shows the Raman spectrum of sample 5. It can be seen that the spectrum differs considerably from the spectra of samples No. 1–4 in that the D peak intensity lies above the G peak (I G/I D = 1.03) and an increase in the 2D peak is observed, which corresponds to the appearance some ordering in the layers.
4. CONCLUSION
The results of a study of dust formation processes regarding plasma–surface interaction in thermonuclear reactors on the basis of pulsed plasma accelerator are presented. The results of studying of dust formation during the interaction of a pulsed plasma beam with a graphite target were obtained using a high-speed Phantom camera v2512 with a maximum video recording rate of 677,000 frames per second. The speed of the pulsed plasma bunch and the diameter of the plasma cord were determined. It was also found that after interaction of the pulsed plasma flow with the surface of the candidate material, particles with different geometric shapes appear, including fractal, spherical and arbitrary shapes. Based on the results of the synergistic analysis of the erosion products, it was found that after interaction with the plasma flow, the target surface becomes amorphous, as evidenced by the D peak increase in the Raman spectrum of irradiated targets. Using the wire calorimeter, the energy properties of the pulsed plasma flow were determined. Based on the results of the experiments, the plasma beam energy density was 98 J/cm2 at a discharge voltage of 13 kV.
Data obtained from the experiments.

ACKNOWLEDGMENTS
This work was supported by the Ministry of Education and Science of Kazakhstan under Grant 3112/GF4.