Introduction
Instrumented indentation testing is a versatile tool commonly applied for measuring mechanical properties, such as hardness, Young’s modulus, and fracture toughness on a localized scale [Reference Oliver and Pharr1, Reference Oliver and Pharr2, Reference Hay and Pharr3, Reference Hay4, Reference Lawn and Marshall5]. In recent years, significant advances have been made, which have allowed the measurement of thermally activated processes using indentation testing [Reference Phani and Oliver6, Reference Maier, Durst, Mueller, Backes, Höppel and Göken7, Reference Maier, Merle, Göken and Durst8, Reference Mulhearn and Tabor9, Reference Durst and Maier10, Reference Maier, Leitner, Pippan and Kiener11, Reference Mayo, Siegel, Narayanasamy and Nix12, Reference Lafontaine, Yost and Black13]. Nanoindentation creep experiments play a significant role in determining the thermally activated properties on the nanoscale. The loading conditions for indentation creep tests reported in literature are fundamentally different from those for a conventional creep test, where deformation is observed under constant stress [Reference Phani and Oliver6, Reference Poisl, Oliver and Fabes14, Reference Caillard and Martin15]. The pioneers in the nanoindentation creep testing are Mulhearn and Tabor [Reference Mulhearn and Tabor9]. Later, the constant loading-rate test, which was proposed by Mayo and Nix [Reference Mayo and Nix16], enables an accurate determination of the strain rate sensitivity (SRS) m of the material. In the indentation load relaxation experiments [Reference Lafontaine, Yost and Black13], the position of the indenter is fixed after reaching a predetermined penetration depth and a decrease in the indentation load is monitored as a function of time. Nevertheless, it is rather difficult to keep the penetration depth constant, as a result of the continuous load and displacement change, which makes the analysis rather difficult [Reference Goodall and Clyne17]. The constant load test [Reference Mayo, Siegel, Narayanasamy and Nix12] is rather similar to the conventional uniaxial creep experiments. At the peak load, a change in hardness is found during the short dwell time. The strain rate can be determined from the displacement rate divided by the indentation depth  ${{\dot{h}} / h}$, and finally, the log–log plot of stress against strain rate helps to find the stress exponent n. Last, constant strain rate test, developed by Lucas and Oliver [Reference Lucas and Oliver18], proposes to control the indentation strain rate during the loading sequence by the means of the loading rate divided by load
 ${{\dot{P}} / P}$. Since multiple tests are performed, the changes in the hardness from test to test should be carefully considered in this method. With the strain rate jump (SRJ) method, the SRS can be determined from a single indentation test, by varying the indentation strain rate during certain depth ranges during the indentation [Reference Maier, Durst, Mueller, Backes, Höppel and Göken7]. Long-term indentation creep tests suffer from thermal drift influences, which can be overcome based on the dynamic stiffness, as has been shown by Goldsby and colleagues [Reference Rar, Sohn, Oliver, Goldsby, Tullis and Pharr19] and has been recently implemented in a method developed by Maier et al. [Reference Maier, Merle, Göken and Durst8]. Due to this, the dwell time of the experiment can be increased to several hours excluding any influence of thermal drift. Despite these improvements, the stress underneath the indenter tip decreases during long-term experiments, which leads in turn to stress relaxation [Reference Maier, Merle, Göken and Durst8, Reference Durst and Maier10].
The present work was initiated with the above challenges in mind. A new indentation creep testing method is proposed, where the mean contact pressure is kept constant. An approach of the proposed method is quite different from conventional indentation creep experiments, where the load on the sample is kept constant and the hardness is constantly decreasing due to the increasing contact depth/area. By using the contact stiffness for controlling the experiments, thermal drift correction is also considered, and effects from pile-up or sink-in on the determination of the contact area do not affect the results of the presented method.
For the method development, ultrafine-grained (UFG) materials CuZn5 and CuZn30 after high-pressure torsion (HPT) have been used [Reference Bruder, Braun, ur Rehman, Marceau, Taylor, Pippan and Durst20]. In contrast to single crystalline materials, the UFG materials do not exhibit a strong indentation size effect (ISE) [Reference Backes, Huang, Göken and Durst21, Reference Durst, Backes and Göken22]. At larger indentation depths, many thousand grains are deformed and the hardness stays constant with the increase in indentation depth for a given indentation strain rate. Thus, the material hardness is in a steady-state condition [Reference Maier, Durst, Mueller, Backes, Höppel and Göken7, Reference Durst and Maier10, Reference Bruder, Braun, ur Rehman, Marceau, Taylor, Pippan and Durst20].
Constant contact pressure method—theoretical background
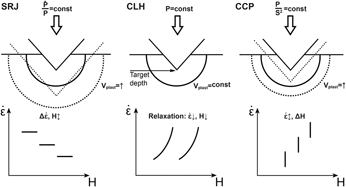
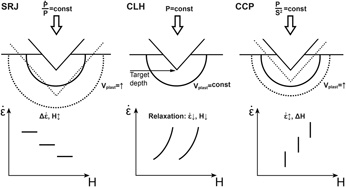
Figure 1 schematically illustrates the contact geometry with the plastic zone underneath the indenter, as well as indentation strains for the SRJ and load–hold indentation creep method [Reference Maier, Merle, Göken and Durst8], in comparison with the new constant contact pressure (CCP) method.
Schematic illustration of the resulting strain rate and plastic zone volume V plast evolution underneath an indenter during SRJ, CLH, and CCP tests.

During SRJ tests [Fig. 1(a)], the indentation rate  $\left( {{\dot{P}} / 2P}} \right)$ is controlled after the target depth is reached. During a single indentation, appropriate changes in strain rate can be performed up to a target depth over a short time, which significantly reduces thermal drift effects. After a jump, the plastic zone extends further, leading at the same time to a material-dependent transient in hardness [Reference Maier-Kiener, An, Li, Zhang, Pippan and Durst23]. The SRS is then simply determined from the constant hardness values at each strain rate. Since the new strain rate is reached very fast, a minimal transient period can be found. However, due to the control of the strain rate during the experiment, only strain rates down to 10−3 s−1 can be kept constant.
In the constant load–hold (CLH) method, the load is fixed and held constant (P = constant) during a prescribed time period, after reaching a predetermined target depth value [Fig. 1(b)]. Since the applied load is held constant, the indentation depth and thereby the size of the plastic zone vary only slightly with time and mainly relaxation takes place. The tip sinks slightly into the material and the hardness as well as the applied mean contact pressure decrease until a further displacement into the surface is no longer detectable. The method has the advantage that low strain rate down to 10−6 s−1 can be achieved. However, during the test, the material is in a transient condition and a steady state is never reached.
In the CCP method after reaching the target depth value, a fixed mean contact pressure value (hardness value) is held constant [Fig. 1(c)]. Any increase in the size of the contact leads to an increase in the load to keep the stress level constant. With the increasing indentation depth, also the plastic zone is expanding until a steady state in indentation strain rate is reached. Which also leads to a more significant increase in the indentation depth compared to CLH. The indentation strain rate is declining during that time period until the prescribed mean contact pressure (hardness) and a constant strain rate is achieved. Since the mean contact pressure is used to control the experiments, also small strain rates down to 10−6 s−1 can be achieved with this method.
To prevent pile-up and thermal drift effects [Reference Durst and Maier10, Reference Bolshakov and Pharr24] for the final result determined from the CLH and CCP methods, the contact pressure (hardness) is calculated based on Sneddon’s equation [Eq. (1)] [Reference Oliver and Pharr1, Reference King25], which was not done in the original SRJ method. Therefore, through this paper, the Sneddon’s hardness is also calculated for the SRJ test, based on the harmonic contact stiffness S:
 $$S = {{2\beta } \over {\sqrt \pi }} \cdot {E_{\rm{R}}} \cdot \sqrt {{A_{\rm{c}}}} \quad ,$$
where E r is the reduced modulus, A c is a contact area, and β is a constant, which depends on the geometry of the indenter [Reference Oliver and Pharr1, Reference King25].
Extracting the contact area A c from Eq. (1), the pile-up corrected hardness, based on the thermal drift independent contact stiffness channel, can be presented as:
 $$H = {P \over {{A_{\rm{C}}}}} = P \cdot {{4 \cdot {\beta ^2}} \over \pi } \cdot {{E_{\rm{R}}^{\rm{2}}} \over {{S^2}}}\quad ,$$
where P is the applied load.
In the CCP experiments, the main controlling parameter is the set mean contact pressure (or hardness value), which is kept constant over the whole creep part. At the beginning of the creep segment, to achieve the set mean contact pressure value, a transient in hardness takes place. Therefore, only the segment with a constant hardness value is taken into account.
By knowing the contact area and the tip area function, the contact depth is given as follows:
 $$h = {h_{\rm{c}}} + \varepsilon \cdot {P \over S}\quad ,$$
where ε is a constant that depends on the indenter geometry, which for a Berkovich tip ε = 0.75 [Reference Hay and Pharr3, Reference Maier, Merle, Göken and Durst8].
The strain rate was calculated according to Nix and Mayo [Reference Mayo and Nix16], i.e., the indentation strain rate  $\dot{\varepsilon }$ is the time derivative of the indentation depth
 $\dot{h}$ or the applied load
 $\dot{P}$ divided by the indentation depth h or the applied load P [Eq. (4)] [Reference Mulhearn and Tabor9, Reference Lucas and Oliver18].
 $$\dot{\varepsilon } = {{\dot{h}} \over h} = {1 \over 2}\left( {{{\dot{P}} \over P} - {{\dot{H}} \over H}} \right) \approx {1 \over 2}{{\dot{P}} \over P}\quad .$$
The SRS and activation volume are calculated with Eqs. (5) and (6) [Reference Maier, Durst, Mueller, Backes, Höppel and Göken7, Reference Maier, Merle, Göken and Durst8]:
 $$m = {{{\rm{d}}\left( {\ln H} \right)} \over {{\rm{d}}\left( {\ln \dot{\varepsilon }} \right)}}\quad ,$$
 $$A = C \cdot \sqrt 3 kT \cdot \left( {{{{\rm{d}}\left( {\ln \dot{\varepsilon }} \right)} \over {{\rm{d}}H}}} \right)\quad ,$$
where C is a constrain factor, k is the Boltzmann constant, and T is a temperature.
Results and discussion
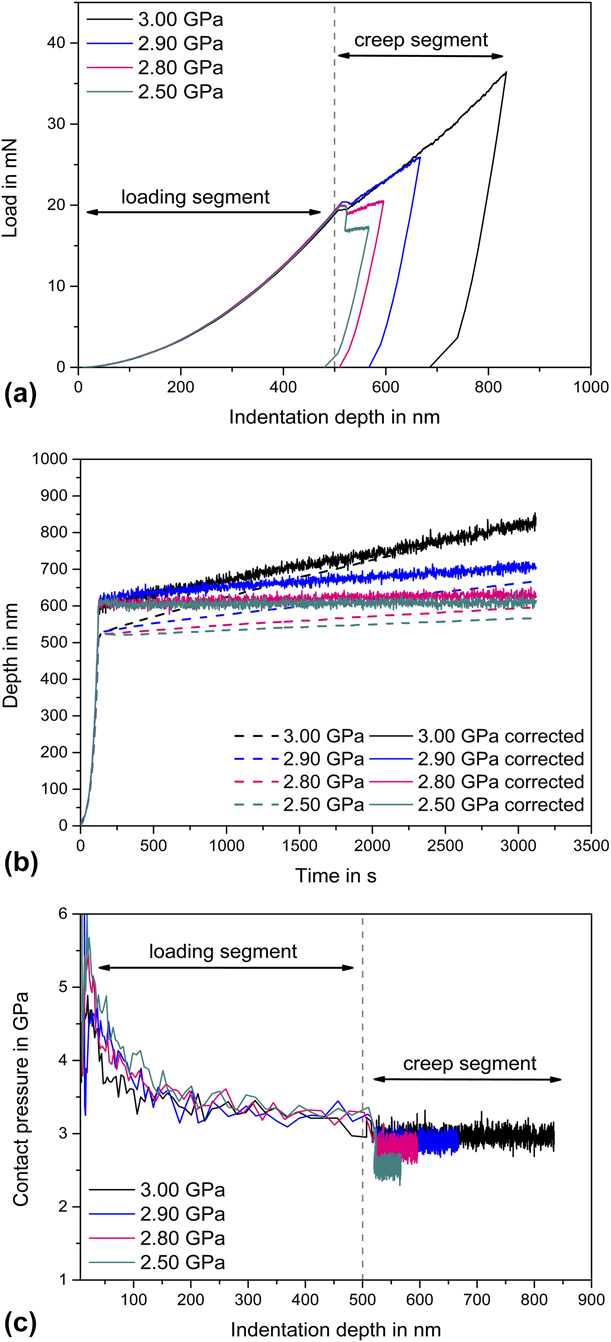
In Fig. 2, the general approach of the CCP test is shown for UFG CuZn30 for different contact pressures of 3.0, 2.9, 2.8, and 2.5 GPa. The initial loading segment for the CCP tests was performed under strain rate control up to a target indentation depth of 500 nm [Fig. 2(a)]. All indentation tests overlap during the initial test segment and a constant depth independent hardness level of 3.1 GPa is reached at an indentation depth of approximately 400 nm [Fig. 2(c)]. As soon as the target depth is reached, the control software is switched to the CCP test, in which Sneddon’s hardness [Eq. (2)] is kept constant at the chosen values, by controlling the P/S 2 signal [Fig. 2(c); raw hardness values at CCP segment]. Switching to a lower mean contact pressures leads to a transient regime until a CCP is held for a certain time period. If the contact stiffness increases with time due to, e.g., creep effects, the machine adjusts the load level accordingly [Fig. 2(a)]. The required adjustment of the load and the loading rate therefore depends on the set P/S 2 or CCP values. To keep the mean CCP constant at a high level (3.0 GPa), a higher loading rate is required as compared with the lower CCP of 2.5 GPa [Fig. 2(a)]. During the CCP segment, the indentation depth and the corrected indentation depth [Eq. (3)] are continuously recorded [Fig. 2(b)]. The depth correction with Eq. (3) is required to account for the thermal drift effect during the long-time creep experiments [Fig. 2(b)]. The strain rate  $\dot{\varepsilon }$ during the CCP test is then calculated using
 ${{\dot{h}} / h}$ Eq. (4). The strain rate analysis in the current work is based on
 ${{\dot{h}} / h}$, since the channel provide the smallest noise level.
 ${{\dot{P}} / P}$ and
 ${{\dot{S}} / S}$ provide the same strain rate levels. The resulting true indentation depth and load data as well as the hardness values were fitted with a three-parameter power-law function to smooth the raw data. The initial part of the creep segment, where slight unloading is observed, was excluded from the analysis.
The CCP experiments on the UFG CuZn30: (a) load versus depth, (b) raw indentation and corrected indentation depth versus time, and (c) contact pressure versus time.

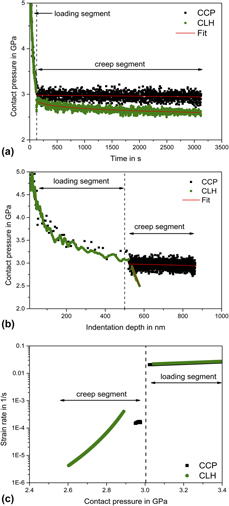
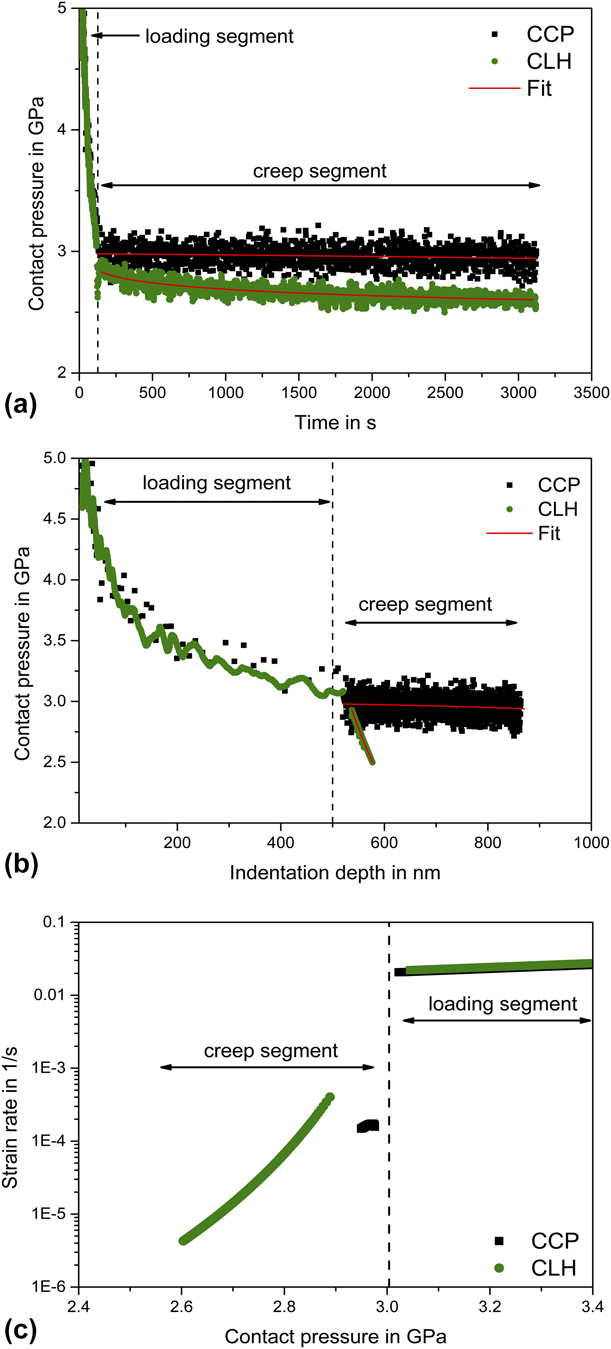
Next, the CCP results are compared with the CLH test results (Fig. 3). During the approach segment, both CLH and CCP tests run with the same CSR (constant strain rate) parameters, using the same strain rate value and target depth [Figs. 3(b) and 3(c)]. The starting conditions for the two test approaches are thus the same. At the beginning of the CCP segment, some time is needed to reach the set contact pressure, whereas in the CLH segment the contact pressure evaluation starts from the very beginning of the creep segment [Fig. 3(b)]. This leads to a difference in the contact pressure values at the start of the creep segment [Figs. 3(a)–3(c)]. It is also quite apparent that the contact pressure value in the CCP method is constant during the whole creep segment and a significant increase in indentation depth is found with time [Fig. 3(b)]. The CLH test, however, shows a declining contact pressure value and only a limited increase in indentation depth. Figure 3(c) shows the evaluation of the data by analyzing the strain rate as a function of the contact pressure throughout the indentation test. In the loading segment, until reaching the target depth, a decline in hardness due to the initial ISE is found. However, the hardness is relatively constant at a depth of larger than 300 nm and the ISE does not play a role in the creep segment. In the CLH test segment, the hardness and the indentation strain rate are continuously dropping and neither contact pressure nor hardness value reaches a steady state. In the CCP test, however, the strain rate and the contact pressure are constant after a certain time period.
(a) Raw contact pressure values versus time, (b) raw contact pressure values versus indentation depth, and (c) strain rate versus contact pressure for CCP and CLH experiments of the UFG CuZn30.
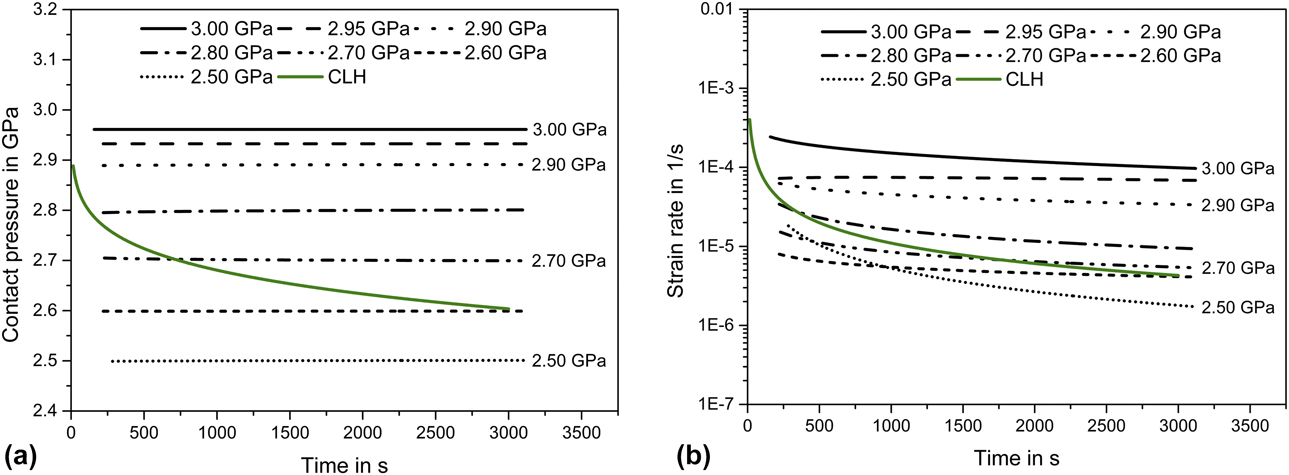
In Figs. 4(a) and 4(b), results from the CCP tests at different contact pressure levels are compared with the results of a load–hold indentation experiment at a load of 20 mN, analyzing only the test segment results. The CLH experiment was performed at the same target depth of 500 nm, and the load level at that indentation depth was kept constant. The strain rates for all experiments have been evaluated according to Eq. (4) and are plotted in Figs. 4(a) and 4(b).
(a) Evaluated contact pressure data for the CLH and CCP experiments versus time and (b) strain rate versus time on the UFG CuZn30.
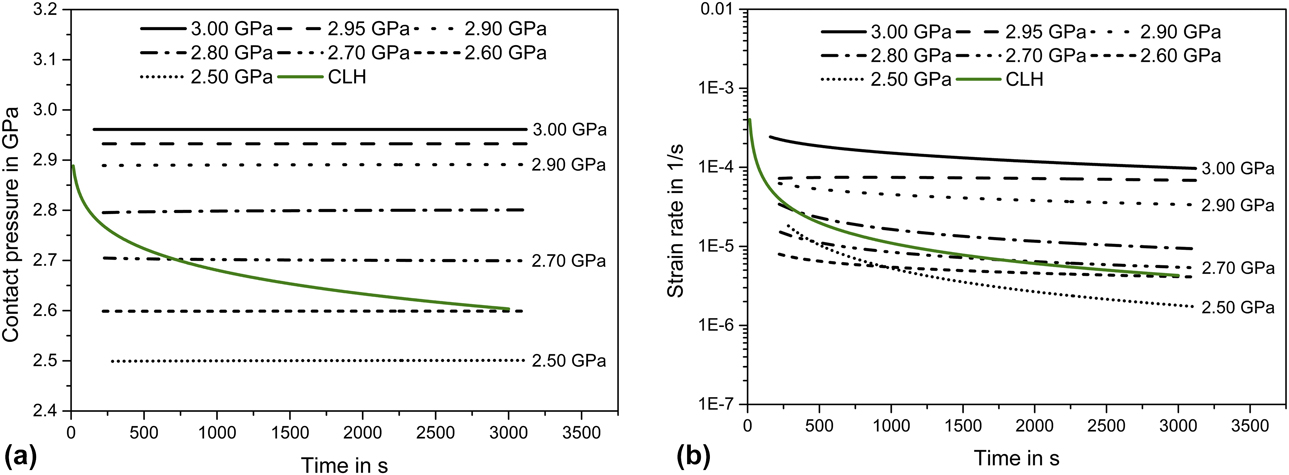
The hardness for the CLH experiments starts at a higher value and continuously declines, crossing the values from the CCP tests [Fig. 4(a)]. The same applies to the strain rates, which are initially relatively high for the CLH test and continuously decrease with time. The strain rates during the CCP test initially decrease slightly and reach a certain saturation level after a short time period, which depends on the set contact pressure value. The strain rates during the CLH test and the contact pressure thereby cross the values found during the CCP test [Figs. 4(a) and 4(b)].
Even though the contact pressure is kept constant at 2.5 GPa, the strain rate at this contact pressure exhibits a similar decline as in the CLH test. This means that at this low contact pressure, a similar relaxation process is taking place as in the CLH experiment, which will be discussed later on.
From the data on contact pressure and strain rate, it can be concluded that in the CLH test, the stress in the material is continuously decreasing, resulting in a transient behavior of the strain rate, which still continuous after a creep time of 3000 s. Therefore, a steady-state condition is never achieved, and all reported data stem from transient in the creep behavior at reduced mean contact pressures. In the CCP method, a plateau in strain rate is reached after 1500 s (for high contact pressures). Apparently, in the CCP test, the applied stress in the material is controlled and the material reaches a steady-state condition at a nearly constant deformation rate.
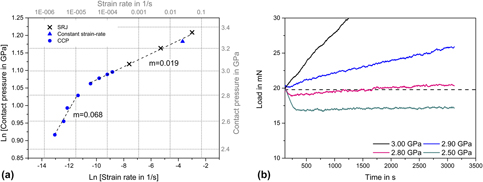
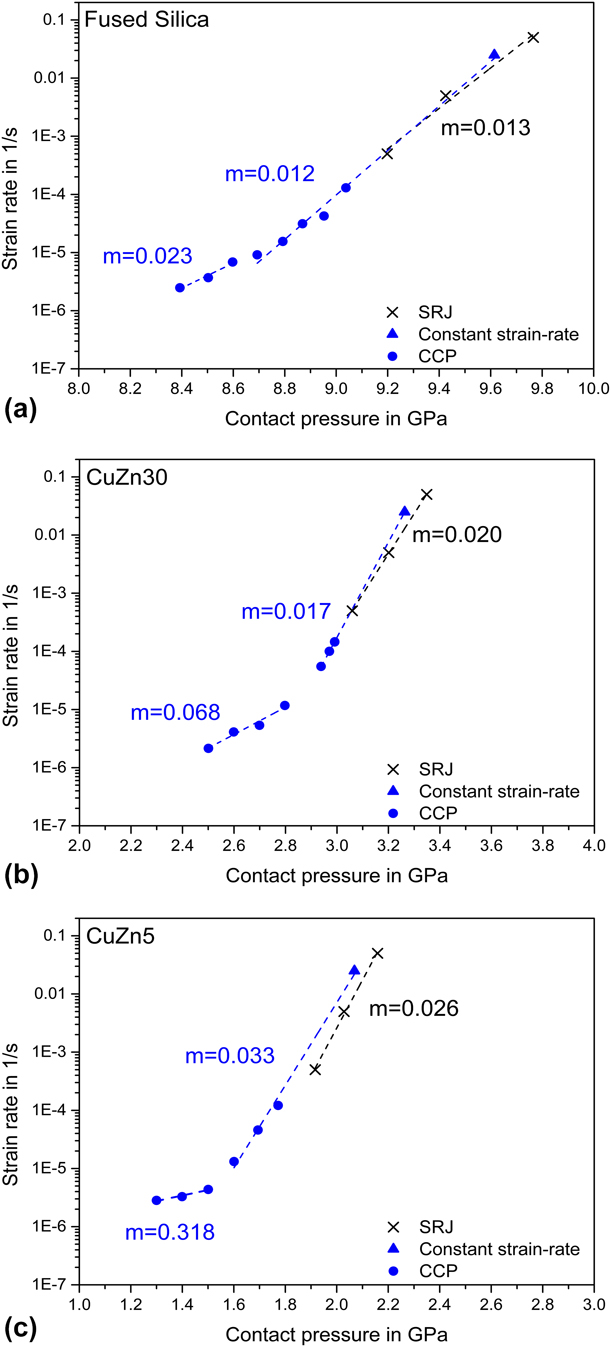
In Fig. 5(a), the strain rates that were obtained from the CCP are compared with the results from SRJ tests, analyzing the hardness values at different strain rates in a log/log plot. The SRS m is there simply given as the slope in the diagram. It was found that the m value is constant for a wide range of contact pressures and strain rates, and the results of SRJ and CCP tests nicely overlap with each other. The SRS is constant for contact pressures between 2.90 and 3.35 GPa, and strain rates are in the range of 1.0 × 10⁻¹ s−1 to 2.9 × 10⁻⁵ s−1. At lower contact pressures, a change in the m value is observed. Apparently, the deformation behavior and the deformation condition during the CCP test are changing. This can be understood by analyzing the load versus time data at different contact pressure values [Fig. 5(b)].
(a) SRS m of CuZn30, based on SRJ and CCP tests. The contact pressure in the initial loading segment of the CCP experiment is marked as constant strain rate. (b) Corresponding load versus time plot for different contact pressures. The dashed line represents the load at the target depth.
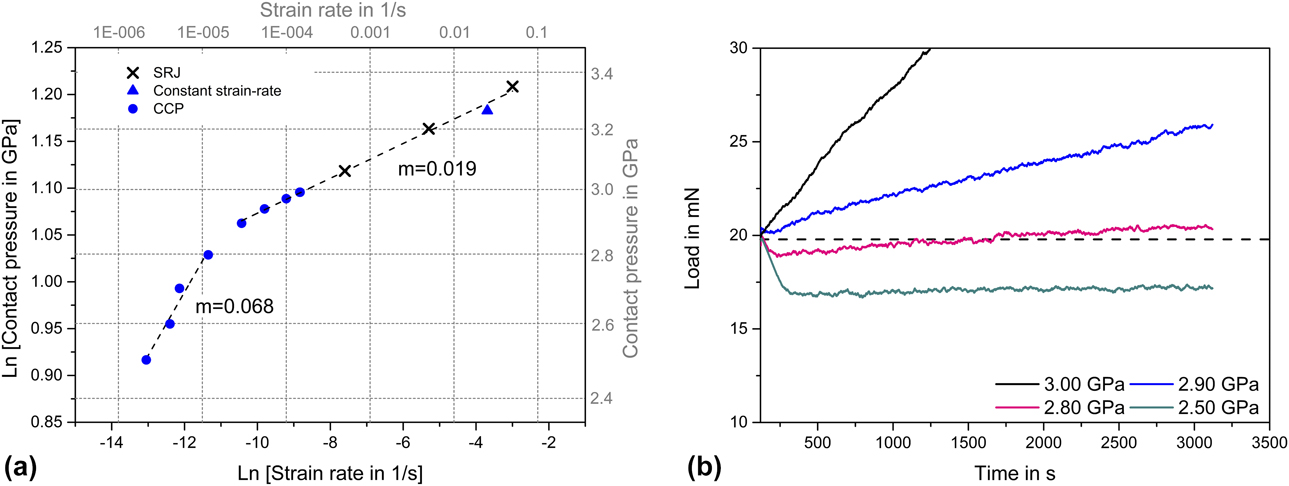
A small drop in load can take place even at high hardness values of 3 GPa, and with the decrease in the applied contact pressure (2.5 GPa), this drop becomes more pronounced. The contact stiffness remains constant during this small drop (unloading segment) due to an elastic recovery of the material. At very low contact pressure values, the plastic zone extends negligible and the test condition is changing from CCP to CLH. After transition, the continuously increasing load can be observed, even for low contact pressure values. The system keeps the mean stress underneath the tip constant, and indentation depth increases slightly to keep contact pressure invariable and as a result CCP (hardness values).
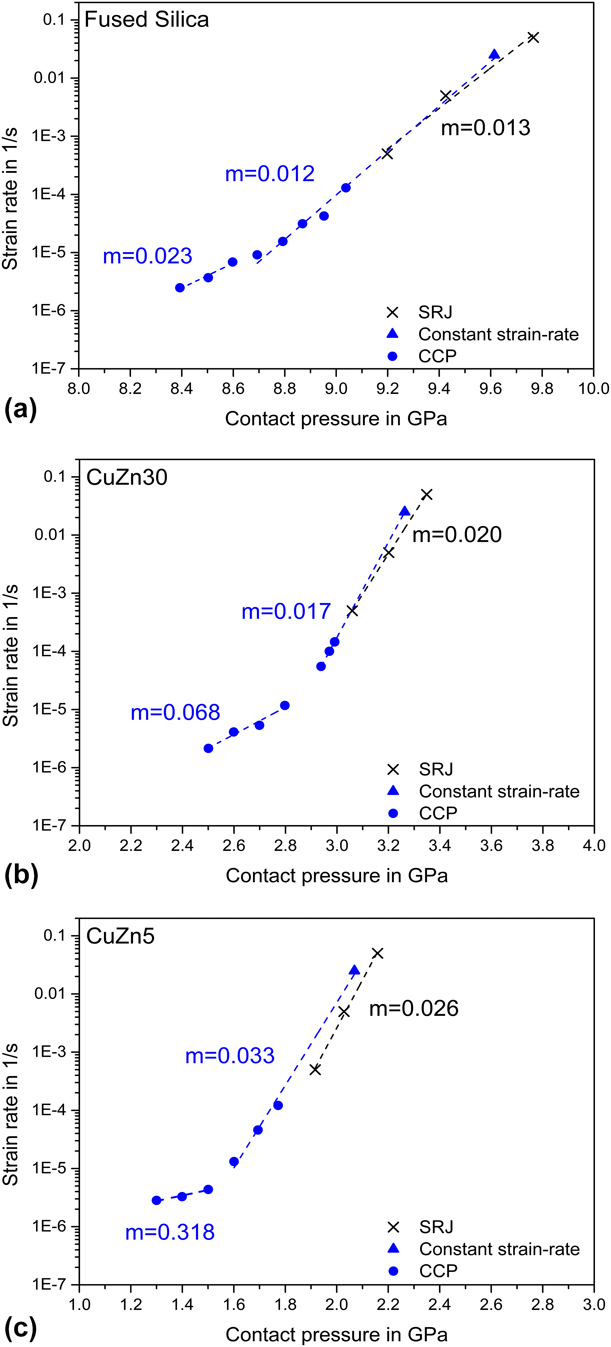
In the following analysis, the results of CCP, CLH experiments, and SRJ tests are compared for fused silica (FQ) and HPT CuZn5 and CuZn30. The hardness values from the SRJ test can be overestimated due to pile-up effects, which were not considered in the original analysis [Reference Bolshakov and Pharr24]. Therefore, in the current data set, Sneddon’s equation [Eq. (2)] was applied, similar to the CLH and CCP experiments. Generally, the strain rates (Fig. 6) from the CCP for all tested materials are lower than those applied during SRJ by one order of magnitude. The cause of this difference can be found in the method sequence. It was reported [Reference Chen, Shen, Liu, Beake, Shi, Wang, Zhang and Guo26] that high strain rates lead to a higher dislocation density. Since the standard CSM is used with the standard strain rate (0.025 s−1) to reach target depth, after which the control mode is changed and as it was mentioned earlier a small unloading can take place in the meantime, leading to dislocation annihilation and rearrangement. Strain rates found during the CCP tests for the all samples (Fig. 6) are in good accordance with the low strain rates in the SRJ experiments. Nevertheless, the maximum contact pressure which can be achieved and kept constant during CCP test is slightly lower in comparison to the SRJ tests. In contrast to the CLH test, where relaxation takes place, the evaluated strain rates from the CCP method approach a plateau value after a short transient time. Thus, a steady-state condition is reached. For all tested materials, also a change in the SRS exponent is found for lower contact pressures. For keeping the low contact pressure, the applied indentation load is reduced by roughly 20%. The depth of the indentation is only slightly increasing and the load level is approaching the initial indentation load. For these test conditions, the expansion of the plastic zone is strongly reduced and mainly relaxation processes within the plastic zone are taking place, leading to a much higher rate sensitivity of the material. This change in deformation condition appears at strain rates between 10−5 and 10−6s−1, which cannot be controlled in SRJ experiments.
Results from nanoindentation CCP, CLH, and SRJ test of (a) fused Silica, (b) HPT CuZn30, and (c) HPT CuZn5.
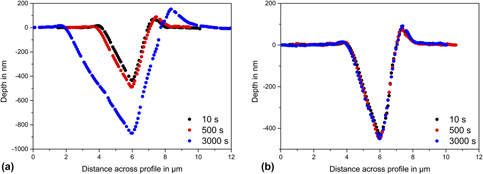
To analyze the expansion process of the plastic zone, the residual indentation depths after CLH at an applied load of 20 mN and CCP at a contact pressure of 3 GPa were determined using a 3D-LASER scanning microscope (LEXT OLS4000, Olympus, Pennsylvania, USA). Depth profiles after different creep times were investigated and the depth increase is plotted in Figs. 7(a) and 7(b). Depth increase in the CCP test after the 3000 s of creep is around 440 nm, and for the CLH, it is only 20 nm using the same contact pressure value. Nevertheless, the depth profile analysis can show only the general tendency of the depth increase, because the average depth increase can vary from indent to indent.
Depth profiles after (a) CCP and (b) CLH experiments on CuZn30.
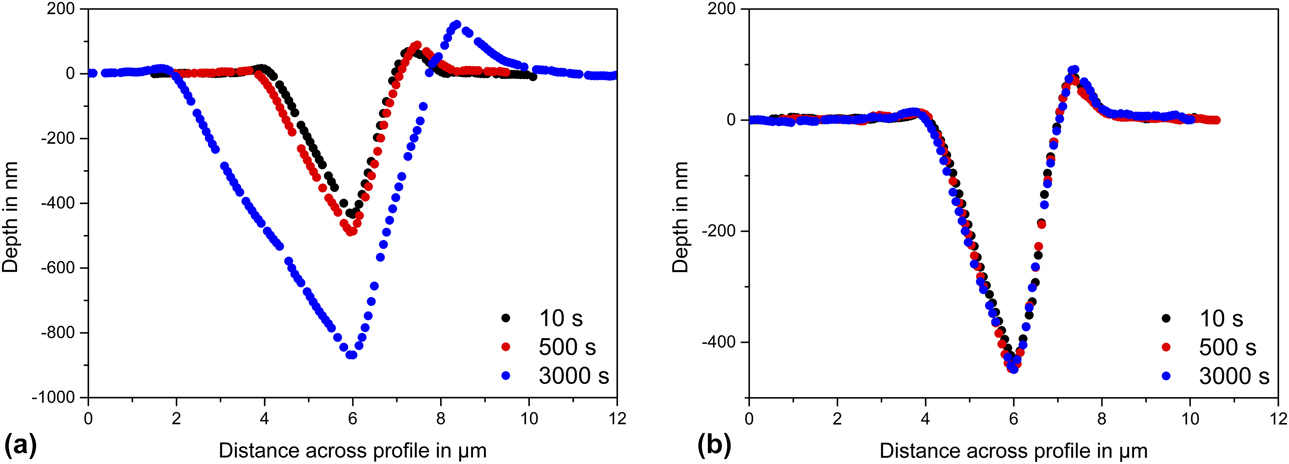
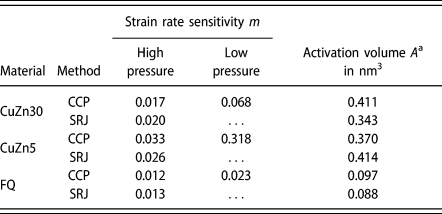
Table I gives an overview of the obtained activation volume and SRS. It is not fully clear that only one mechanism is contributing to the thermal activation, and therefore, the activation volumes numbers are only representative of the material response under the described testing condition. The SRS exponent m of 0.12 was found for the FQ in CCP experiment and activation volume around 0.088 nm3, which is in good agreement with the literature data. Zehnder et al. determined the mvalue of 0.0143 and an activation volume of 0.0793 nm3 [Reference Zehnder, Bruns, Peltzer, Durst, Korte-Kerzel and Möncke27]. Bruder et al. reported m values of 0.028 and 0.018 for CuZn5 and CuZn30, respectively [Reference Bruder, Braun, ur Rehman, Marceau, Taylor, Pippan and Durst20]. Besides the well-reproduced m values at high stresses, also the data at low contact pressures are presented. Here a strong increase in m as well as activation volume at a CCP is found. During the lower stress values, the plastic zone is only slightly expanding and the higher m values obtained are thought to be representative for relaxation processes taking place within the plastic zone. The interpretation of the different deformation regimes for the different materials is beyond the scope of the current publication but opens new directions for further future research.
SRS m and activation volume A obtained by nanoindentation for HPT CuZn30, HPT CuZn5, and FQ in this study.

a Calculated for the high contact pressures.
Conclusion
A new long-term nanoindentation creep method based on the constant contact pressure has been developed. In contrast to the already existing CLH creep method, CCP method is controlled by P/S 2. Constant stress can be hold over an extended period of time due to the minimization of the thermal drift effects. Moreover, an applied stress levels can be controlled. This method gives a possibility to study the deformation resistance of the material at various stress levels and strain rates several magnitudes smaller than during SRJ test can be achieved.
The method has provided SRS data from CuZn30, CuZn5, and FQ. The strain rates obtained from the CCP experiment lie between 5 × 10⁻⁴ and 5 × 10⁻⁶ s−1 depending on the applied stress level. Using the CCP method, slow strain rates with constant stress levels can be held for a long period of time. On the other hand, for the SRJ experiments, a longer time is required to achieve the slow strain rate, which can be crucial due to the thermal drift effect. SRS values for the CuZn30, CuZn5, and FQ were found to be 0.017, 0.033, and 0.012 at high stress levels, respectively, which is in good accordance with the obtained results from the SRJ method. At lower stress values, we find a higher SRS for all materials, indicating a different deformation regime. The CCP method opens new possibilities in assessing the deformation and creep mechanism at constant contact stresses over a wide range of strain rates.
Materials and sample preparation
The materials used in this study were FQ, UFG CuZn30 (29.4 at.% Zn), and UFG CuZn5 (4.87 at.% Zn). The UFG copper-based solid solutions were selected since they show a strain rate sensitive behavior at room temperature [Reference Maier, Durst, Mueller, Backes, Höppel and Göken7, Reference Maier, Merle, Göken and Durst8, Reference Bruder, Braun, ur Rehman, Marceau, Taylor, Pippan and Durst20]. Fused silica is generally used as a reference material for tip-shape calibration, as it shows a large elastic recovery without any pile-up. The CuZn30 and CuZn5 samples were processed by HPT using samples in the form of solid disks.
Nanoindentation experiments were performed with a Nanoindenter G200 (Keysight Technologies) equipped with a three-sided Berkovich indenter tip. The machine stiffness and the tip shape calibrations were performed in accordance with the Oliver–Pharr method [Reference Hay4]. The samples were ground and diamond polished down to 0.25 μm, followed by final vibration polishing, to remove the surface deformation layers.
Nanoindentation SRJ tests, according to the method developed by Maier et al. [Reference Maier, Merle, Göken and Durst8, Reference Bruder, Braun, ur Rehman, Marceau, Taylor, Pippan and Durst20], were performed to investigate the local SRS. A minimum of nine indentation SRJ tests were performed using strain rates of 0.05, 0.005, and 0.0005 s−1. For the CLH method [Reference Maier, Merle, Göken and Durst8] and for the CCP method, a minimum of four tests were performed. The experiments were first run with CSR up to target depth and then CLH, SRJ, and CCP approaches were used. For all experiments, a unified target depth of 500 nm was used.
Acknowledgments
Authors gratefully acknowledge funding from Deutsche Forschungsgemeinschaft (DFG) within the framework of the project “Indentation creep: New machine and test methodology development at various length scales, high temperatures and low deformation rates” (DU 424/11-1). O. Prach is grateful to the German Academic Exchange Service (DAAD) for the financial support.