


Introduction
How are politicians informed and who do politicians invite to provide information in the policy-making process? Members of Congress work in complex environments, are time constrained, make decisions that have important and potentially far-reaching consequences, and are constantly pressured to act (Baumgartner and Jones Reference Baumgartner and Jones2015; Curry Reference Curry2015). In this environment, information is one of members’ most important strategic needs and tools as they consider legislation (Krehbiel Reference Krehbiel1991). Members may need information about the importance of problems that they are asked to address (Baumgartner and Leech Reference Baumgartner and Leech1998). Additionally, members may also require information about the likely influence, effectiveness, or unintended consequences of policy proposals on their constituents (Baumgartner and Jones Reference Baumgartner and Jones1993; Krehbiel Reference Krehbiel1991) and reelection chances (Hansen Reference Hansen1991).
Corporations, think tanks, and other groups seek to influence legislators through the provision of information. Members’ desire for information thus serves as an opportunity for external groups to enter and gain influence. Providing information as a form of lobbying has long been characterized in the formal theory literature (Austen-Smith Reference Austen-Smith1993; Schnakenberg Reference Schnakenberg2017), and it is also an important factor in understanding the strategic behaviors that Congress exhibits when it comes to controlling the bureaucracy and the issues of delegation (Banks and Weingast Reference Banks and Weingast1992; Gailmard and Patty Reference Gailmard and Patty2012).
Despite the vast theoretical attention paid to the role of information in legislative organization and interactions between legislators and external groups, there is a lack of systematic empirical work on the information that Congress seeks to acquire and consider. From whom do members of Congress seek information, and how does information content vary by the identity of the providers? How do institutional conditions such as divided government and congressional capacity affect information acquisition? Exploring these questions empirically is essential to understanding the role of information in legislative institutions and how effectively members enact policies (Volden and Wiseman Reference Volden and Wiseman2014).
Although there are various avenues through which Congress can collect information, committee hearings and the corresponding witness invitation process present a unique, observable setting that reveals the specific external individuals and information that committee members have selectively sought to consider and convey to other members, interest groups, the media, and voters during the committee process. Committee hearings are also considered one of the main settings where members actively collect and evaluate information for congressional deliberation (Quirk Reference Quirk, Quirk and Binder2005). We leverage these facts and use witness testimony to examine the information-seeking behavior of congressional committees.
We present the most comprehensive analysis to date of the information flow between Congress and external groups by examining the types of witnesses that committees invite from 1960 to 2018 and the conditions under which committees turn to some types of witnesses more than others. First, we introduce our data and describe witness invitation patterns across 74,082 hearings and 755,540 witnesses who testified in Congress during the 58-year period of our data. We classify witnesses’ organizational affiliation into 18 types (such as bureaucrats or labor unions) to capture who Congress invites. We provide descriptive patterns that track the variation in witness composition across time, by committee, and by party in the majority. In addition, we show how the content of witness testimonies can vary by one particular characteristic—the amount of “analytical” information present (Esterling Reference Esterling2004)—and show how this differs by witness affiliation.
Given the varying patterns of the witnesses who testify in front of committees, understanding what can influence the invitations patterns of different types of witnesses is important. As hearings are public in nature, committees use hearings and witness invitations to advance political goals such as promoting partisan agendas (Park Reference Park2017; Reference Park2021; Reference Park2022). Under certain conditions, however, committees—in particular the chair and their majority party delegation—are more likely to seek out witnesses who can provide analytical input to policy decisions, and we focus on these conditions. We argue that partisan incentives of committees determine when committees seek out analytical information: (1) when the committee chair has not yet staked out the committee’s position on a policy under consideration, (2) when the majority party enjoys unified government, and (3) when there is a lack of motivation within party leadership to curtail committees’ information-seeking capacity. These conditions give these particular actors the incentives and ability to conduct relatively in-depth information searches. In the first, the committee chair has not yet advanced a bill through the committee process and so committee members do not yet have to defend or sell a particular position in drafted legislation, allowing them the flexibility to hear from those who can provide expertise in policy development. In the second, the majority party is assured of control over the policy-making process from onset through implementation and has the incentive to receive information that helps develop and carry out effective legislation in their favor. And in the third, party leaders allow committees to have the internal resources needed to enable the selection and arrangement of expert witnesses.
We test our argument using our new comprehensive dataset. First, the results show that committees invite different types of witnesses at different rates based on the committee’s intent (the chair’s decision) to hold a hearing in order to explore potential legislation or to consider a specific bill. Consistent with our argument, committees turn to think tanks, universities, and bureaucrats—witnesses who can provide more analytical information—at higher rates for hearings without a bill when they are using hearings to learn about an issue area or in preparation for future legislation. Committees pivot to invite witnesses from mass-based groups such as labor unions, trade associations, and membership associations at higher rates for hearings on a specific bill when they are using hearings and witness testimonies to assess the likely outcomes of the legislation and build a case for the bill presented under consideration.
Second, we find that during periods of unified government, committees—more specifically, the majority party delegation—are more likely to invite higher rates of bureaucrats to testify, a witness group that has been characterized as possessing an informational advantage in policy production and implementation that can result in more effective legislation (Gailmard and Patty Reference Gailmard and Patty2012). During periods of divided government, committees invite relatively lower rates of bureaucrats and instead invite higher rates of witnesses from think tanks, universities, and from within Congress itself. This diverging invitation pattern of bureaucrats is particularly pronounced when hearings are held on issues that the president prioritizes. These findings support our argument for how interbranch partisan considerations affect who a committee turns to for information, especially in terms of how much bureaucratic input a committee welcomes. Our evidence shows how committees limit the amount of expert information from an executive branch favorable to the opposing party’s president and, instead, open a door to external groups such as think tanks and university researchers to compensate for the relative loss of information from bureaucrats (Banks and Weingast Reference Banks and Weingast1992).
Third, we consider how partisan-motivated cuts made by party leaders on congressional capacity affect witness invitation patterns. We examine how a 1995 reform, led by party leaders from a new Republican majority in the House, downsized the internal resources of Congress (Bimber Reference Bimber1996; Kosar Reference Kosar, Drutman, LaPira and Kosar2020) and subsequently affected the information acquisition behavior of committees. Using a difference-in-differences design, we show how the elimination of the Office of Technology Assessment (OTA)—a supporting agency that provided an arguably neutral source of expertise to Congress on emerging technologies and other scientific matters—drove committees to change their behavior in how much and from whom they seek external information. We find that committees who relied most on internally produced information within Congress saw a drastic drop in the number of technical and scientific witnesses invited in the wake of the partisan-driven cut in congressional capacity.
Broadly, this article makes three notable contributions. We construct the most comprehensive database to date on congressional committee hearings and witnesses who appear before Congress; our database not only greatly expands the year coverage of hearings and witnesses but also provides valuable data such as the individual affiliations and types of these witnesses. In addition, although there has been ample theoretical attention devoted to the role of information in legislative organization and behavior, our findings fill a gap by providing empirical evidence on how partisan consideration can affect how much legislatures turn to outsiders for information and to whom in particular they turn. Last, and more generally, this paper pushes forward our understanding of how external groups seek to influence legislators through the provision of information at congressional hearings, an important venue for congressional deliberation (Quirk and Bendix Reference Quirk, Bendix, Edwards, Lee and Schickler2011). By documenting which external groups get invited and whether the type of information varies by group affiliations, our research highlights the potential role of external groups in shaping legislative processes.
The next section provides a primer on congressional hearings and witnesses, followed by an introduction to our new dataset on witnesses, primary descriptive statistics on witness invitation patterns, and the variation in the type of information witnesses provide. Then, we present theoretical arguments for how committees undergo information searches for policy learning under specific conditions and provide empirical evidence for our theoretical expectations. The final section discusses the implications of the findings and suggests paths for future work.
A Primer on Congressional Hearings and Witnesses
The committee stage is a prime market for information. The importance of hearings during the committee stage has been noted by the congressional literature (Deering and Smith Reference Deering and Smith1997; Oleszek Reference Oleszek1989) and has been the setting of previous studies on communication and information flow among legislators, interest groups, and bureaucrats (e.g., Leyden Reference Leyden1995; McGrath Reference McGrath2013). Previous research and case studies have shown how legislative outcomes and the content of bills have been affected by the information that is aired and discussed at committee hearings (Burstein Reference Burstein1999) and by conflicts among witnesses’ testimonies about issue framing during committee hearings (Baumgartner and Jones Reference Baumgartner and Jones1993).
Congressional committees hold these hearings to carry out their work. Namely, hearings are held for one of four purposes: (1) to collect information and opinions on legislation, (2) to conduct oversight on executive agencies, (3) to investigate events, and, in Senate committees, (4) to consider presidential nominations as part of confirmation processes (Heitshusen Reference Heitshusen2017). In any type of hearing, members from both the majority and minority parties are given the chance to make statements, ask questions, debate opinions, invite outside witnesses to testify, and question outside witnesses about the topics at hand. In general, hearings provide an opportunity for committee members to engage with external witnesses as members collect information, discuss ideas, and formulate policy. Witnesses who appear in Congress only appear in front of committees; there are no witnesses who testify on the floor.
Members during the committee stage are thus faced with the decision of who—which witnesses—to invite to testify and provide information. Committee members, with their committee staff, will identify potential witnesses for a hearing (Davis Reference Davis2015; Heitshusen Reference Heitshusen2017). There is no limit to the number of witnesses that may be invited.Footnote 1 During the consideration of potential witnesses, the committee members of the majority party may weigh in on the selection of witnesses and provide recommendations to the chair, though the chair possesses the gatekeeping power over which witnesses ultimately get invited to testify. Since 1970, the minority party’s committee members have been granted protection by chamber rules to call their own witnesses of choice on at least one day of each hearing.
In some cases, witnesses are selected to represent various points of view; in other cases, witnesses are selected to represent a specific point of view (Davis Reference Davis2015; Heitshusen Reference Heitshusen2017; Park Reference Park2017). When choosing witnesses, committees are faced with making various choices, such as how many or what types of witnesses to invite. When thinking about what types of witnesses to invite, witnesses can vary by numerous characteristics such as gender, ideological leaning, expertise in the issue area, etc. Although there can be an unending list of characteristics that can describe witnesses, many salient characteristics may not be known for certain or available to a committee when they are inviting witnesses, such as precise knowledge of a witness’ ideology.Footnote 2 However, one clear, salient, and easily accessible characteristic for committees to use is a witness’ organizational affiliation. In the existing literature, organizational affiliations have been used to characterize groups that are present and active in the political process (Schlozman et al. Reference Schlozman, Jones, You, Burch, Verba and Brady2015; Yackee and Yackee Reference Yackee and Yackee2006). Although there is variation in the resources and opinions within the same affiliation type, affiliation types can be a good proxy for the overall composition and diversity of the invited witnesses from the perspective of the committees.
Thus, although the process for inviting witnesses is rather straightforward, there can be a variety of factors that can affect which witnesses, especially in terms of affiliations, are invited to testify and appear before committees, which we expand on in a later section. In the next section, we describe our comprehensive dataset and start with descriptive patterns to illustrate what witness compositions in Congress have looked like.
New Data on Congressional Hearings and Witnesses
We constructed a new dataset on congressional committee hearings and witnesses from 1960 to 2018. These data were collected from ProQuest Congressional. The dataset includes full names and organizational affiliations of the 755,540 witnesses who appeared in 74,082 hearings of the House, Senate, and Joint standing committee hearings during this period. For each hearing, we extracted the following hearing-level information: title, date, the name of the committee, summary of hearing contents, and any bill numbers considered in the hearing.
Compared with the existing data on congressional hearings used by scholars, our database is the most comprehensive to date in terms of both the year coverage and the breadth of information.Footnote 3 Although some extant literature has analyzed witnesses who testified in a small selection of hearings in a limited period (e.g., Leyden Reference Leyden1995), the congressional scholarship has never systematically built a complete, extensive dataset on witnesses who testified in committee hearings.
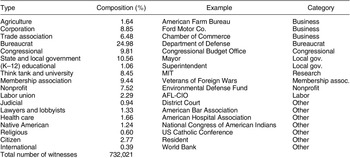
We further processed the raw data by constructing key variables that capture witnesses’ characteristics. Our main interest is the witnesses’ affiliations. As stated previously, affiliations have been used to characterize groups in the political process, and other characteristics such as ideology or expertise on issues are either difficult to measure or unavailable for an extensive set of witnesses. Therefore, we focus on the affiliations of witnesses, which provide a good approximation for the types of external groups that are invited to congressional hearings. We classified witnesses’ affiliations into 18 types. Table 1 presents the 18 types, percentage of each type in our dataset, an example of a witness affiliation (or title) in each type, and the nine broader parent categories of the 18 different types that are used for graphical presentations of our data later.
Types of Witness Affiliation

This classification was a careful procedure: (a) first, we constructed a list of affiliations of potential witnesses based on existing data from five different sources, which we detail in the next paragraph, then (b) assigned one of our predetermined categories to each organization or job category, and finally (c) merged the list to our new dataset on witnesses by matching the affiliations from both sides of the data. This process involved both automated match and extensive manual cleaning. It results in a dataset that, for the first time, systematically catalogs the organizational affiliation of every witness who has testified in Congress from 1960 to 2018.Footnote 4
There are five sources from which we retrieved the list of organizations, groups, and federal bureaucratic agencies to use in the above procedure. First, we extracted names of clients and lobbying firms from the Lobbying Disclosure Act (LDA) data available at LobbyView.org (Kim Reference Huitt2018). Second, we retrieved a list of organizations or employers of political donors from the Database on Ideology, Money in Politics, and Elections by (Bonica Reference Bonica2016). Third, we collected a list of departments and agencies of the federal bureaucracy from the Office of Public Management (OPM). Fourth, we also use the Washington Representatives Directory, which includes organizations that are active in Washington DC politics. Last, we collected a list of foreign governments from the Correlates of War Project. Together, these five datasets identified 1,063,223 unique names of the groups with which witnesses can be potentially affiliated.
In addition, we constructed committee-level variables, explained in a later section, and merged them to our dataset on witnesses. Next, we classified hearings into three types: legislative, oversight or investigative, and nomination hearings.Footnote 5 Last, we merged issue areas of each hearing from the Policy Agendas Project database on congressional hearings.
Descriptive Statistics: Witness Compositions
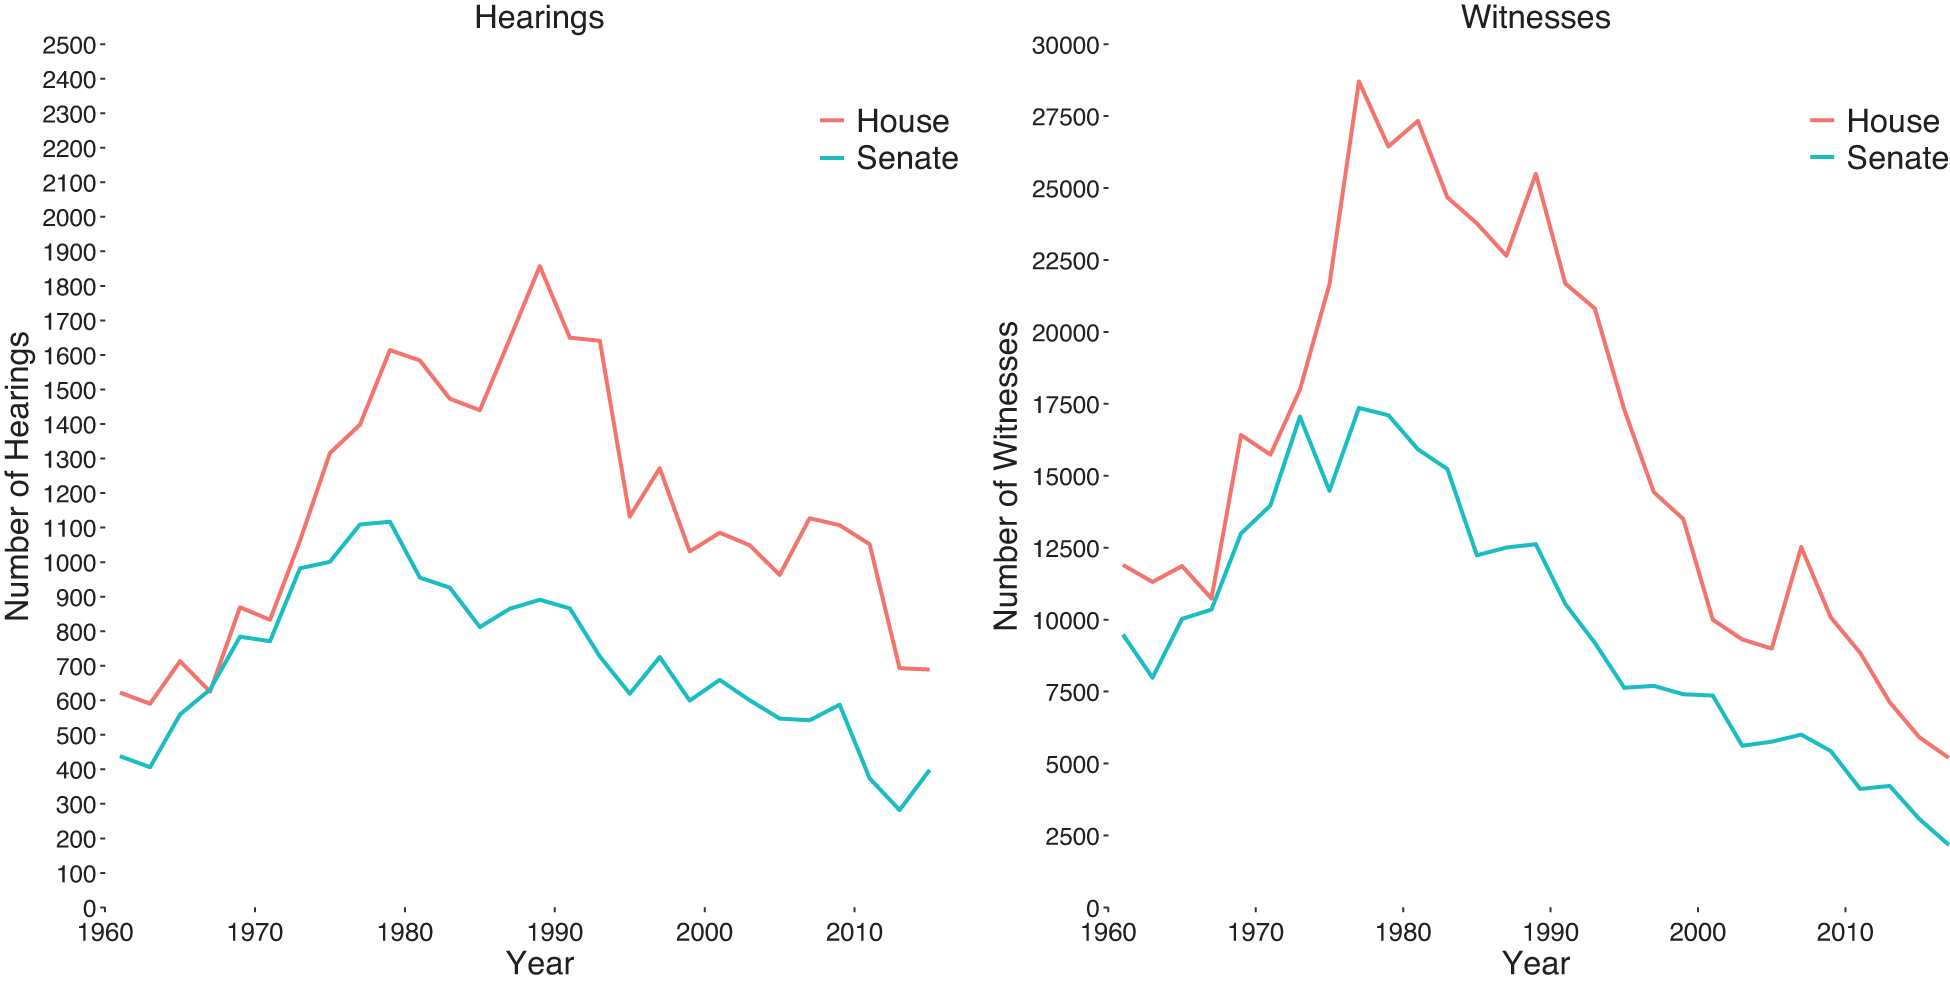
Our new dataset shows that the number of witnesses who appear in Congress varies significantly over time. Figure 1 illustrates the total number of witnesses who have appeared in each two-year Congress in each chamber from 1960 through 2018 and the number of hearings held by committees in each two-year Congress. A couple of main patterns emerge. First, the peak in the number of witnesses occurred in the late 1970s, where the number of external witnesses topped out at 29,665 in the 95th House (1977 through 1979) and 17,027 in the 93rd Senate (1973 through 1975). This is likely in accordance with the increase in the number of subcommittees that resulted from the Subcommittee Bill of Rights in 1974; an increase in the number of subcommittees likely increases the number of hearings held and thus the number of witnesses. These maximums then decrease across time until the minimums seen in most recent years; the number of witnesses in Congress experienced a decline since the 1980s, with around five times fewer witnesses testifying in Congress now than at the peak in the late 1970s.Footnote 6 One possible contributor to this is a reform in 1995 that drastically cut the number of subcommittees, which had the opposite effect as the 1974 reform; cutting subcommittees means fewer chances for subcommittee hearings and thus witnesses (Deering and Smith Reference Deering and Smith1997). The rise of partisan polarization that has shifted the power and resources from committee chairs to party leaders, as well as increased lobbying by interest groups and increased time demands for fundraising, could also contribute to the declining number of hearings and witnesses invited to hearings (Lee Reference Lee2015; Quirk Reference Quirk, Quirk and Binder2005; Quirk, Bendix, and Bachtiger Reference Quirk, Bendix, Bachtiger, Bachtiger, Dryzek, Mansbridge and Warren2018).
Number of Hearings and Witnesses in Congress over Time
Note: The left panel shows the total number of hearings held by congressional committees in each two-year Congress in each chamber. The right panel shows the total number of witnesses who have appeared in committee hearings in each two-year Congress in each chamber. Each Congress is plotted by its first year.

Two other patterns between the two chambers can be seen from Figure 1. First, the number of witnesses follows similar trends in the House and the Senate; when the number of witnesses rises [falls] in one chamber, the number of witnesses rises [falls] in the other chamber as well. Second, the number of witnesses in the House for any given year has always been greater than the number of witnesses in the Senate. Finally, Figure 1 presents the total number of witnesses in each chamber, and Figures A1 and A2 in the Appendix present the number of witnesses who have appeared by committee over time.
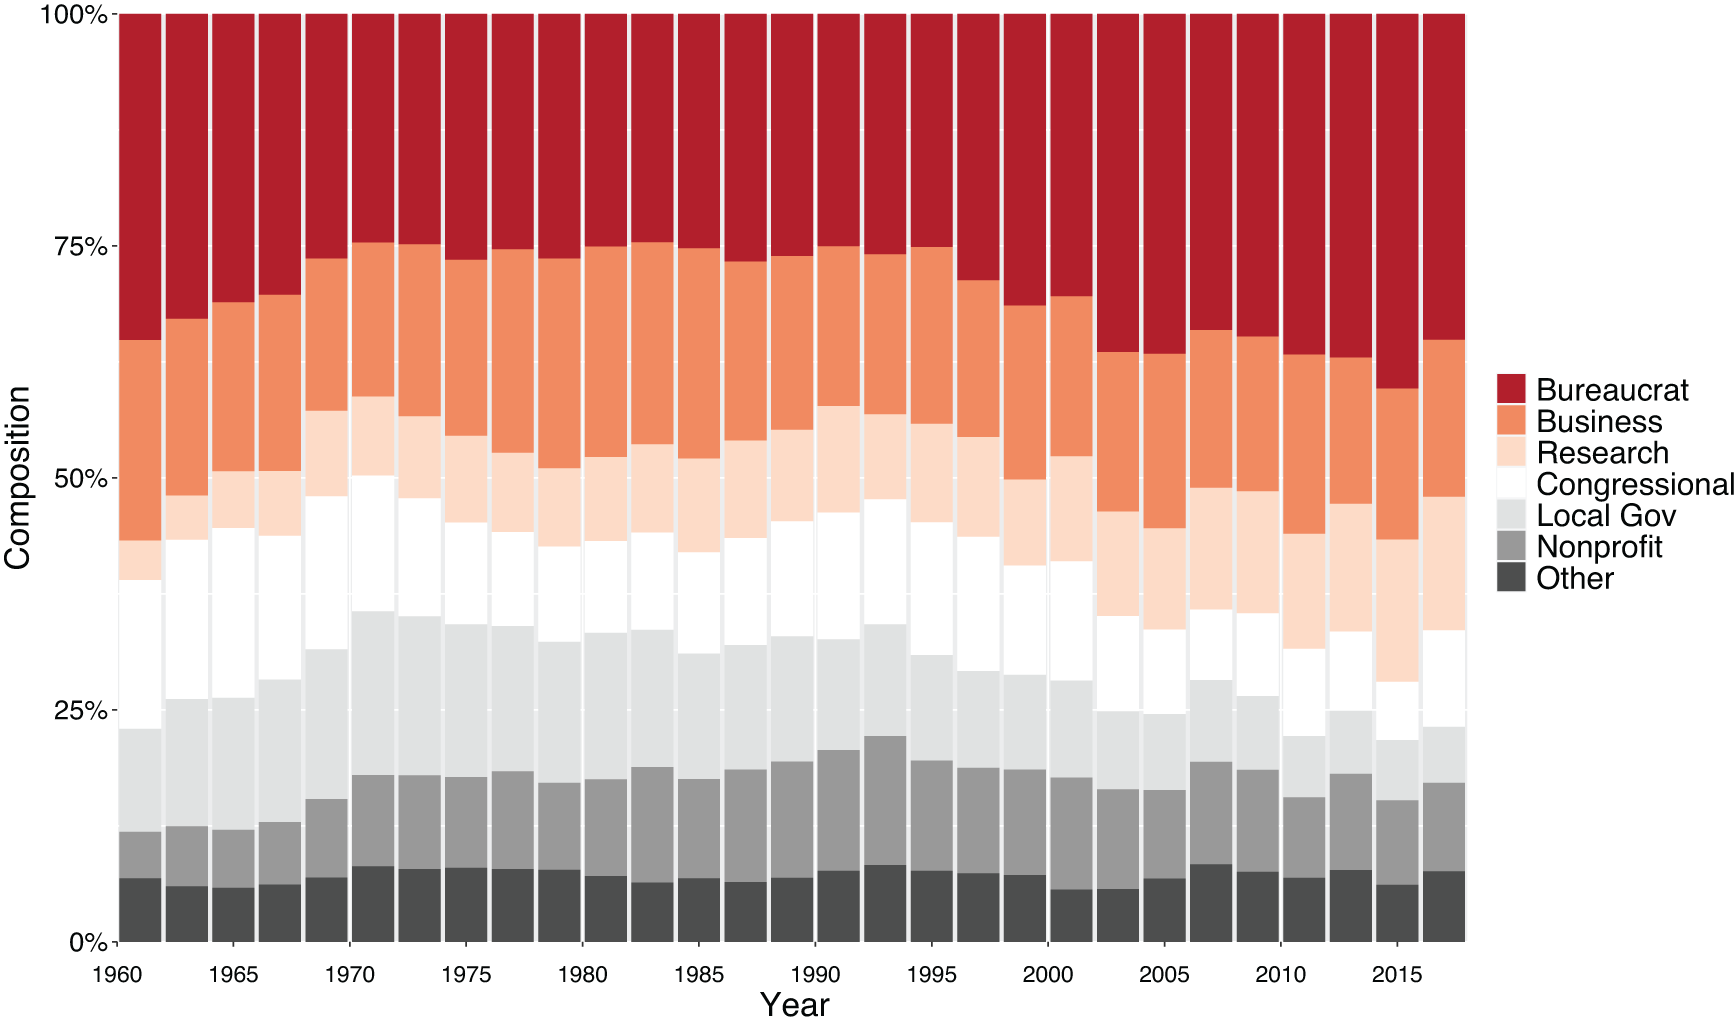
The composition of witness affiliations across time is presented in Figure 2. For illustrative purposes, we grouped the 18 affiliation types we identified through the procedure described previously into nine parent categories for Figure 2.Footnote 7 On the whole, bureaucrats represent the plurality of witnesses at any point. Over time, there has a been a gradual increase in the percentage of witnesses from the think tank and research category and a decrease in the percentage of witnesses from membership associations and local governments.
Witness Affiliations over Time

In addition to these trends across time, interesting variations appear when looking at committee-by-committee descriptive patterns. Bureaucrats strongly dominate the presence of witnesses in the House Committees on Armed Services, Foreign Affairs, Veterans’ Affairs, and Government Operations; this is perhaps due to the high administrative focus of these committees. On the other hand, business witnesses command relatively more presence in the Agriculture, Banking, Energy and Commerce, and Small Business Committees, reflecting the tendency of these committees to request information from external sources in these industries. Figure A3 shows the average witness affiliations by committee in the House, and Figure A4 in the Appendix shows the equivalent for Senate committees. We also present how witness affiliations vary by majority party in Figures A5 and A6 in the Appendix.
Variation in the Content of Witness Testimonies
These descriptive patterns show how the composition of witnesses, in terms of their affiliations, has varied. Although witness affiliations may be the clearest characteristic of a witness present to committees when they choose witnesses, do affiliations capture meaningful differences in information? In this section, we illustrate one way that the content of witness testimonies can vary by their affiliation.
The content of witness testimonies can vary in numerous ways; one measure of information that the existing empirical literature has focused on is the amount of falsifiable statements about the policy under consideration. Esterling (Reference Esterling2004; Reference Esterling2007) terms this type of information analytical discourse, though other scholars have termed this type of information as “policy-analytic knowledge” or “technical information” (Bradley Reference Bradley1980). This stands in contrast to nonanalytical information—for example conveyed in the form of anecdotes or personal information—which other scholars have categorized as “ordinary knowledge” or “experiential discourse” (Esterling Reference Esterling2007). Although nonanalytical information is also useful politically, especially for politicians to be able to understand and connect with constituents (Esterling Reference Esterling2007), it is analytical information that is the necessary input to technical policy development and is the type of information on which positive theories have mostly focused (Krehbiel Reference Krehbiel1991). Furthermore, recent scholarly discussion on the declining analytical capacity of Congress adds importance to understanding the quantity and quality of analytical information provided by external witnesses (Burgat and Hunt Reference Burgat, Hunt, LaPira, Drutman and Kosar2020). Following this, for the purposes of descriptive statistics in this section, we look at the amount of analytical information present in witness testimonies as an example of how witness testimonies can vary according to their affiliation type.
To do so, we collected hearing transcripts for the House from the 105th through 114th Congresses from the Government Printing Office and parsed the transcripts by each statement or speaking instance (including speeches, questions, answers, and other declarations) made by witnesses.Footnote 8 In order to measure which types of witnesses tend to provide more analytical information in hearings, we quantify three aspects of witnesses’ testimonies: how many words each witness spoke in a hearing, how many keywords that may convey analytical information that each witness used in a hearing, and the proportion of these keywords out of all the words that each spoke in a hearing. We take the proportion of keywords as the main variable of interest because it best shows how efficiently a witness conveys analytical information in their testimony. We identify the set of keywords that may contain analytical information in three ways: words related to cognitive orientation from the Harvard IV-4 dictionary, words frequently appearing in information-seeking statements as identified in Park (Reference Park2021),Footnote 9 and any additional word stems that are similar to those in the first two groups. Details on how we identify keywords through these approaches can be found in Appendix Section B.
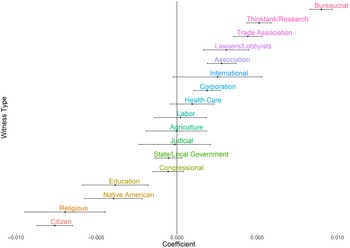
As we are interested in how witness affiliations correlate with the amount of analytical information present in witness testimonies, the main independent variables of interest are witness affiliation types. Figure 3 presents the coefficients on witness type fixed effects from an ordinary least squares regression that predicts the proportion of keywords that a witness uses in a hearing. We include hearing- and committee-level controls, along with issue, committee, and congress fixed effects; the full regression model and results are presented in Appendix Table A1. The reference group is set as the witnesses representing nonprofit organizations.
Proportion of Keywords by Witness Type
Note: Vertical lines indicate 95% confidence interval. The reference group is the witnesses from nonprofit organizations.

The figure shows that bureaucrats and witnesses from think tanks and research organizations tend to give testimonies with the highest proportion of analytical information. On the other hand, individual citizens without an organizational affiliation and those representing religious institutions tend to provide the lowest proportion of analytical information, which seems naturally consistent and lends confidence that our measurement is substantively valid.Footnote 10 There is a clear gap between the types of witnesses who provide the most and least analytical testimonies. Based on Figure 3, the difference between the coefficients for the bureaucrats and citizens is 0.017. Given that the witnesses in this analysis tend to speak about 1,923 words in a hearing on average, bureaucrats are likely to use 32 more analytical keywords in a hearing on average than ordinary citizens.
The pattern demonstrated in this section shows that not all witness testimonies are the same in the type of information they provide. When examining the relative amount of analytical statements present in testimonies at hearings, it is clear that committees may receive different amounts of analytical information based on what types of witnesses they invite. This motivates how the compositions of witnesses hold important implications for committees, as witness invitations not only show who committees select to hear from but also signify the different types of information that committees may ultimately receive from witnesses.Footnote 11
How Committee Incentives Affect Witness Invitations
The descriptive patterns in the previous section provide a picture of how the level of analytical information in witness testimonies varies by the type of witnesses. Understanding what affects the invitation patterns of witnesses, then, is important to understanding the information that committees seek out and receive. As we are interested in who committees invite to provide information to produce policy, we focus on legislative hearings and, in particular, witnesses who can provide analytical input to policy development. In this section, we explain under what conditions we expect committees to invite witnesses who can provide high levels of analytical information.
Legislative hearings are public and formal in nature; as explained in the primer section, these hearings provide committees—the committee chair, ranking member, and majority and minority party delegations—with opportunities to collect information, discuss ideas, and formulate policy. Therefore, hearings and witness testimony can be used by committees to advance political goals such as promoting partisan agendas or communicating vote intentions and justifications (Park Reference Park2017; Reference Park2021; Reference Park2022). Under certain conditions, though, committees are more likely to seek out witnesses who can provide analytical input to policy conditions. We present a theoretical framework that incorporates how three conditions, representing a committee’s partisan-driven incentives, can affect who the committee turns to for external information. We argue that committees, especially the committee chair and majority members as the dominating actors of committee proceedings, seek out witnesses who can provide analytical information under three conditions largely driven by partisan considerations: (1) when the committee chair has not yet staked out the committee’s position on a policy under consideration, (2) when the majority party enjoys unified government, and (3) when there is a lack of motivation within party leadership to curtail committees’ information-seeking capacity. Below, we expand on how under these three conditions we expect committees to invite more witnesses who can provide analytical input to policy decisions.
Committee Intent
The committee system and committees’ power in exploring the sources and quality of information during policy making have been the center of scholarly discussion on the deliberative function of Congress, of which committee hearings are an essential part (Quirk and Bendix Reference Quirk, Bendix, Edwards, Lee and Schickler2011). Members of committees can target various goals in legislative hearings, as they can collect and provide information, persuade other members and constituents, mitigate conflict, or signal potential issues with the legislation (Brasher Reference Brasher2006; Huitt Reference Huitt1954; Park Reference Park2017). Therefore, the witness invitation patterns may vary based on the intent the committee, and more specifically the chair, has for holding the legislative hearing. A committee chair can hold the hearing without including a bill that was referred to the committee—a nonreferral hearing—or can hold the hearing with a bill attached to it—a referral hearing. A referral hearing naturally highlights and focuses on a bill, whereas a nonreferral hearing does not have legislation as the cornerstone of the hearing. As the chair has both options, the revealed choice of a referral hearing implies that the spotlight on the bill aligns with the chair’s own partisan goals.
A nonreferral hearing, compared with a referral hearing, likely reflects the chair’s intention to hold a hearing more so to learn about the issue area or potential legislation. In a nonreferral hearing, the committee itself has not yet staked out or advanced a public position with a bill and so has the flexibility and incentive to seek out analytical information from experts. Given this situation, the chair, along with members of the committees, may wish to seek expert information about the details of what is needed to create policy from a narrower set of witnesses that can provide expert information.
In contrast, a referral hearing is anchored to a specific piece of legislation. Thus, in a referral hearing, committee members are more likely to have the intent of learning political information, a type of information that allows the committee to gauge a specific view of certain groups and the viability of the bill under consideration. Members may wish to learn about positions or reasonings for or against the specific bill at hand from various stakeholders, especially constituents and certain interest groups. In particular, members may wish to seek information from a wider variety of witnesses, such as groups that are likely to be affected by the legislation, in order to learn political information. Existing work on lobbying coalitions suggests that diverse lobbying coalitions are useful from committees’ perspectives to assess the viability of bills by collecting political information from various groups (Lorenz Reference Lorenz2020; Phinney Reference Phinney2017). Therefore, we expect that referral hearings will feature a more diverse set of witnesses, especially those who can inform politicians about the political consequences of advancing the bill considered in the hearing.
Committee members may thus wish to seek different types of witnesses based on their intent for the hearing; they may change the scope of information they seek and the sources that they invite to testify. This leads to our first hypothesis:
Committee Intent Hypothesis: Committees will invite a narrower set of witnesses and relatively more witnesses who can provide analytical information in nonreferral hearings than in referral hearings. Committees will invite a more diverse set of witnesses and relatively more witnesses from groups that are likely to be affected by legislation in referral hearings than in nonreferral hearings.
Interbranch Relations
Second, we consider whether committees—more specifically, the majority party delegation—will invite more witnesses who can provide analytical input to policy decisions when there is divided government versus unified government. Interbranch relations present a particularly large incentive (or disincentive) for a committee to engage in policy learning, as committees take into account the amount of control they have over the policy-making process and the informational advantage that bureaucrats possess.
To start, divided government creates concerns about legislative control over the implementation process, and thus, Congress has created numerous legislative and procedural solutions to increase its influence on the executive branch. For one, they can design agencies to be more insulated from the president’s influence (Lewis Reference Lewis2003) or they can write more detailed laws (Huber, Shipan, Pfahler 2001) to reduce the discretion delegated to the bureaucracy. Congressional hearings are another tool that the legislative majority can employ to exercise control over the executive branch. For example, scholars document that divided government is strongly related to committees’ use of investigative hearings on the executive branch’s conduct (Kriner and Schickler Reference Kriner and Schickler2016). Although Kriner and Schickler (Reference Kriner and Schickler2016) examine investigative hearings in particular, the logic of attempting to manage the power of the executive branch through hearings can be applied to legislative hearings as well: under divided government, committees who are developing and deciding policy may want to limit the influence of the executive branch in legislative matters more so than under unified government.
Another important consideration is that when the majority party has unified control over government, they have the incentive to seek out information to develop the most effective legislative solution. Bureaucrats possess an informational advantage in policy production and implementation (Gailmard and Patty Reference Gailmard and Patty2012) and our own descriptive analysis reveals that bureaucrats provide the highest levels of analytical information. When the majority party has unified control over government and are incentivized to produce the most effective policy, then bureaucrats present extremely valuable sources of information to assist them in doing so.
The informational advantage and policy expertise that bureaucrats possess raise a strategic question for the majority party members of a committee as they consider whether to invite bureaucrats as witnesses for legislative hearings to learn analytical information. Bureaucrats can provide valuable information that the committee can then use to produce more effective legislation, but bureaucrats come from the executive branch, with its own policy agendas and goals. Although there are many career civil servants in the bureaucracy, the president is the head of the executive branch and, additionally, names political appointees who oversee and directly manage career bureaucrats. The trade-off that majority party committee members face between wanting bureaucrats’ expertise and limiting executive influence becomes especially salient when there are policy disagreements between the legislative and executive branches of the government (and especially on issues that the president prioritizes), which is more likely during divided government. Thus, when the majority party in Congress differs from the party of the president, the majority party’s committee members are faced with the potential of bureaucratic witnesses representing the opposing party, and as a result they may be more likely to turn to other sources of expert information such as other types of witnesses or internal congressional sources. This leads to our second hypothesis:
Interbranch Relations Hypothesis: Committees will invite relatively fewer bureaucrats as witnesses in legislative hearings during periods of divided government than during periods of unified government.
Congressional Capacity
Third, we consider how partisan-motivated changes made by party leaders on the internal capacity of Congress affect the ability of committees to identify and seek out witnesses who can provide high levels of analytical information for policy learning. Scholars describe congressional capacity as the level of internal resources of Congress, with one main resource being congressional support agencies. The Congressional Budget Office, Congressional Research Service, Government Accountability Office, and the former Office of Technology Assessment make up the set of internal support agencies that was created to serve and assist members and committees in their workflow (Kosar Reference Kosar, Drutman, LaPira and Kosar2020). In general, these internal support agencies provide information to Congress that help identify matters that Congress should address, arm legislators with specialized information, and help rebalance intrabranch information asymmetries (Baumgartner and Jones Reference Baumgartner and Jones2015).
This form of congressional capacity received a shock in 1995, when Republicans became the House majority party for the first time since 1952. One of the core agendas of House Speaker Newt Gingrich’s “Contract with America” platform was to downsize the government, and the legislative branch was not immune. The Republican leaders in the House eliminated funding for the Office of Technology Assessment (OTA) and cut resources for the other internal congressional support agencies as part of their 1995 reform (Bimber Reference Bimber1996).
Congress had created the OTA in 1972 to study emerging technologies and to provide advice to Congress on these technologies and other scientific matters. The information from the OTA, and other internal support agencies, was often routed through congressional committees—an individual member of Congress could not request a study or report from the OTA, but a committee could. As a result, committees that were particularly in need of scientific and technical advice frequently requested information from the OTA and the OTA acted as an information provider and a source of expert staffers internally within Congress (Bimber1996). Committees who relied on the OTA reported the benefit not just of internal information from the OTA but also of trusted relationships with OTA staff that helped committees navigate scientific research and sort through the amount of available expertise and competing expert opinions (Tudor and Warner, Reference Tudor and Warner2019). Thus, with the elimination of the OTA driven by the Republican majority in 1995, committees who frequently relied on the OTA faced an immediate cut in internal information and the absence of a group of OTA staffers who liaised between committees and the scientific community.
We examine how the elimination of the OTA in 1995 affected the invitation patterns of witnesses from research-based organizations such as think tank and universities for committees who had depended on the OTA for information and expertise. Without the OTA’s advice and guidance, those committees may have a reduced capacity to even identify or facilitate the invitation of scientific witnesses on their own. The process of witness selection takes time and resources, especially for the types of witnesses that require relatively more effort to identify, research, and prepare. What’s more, the 1995 reform also drastically cut committee staff across all committees.Footnote 12 As staffers are integral to arranging witnesses for hearings, sufficient numbers of committee staff may need to be maintained in order to support a committee’s search for external information. The elimination of the OTA, along with a substantial cut in committee staff, could result in a more drastic reduction of expert witnesses in the committees that relied more on the OTA, even though demand for those types of witnesses may have increased. This leads to the hypothesis that emphasizes the amplifying effect of the loss of congressional capacity:
Congressional Capacity Hypothesis: Committees that relied more on the OTA will invite relatively fewer witnesses from think tanks and research organizations in legislative hearings after the elimination of the OTA.
Empirical Evidence
In this section, we provide empirical evidence for our theoretical argument. To do so, we use our new comprehensive dataset and focus on legislative hearings in the U.S. House.
Committee Intent and Witness Invitations
We investigate the effect of committee intent on witness invitation patterns by examining how the quantity of witnesses and composition of witnesses at a legislative hearing vary based on whether the committee intends to use the hearing relatively more to learn analytical information about an issue area or relatively more to learn political information about a specific position of groups or the viability of bills, as previously discussed.
We use the following regression and ordinary least squares estimation:
 $$ {\displaystyle \begin{array}{l}{Y}_{hict}=\beta {\mathrm{HearingCharacteristics}}_{hict}\\ {}\hskip-0.20em +\hskip0.2em \gamma {\mathrm{CommitteeCharacteristics}}_{ct}+{\alpha}_i+{\alpha}_c\\ {}\hskip-0.2em +\hskip0.2em {\alpha}_t+{\varepsilon}_{hict},\end{array}} $$
where the subscripts indicate hearing
 $ h $
, issue
 $ i $
, committee
 $ c $
, and congress
 $ t $
.Footnote
13 The outcome variable
 $ {Y}_{hict} $
will measure (1) the quantity of witnesses and (2) the diversity of witness types present at a given hearing, (3) along with the percentage of witnesses from each affiliation type present at the hearing. HearingCharacteristics contains the main hearing-level variable of interest that proxies the committee’s intent in the hearing: whether the hearing had a bill attached to it. Besides this primary explanatory variable, we also include control variables such as Subcommittee (which equals 1 if the hearing was held at the subcommittee level and equals 0 otherwise). We include fixed effects by committee, issue, and congress. Although we use a committee-level fixed effect, we also include committee-level control variables in CommitteeCharacteristics
 $ {}_{ict} $
such as the total number of committee members and the absolute difference in DW-NOMINATE scores between the committee chair and the floor media, as they may be of interest in the estimated results.Footnote
14 Standard errors are clustered at the committee level.
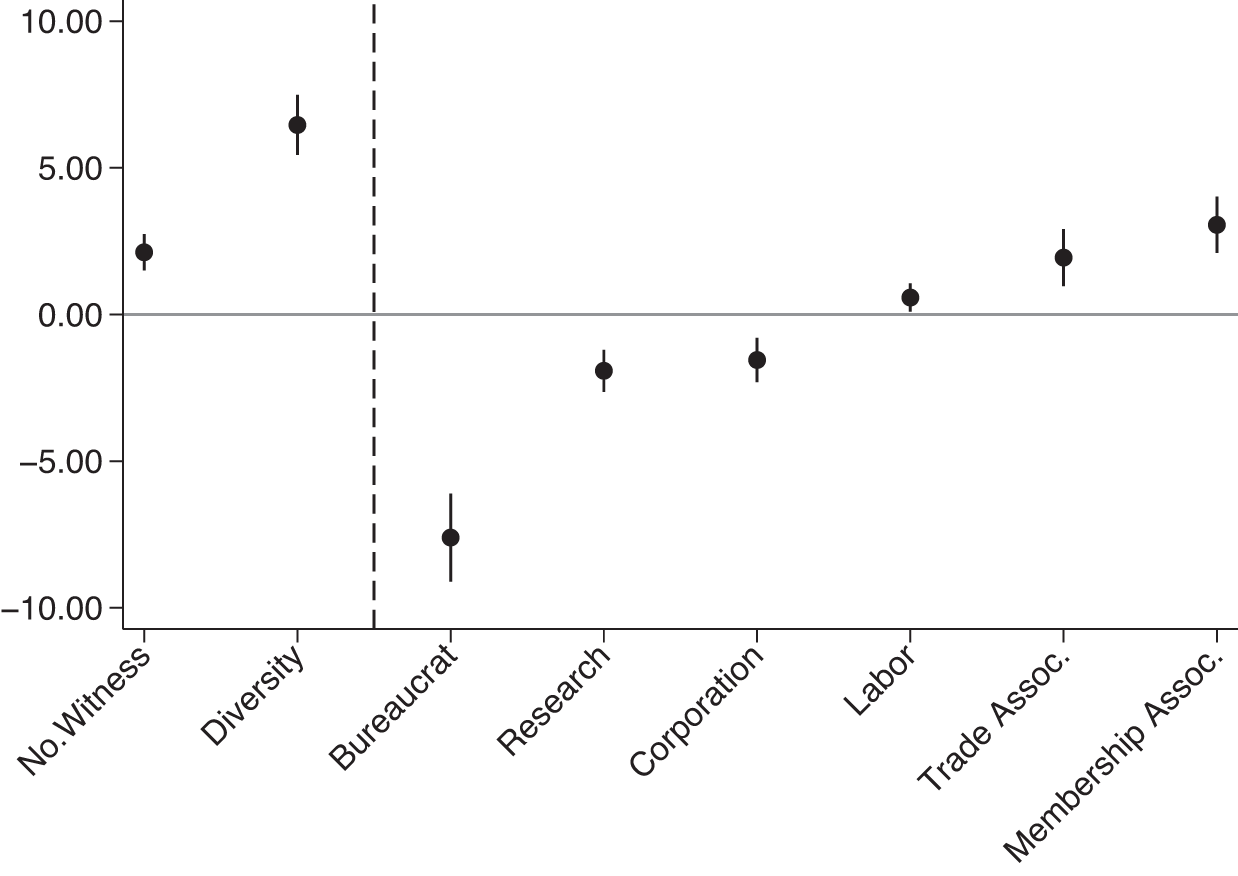
Figure 4 presents the coefficient plots for the selected outcome variables of interest when a hearing considers a specific bill (a referral hearing).Footnote 15 The outcome variable No.Witness is the number of witnesses invited to testify at the hearing. In referral hearings, committees tend to invite more witnesses. The outcome variable Diversity represents the diversity of witness types and is based on the Herfindahl index of the witness types that are present in a given hearing: for the eighteen possible witness types, we calculate each type’s share of the total number of witnesses in a given hearing and sum the squares of these shares. For ease of interpretation, we take 1 minus this Herfindahl index in order to create our outcome variable such that a higher value will indicate more diversity in witness types in a hearing and a lower value indicates less diversity. The results in Figure 4 show that referral hearings tend to have more witnesses and a higher diversity of witnesses than do nonreferral hearings.
The Effect of Hearing Considering Specific Bills on Witness Invitations
Note: Each plot indicates the regression coefficient for each outcome measure (x-axis). The y-axis shows the regression coefficients; “No.Witness” is the number of witnesses, “Diversity” is the Herfindahl index, and the others are the percentage shares of witnesses. The groups not shown in the plot have coefficients that are not statistically significant. The plots are presented with the 95% confidence intervals.

Which types of witnesses are invited more or less depending on a committee’s intent in holding hearings? Figure 4 provides the evidence for our Committee Intent hypothesis. Committees tend to invite witnesses who can provide more analytical information for nonreferral hearings, the hearings that are relatively more about policy learning (negative coefficients in Figure 4). First, the results show that committees tend to seek out bureaucrats—their analytical information and expert information about policy production and needs—more often for nonreferral hearings than for referral hearings. Second, the results also show that committees invite relatively more witnesses from think tanks or universities (“Research”) for nonreferral hearings than for referral hearings. Think tanks and universities represent a relatively credible source of information. Although think tanks and universities can certainly be politically motivated or biased, when compared with other witness types (such as witnesses from corporations or trade associations), the research from think tanks and universities holds relatively more scientific weight due to their connections to academic research. This result, then, points to congressional committees seeking out and obtaining relatively more information from think tanks and universities at the development stages of the policy-making process rather than at later stages when a specific bill is at hand. This holds true for witnesses from corporations as well. Committees also tend to seek out information from corporations more during nonreferral hearings than during referral hearings.
However, the opposite is true for witnesses from labor unions, trade associations, and membership associations. Witnesses from these mass-based groups are more likely to be invited and testify during referral hearings than during nonreferral hearings (positive coefficients in Figure 4). This suggests that once committees are further along in the policy-making process and are deliberating a specific bill, they are more interested in learning political information from witnesses who represent those who will be affected by the legislation or those who represent diverse group of individuals and organizations. This allows committees to gather information about the electoral consequences of a specific bill and help them predict the viability of bills in the legislative process. Also, these mass-based groups such as the National Organization for Women are well connected with other interest groups (Box-Steffensmeier, Christenson, and Craig Reference Box-Steffensmeier, Christenson and Craig2019); therefore, inviting these types of groups when a committee considers a specific bill would be useful from the committee’s perspective to collect information about views of various groups.
Interbranch Relations and Witness Invitations
We investigate the effects of interbranch relations on committees’ incentive for policy learning by examining how witness invitation patterns differ during periods of divided government (when the majority party in the House is different from the party of the president) compared with periods of unified government. We use the following regression and ordinary least squares estimation:
 $$ {\displaystyle \begin{array}{l}{Y}_{hict}=\beta {\mathrm{HearingCharacteristics}}_{hict}\\ {}\hskip3em +\hskip0.35em \gamma {\mathrm{CommitteeCharacteristics}}_{ct}\\ {}\hskip3em +\hskip0.35em \delta {\mathrm{CongressCharacteristics}}_t+{\alpha}_i\\ {}\hskip3em +\hskip0.35em {\alpha}_c+{\alpha}_p+{\varepsilon}_{hict},\end{array}} $$
where the subscripts indicate hearing
 $ h $
, issue
 $ i $
, committee
 $ c $
, congress
 $ t $
, and president
 $ p $
. CongressCharacteristics includes Divided Government and Democratic Majority. The main explanatory variable Divided Government equals 1 when the majority party in the House is different from the party of the president and equals 0 otherwise. Democratic Majority equals 1 when the Democratic Party is in majority of the House and equals 0 otherwise (when the Republican Party is in the majority). Both Divided Government and Democratic Majority are at the congress level; in order to estimate the effects of these variables that vary by congress, we include president fixed effects (
 $ {\alpha}_p $
). Committee-level and hearing-level control variables (i.e., the number of witnesses in a hearing) are included as controls, as previously. The outcome variable
 $ {Y}_{hict} $
will measure the percentage of witnesses in a given hearing that are from an affiliation type.
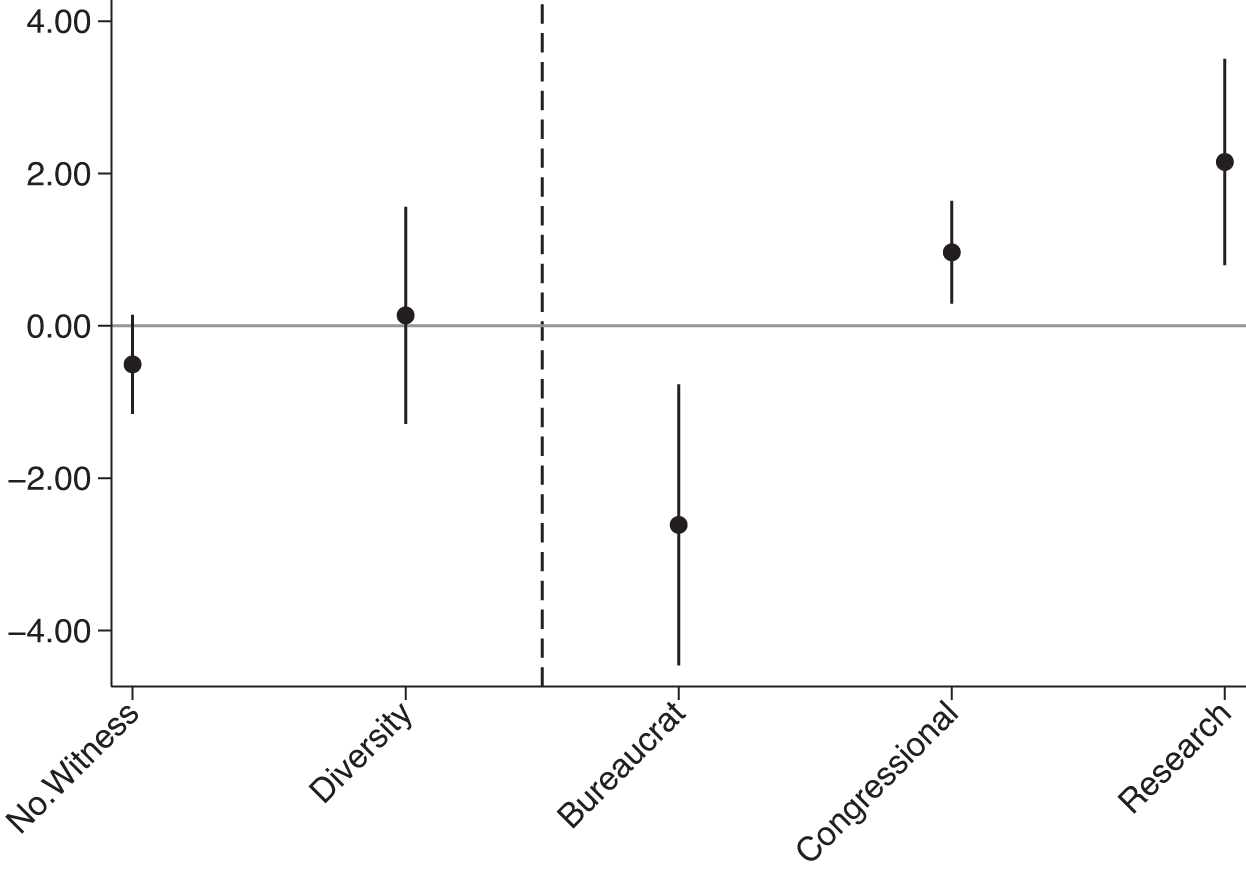
We present the coefficient of estimating the effect of Divided Government on a selected set of outcome variables in Figure 5. The full results, including outcomes of all affiliation types and all control variables, are presented in Appendix Table A4.
The Effect of Divided Government on Witness Invitations
Note: Each plot indicates the regression coefficient for each outcome measure (x-axis). The y-axis shows the regression coefficients; “No.Witness” is the number of witnesses, “Diversity” is the Herfindahl index, and the others are the percentage shares of witnesses. The plots are presented with the 95% confidence intervals.

Our analysis does not show a relationship between divided government and the number of witnesses invited to testify at a hearing or the diversity of witness types. However, our results do show that there is a negative, statistically significant effect of divided government on the percentage of witnesses that a committee invites from the bureaucracy, compared with during periods of unified government. This lends support to our Interbranch Relations hypothesis: during divided government, committees (controlled by the majority party in Congress) are less likely to invite bureaucratic witnesses from an executive branch controlled by the opposing party. Specifically, our results show that divided government is associated with a decrease of 2.6 percentage points in the percentage of witnesses who are bureaucrats, a magnitude that represents 7.5% of the mean percentage of bureaucrats who testify before committees. The direction of this finding holds important implications for the information searches that committees undergo for policy learning during divided government, as our previous results show that bureaucrats provide relatively higher amounts of analytical information in their testimonies compared with other types of witnesses.
Although committees may invite lower rates of bureaucrats to testify during periods of divided government, committees compensate for this by inviting higher rates of witnesses from two types in particular. Figure 5 shows that there is a positive, statistically significant effect of divided government on the percentage of witnesses that a committee invites from think tanks and universities (“Research”) as well as on the percentage of witnesses that come internally from Congress (“Congressional”). Divided government is associated with an increase of two percentage points in the percentage of witnesses from think tanks and universities—as the mean percentage of witnesses from this type who appear in hearings is 9.3%, this 2-percentage-point increase represents just over 20% of the mean percentage of witnesses of this type. Likewise, divided government is associated with an increase of around 1 percentage point in the percentage of witnesses that come internally from Congress, an effect magnitude that represents 12.5% of the mean percentage of witnesses of that type who appear in hearings.
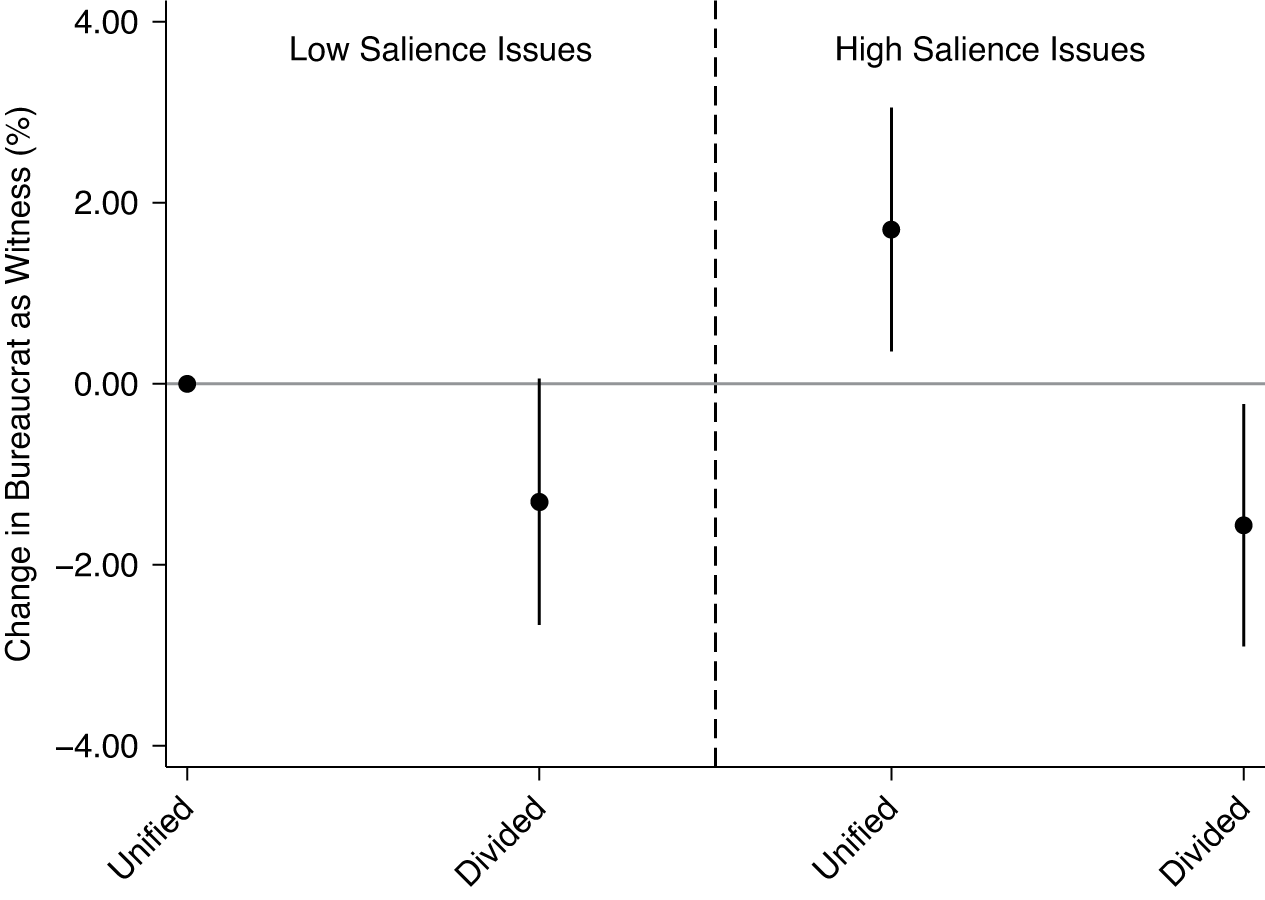
Additionally, we examine further variation into the effect of divided government on bureaucrats as witnesses. We investigate whether the strategic decision to invite bureaucrats as witnesses in congressional hearings also varies by the president’s issue priorities. During the divided government, when committees hold hearings on issues that the president prioritizes, the committee chair and the majority party delegation may be less likely to invite bureaucrats who would represent the viewpoints of the executive branch. To measure the president’s issue priority, we use data from Comparative Agenda Project’s State of the Union Speeches dataset, following existing work (e.g., Ballard and Curry Reference Ballard and Curry2021; Krause and O’Connel Reference Krause and O’Connell2016). This dataset provides issue information for each statement made during the president’s speeches. We aggregate the number of issues by congress and assign a decile for each issue area to identify the relative issue priorities of the presidents. Then, we merge this information to our hearings dataset in order to determine whether a hearing was held on an issue prioritized by the president.
Figure 6 presents the results.Footnote 16 High-salience issues refer to the issues that are placed in top 50% and low-salience issues refer to the issues that are placed in the bottom 50% in terms of the frequency in the State of the Union addresses in each Congress by the president. When hearings are held on issues that the president does not prioritize, there is little difference in terms of the frequency of inviting bureaucrats as witnesses between periods of unified and divided government. However, when hearings are held on issues that the president prioritizes (“High-Salience Issues”), there is a clear diverging pattern: committees, likely driven by the partisan incentives of the chair and their majority party delegation, invite relatively more bureaucrats into hearings when the majority party in the House and the White House is the same but invite relatively fewer bureaucrats as witnesses when there is divided control.
The Effect of Divided Government on Inviting Bureaucrats as Witnesses By Presidential Issue Priorities
Note: The plots indicate the changes in the percentage of witnesses who are bureaucrats during unified/divided government by the president’s issue priorities. The plots are presented with the 95% confidence intervals.

Overall, these findings suggest that during divided government, committees turn relatively less to bureaucrats for information and instead turn relatively more to think tanks, universities, and internal congressional sources for information. Therefore, the partisan divide between the House and the executive branch may not just result in partisan obstacles for the congressional majority in getting their legislation signed into law, as commonly understood, but also holds implications for who provides more (or less) information that Congress emphasizes and chooses to publicly consider during policy making.Footnote 17
Congressional Capacity and Witness Invitations
To investigate how the Republican majority’s elimination of the OTA in 1995 affected the witness invitation patterns of committees that depended on the OTA, we leverage the fact that committees differed in their reliance on internal information. When analyzing the number of reports that congressional committees requested from the OTA, there is substantial variation across committees. For example, during 1990–1995 (the period for which report request data are available), the House Committee on Small Business requested only one report from the OTA, whereas the Energy and Commerce and Science, Space, and Technology committees requested 55 reports from the OTA.Footnote 18 Certain committees, such as these latter two committees, demonstrate a particular reliance on internal information, compared with other committees who hardly made any use of the OTA and thus do not primarily rely on internally produced information. Thus, we assign Energy and Commerce and Science, Space, and Technology as the group affected by the treatment—the committees who would be affected by the elimination of the OTA. We estimate the following difference-in-differences model to examine whether witness invitation patterns exhibit distinctive trends in the treated committees compared with the control group of committees that do not primarily rely on internal information:
 $$ {\displaystyle \begin{array}{l}{Y}_{hict}=\beta {\mathrm{Treated}}_c+\sum \limits_{s=1}^6{\gamma}_s{\mathrm{Congress}}_{100+s}\\ {}+\hskip2px \sum \limits_{s=1}^6{\delta}_t\left({\mathrm{Treated}}_c\cdot {\mathrm{Congress}}_{100+s}\right)+\rho {X}_{hict}+{\alpha}_i\\ {}+\hskip2px {\varepsilon}_{hict}.\end{array}} $$
In this equation,
 $ {Y}_{hict} $
indicates the outcome measures for witness characteristics at the hearing level (for hearing
 $ h $
, issue
 $ i $
, committee
 $ c $
, in congress
 $ t $
).
 $ Treated $
indicates the two House committees that had a strong reliance on internal information: the House Energy and Commerce Committee and the House Committee on Science, Space, and Technology. The variable
 $ Congress $
captures the lead periods from the 100th Congress (1987–1988), which is the reference congress. The main variable of interest is
 $ {\delta}_t $
, which indicates whether there were any significant differences in the witness invitation patterns between the treated and control groups before and after the reform in the 104th Congress, and
 $ {X}_{hict} $
includes other hearing-level control variables. We include an issue fixed effect (
 $ {\alpha}_i $
), and standard errors are clustered at the committee level.
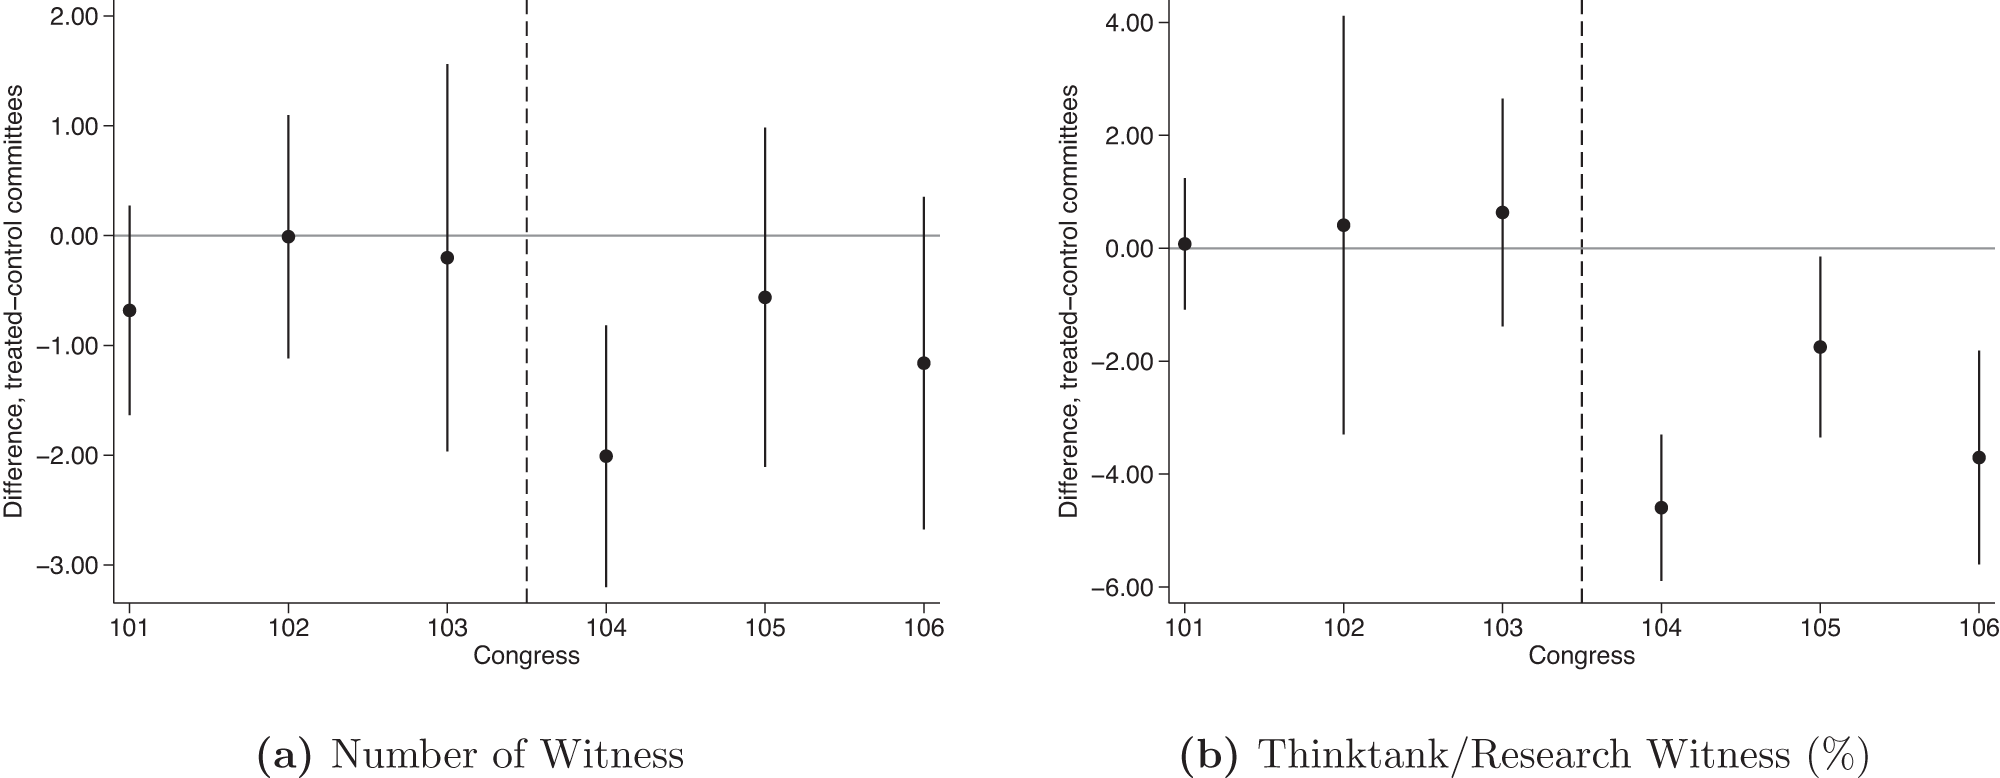
Figure 7 presents the results for two outcomes: (1) the number of witnesses testifying at the hearing and (2) the percentage of witnesses from think tanks and universities.Footnote 19 In the figures, the reference Congress is the 100th Congress; the plots cover the time trends from the 101st Congress to the 106th Congress, a period that covers three terms before and three terms after the 1995 reform. There is no pretrend in terms of the number of witnesses invited and the witnesses from think tanks and universities before 1995. However, after the reform there was a clear decline in the number of witnesses in the treated committees that heavily relied on the support from the OTA, though the pattern disappears in the subsequent Congresses. The decline in the number of research-based witnesses in the treated group right after the reform was more substantial, and the pattern continues in the subsequent Congresses. Given that the average percentage of witnesses who were research-based witnesses before the reform was 7.3%, the coefficients presented in Figure 7 suggest that there was at least a 24% drop in the invitation of research-based witnesses after the OTA elimination.
Elimination of the OTA on Witness Invitation Patterns
Note: The reference Congress is 100th. Reform took place during the 104th Congress. The plots are presented with 95% confidence intervals.

These decreases confirm the expectation from the Congressional Capacity Hypothesis: Committees that relied more on the OTA will invite relatively fewer witnesses from think tanks and research organizations after the elimination of the OTA. This is contrary to the view that committees who had relied heavily on the OTA may, in fact, be expected to increase their efforts in inviting external witnesses, especially witnesses who can provide technical and analytical information, in order to compensate for the loss of internal information that had been provided from the OTA. However, a simultaneous cut in number of committee staff across all committees in 1995—those who play a central role in the selection, invitation, and preparation process of witnesses, especially for technical and scientific witnesses—is possibly one reason why committees who had relied on the OTA were unable to fill the void created by the elimination of the OTA. A committee’s own staff would already be a weaker substitute to OTA staffers—the chair of the U.S. House Committee on Science, Space, and Technology clearly stated in 2019 that “committee staff are not a replacement for OTA” (Johnson Reference Johnson2019)—but even so, committee staff were cut as well. Our analysis demonstrates how political parties, especially party leaders, could negatively affect committees’ abilities to deliberate by sharply reducing resources and expertise that committees need (Quirk, Bendix, and Bachtiger Reference Quirk, Bendix, Bachtiger, Bachtiger, Dryzek, Mansbridge and Warren2018).
Taken together, internal congressional support agencies and committee staff largely arm committees with the ability to gather and process information; these two types of internal capacity can be characterized as “tools” that committees possess to conduct information searches. The 1995 reform eliminated one internal source of information, the OTA, for the specific committees that relied on this internal information—an action that has been described as “congressional lobotomy” (Baumgartner and Drutman Reference Baumgartner and Drutman2016). Our difference-in-differences results reveal that these committees indeed suffered a drop in the number of witnesses, especially the number of research-based witnesses, as a result of the partisan-driven OTA elimination and likely could not compensate for this loss of information because of the commensurate cut to committee staff across Congress.
The elimination of the OTA in 1995 is characteristic of the larger trend in declining congressional capacity. Scholars have raised concerns about Congress’s lack of capacity to address public problems that society faces and fulfill its constitutional role (LaPira, Drutman, and Kosar Reference Kosar, Drutman, LaPira and Kosar2020). Although we focus on the implications of declining congressional capacity at the committee level, Crosson et al. (Reference Crosson, Furnas, Lapira and Burgat2021) show that individual members of Congress also have reallocated their resources from legislative functions to district activities to increase their electoral chances, a trend that they observe in both parties. Given the multiple changes in congressional capacity both at the committee and members’ office levels, the effect of declining capacity on the acquisition of analytical information needed to produce policy may be even larger than our findings suggest.
Conclusion
In this paper, we have examined the information flow between Congress and witnesses from external groups. The theoretical framework we present explains how partisan incentives of committees affect when committees are more likely to seek out analytical information for policy learning, and we provide empirical evidence using a new, comprehensive dataset on hearings from 1960 to 2018. In doing so, we show how different types of witnesses provide different levels of analytical information in their testimonies and how committees—especially the chair and majority members—are driven to seek out witnesses who can provide high levels of analytical information under a set of partisan-driven conditions. We highlight our main results below and suggest extensions for future work to further emphasize how our data can be of value to any scholars and policy makers interested in the information flow between Congress and external groups.
Our results illustrate how committees’ partisan conditions influence the types of witnesses they seek out and how this affects policy learning. For one, our results reveal that members of committees turn to different types of witnesses and different types of groups based on committee intent: whether they are exploring a legislative issue and thus likely to be learning analytical information about a potential area for future legislation or they are actively considering a specific bill and thus likely to be gathering information about electoral consequences or the viability of the bills. In turn, this suggests that different groups may have different kinds of opportunities for influence through information provision during different stages of committee politics; extensions that closely examine this and the implications of such opportunities may be of further interest to scholars of interest group politics.
In addition, we find that committees react to the partisan setting of divided government by inviting lower percentages of bureaucrats to testify. This link between divided government and lower invitation rates of bureaucrats not only has implications for the information that committees receive, as bureaucrats have been shown to provide high levels of analytical information in their testimonies, but also points to how committees may be choosing to respond to partisan considerations over informational considerations. This motivates possible future work that examines the extent to which committees may be behaving strategically with the bureaucracy. More broadly, bureaucrats are one of the most common types of witnesses to appear before committees, as shown in our data, and there is significant variation across agencies regarding their ideologies (Richardson, Clinton, and Lewis Reference Richardson, Clinton and Lewis2017). Using bureaucrat testimonies may be particularly promising for future work on the interbranch sharing of information between congressional committees and executive agencies with different ideological leanings.
Finally, we show how the Republican majority’s elimination of the OTA in 1995 reduced the invitation of research-based witnesses in the committees that heavily relied on the internal capacity of Congress. Although we focus on witness types to characterize the potential influence on the information acquisition of committees, various other ways of characterizing the informational effects may be of further interest. For instance, the quality of information and the use of scientific evidence cited by witnesses before and after the OTA elimination might change. Further inquiry into how declining congressional capacity affects the presentation and use of scientific evidence in witness testimonies can enrich scholars’ understanding of the role of research and science in shaping public policy in the United States.
Supplementary Materials
To view supplementary material for this article, please visit http://doi.org/10.1017/S0003055422000405.
DATA AVAILABILITY STATEMENT
Research documentation and data that support the findings of this study are openly available at the American Political Science Review Dataverse: https://doi.org/10.7910/DVN/TKRHZU.
ACKNOWLEDGMENTS
We thank comments and feedback from Seth Hill, Jaclyn Kaslovsky, Shiro Kuriwaki, Caroline Le Pennec, Julia Payson, Jon Rogowski, and Jan Stuckatz, as well as seminar participants at the Center for Effective Lawmaking Annual Research Conference at Vanderbilt University, Institute for Advanced Studies in Toulouse Political Economy Conference, Virtual Workshop on Interest Groups, Korea Advanced Institute of Science and Technology, University of California–Irvine, University of Pittsburgh, University of Michigan, Washington University in St. Louis, Yale University, and Stanford University. We also thank Matt Asare, Hope Chow, Jack Dwekc, Annapurna Johnson, Victoire Legrand, Cameron Maglio, and Alan Sun for an excellent research assistance.
CONFLICT OF INTEREST
The authors declare no ethical issues or conflicts of interest in this research.
ETHICAL STANDARDS
The authors affirm this research did not involve human subjects.





Comments
No Comments have been published for this article.