1. Introduction
The great size of the Antarctic ice sheet together with its rough environment lead to a lack of ground measurements.Microwave remote sensing permits a spatial and temporal coverage of this continent under any weather conditions (Reference ZwallyZwally, 1977). Moreover, when the snow is dry, the measured radiation comes from a frequency-dependent depth; consequently, information on both the snow surface and the snow volume is provided (Reference Rott, Sturm and MillerRott and others, 1993). In this way, interpretation of the microwave spectral signatures is able to provide snow characteristics such as grain-size, density and temperature profile. Of these data, temperature is an essential parameter for ice sheets and climate studies. The aim of this work is to study the temporal variations of the brightness temperature, in order to retrieve the snow-temperature variations.
In the first part, a simple model based on radiative transfer and accounting for the temperature profile is proposed, which enables us to retrieve the measured brightness temperatures. In part two, we try to solve thereverse problem which consists of the retrieval of the snow temperature from the satellite data.
2. Surface Air-Temperature Data
A network of automatic weather station (AWS) units wash deployed on the Antarctic ice sheet in order to collectsurface-weather conditions. Every 3 h, each unit measuresair temperature, air pressure, wind speed and directionfrom the top of the unit tower at a nominal height of 3 m(Reference Keller, Weidner and StearnsKeller and others, 1990).
These data have been available for several years but some of the stations have not been working continuously.Because we want to compare them with coarse-resolution passive microwave satellite data, stations too close to the coast or mountains are eliminated because of the spatial inhomogeneity of the pixel centered on them.
Finally, station Dome C, on the East Antarcticplateau, and station Lettau, on the Ross Ice Shelf, have been chosen (Fig.1). The mean daily temperature duringthe year 1989 was calculated for each station (Fig.2).
Map of Antarctica, location of Dome C (74.50° S,123.00° E, 3280m) and Lettau (82.59° S, 174.27° W,55m)

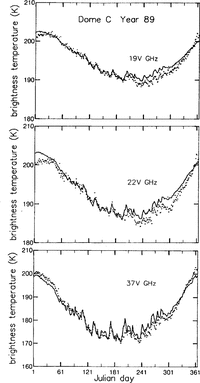
AWS temperatures and measured brightness temperatures at Dome Cfor the year 1989.

3. Ssmi Data
The Special Sensor Microwave Imager (SSMI) is aseven-channel four-frequency linearly polarized passive microwave radiometric system. It was launched aboard the DMSP F8 (Defense Meteorological Satellite Program)platform in June 1987 and is still operating.
The vertical and horizontal polarized thermal upwell in gradiation, expressed as a brightness temperature, is measured at an incident angle of 53.1°, for frequencies 19.35, 37.00 and 85.5 GHz; the frequency 22.235 GHz is measured only for vertical polarization. Henceforth, these seven channels will be referred to as 19H, 19V, 22V, 37H,37V, 85H and 85V (Reference Goodberlet, Swift and CavalieriGoodberlet and Swift, 1992).
Raw data from each data channel are gridded at 12.5 km resolution (85 GHz) or 25.0 km resolution (other frequencies) on the South Polar grid as follows: the brightness temperatures which fall into one grid cell are summed for a 24 h period and divided by the number of observations to obtain the average brightness temperature for this grid cell. Neither the number nor the time of observations per pixel are available; we therefore considerthe average as a daily mean. More information can be found in the DMSP SSM/I Brightness Temperature andSea Ice Concentration Grids [or the Polar Regions on CD-ROM, User's Guide 1992, National Snow and Ice Data Center Special Report-1, available from the Cooperative Institute for Research in Environmental Sciences, University of Colorado.
Because the atmosphere is dry and cold above Antarctica and far enough from the coast, atmospheric effects are negligible for frequencies 19, 22 and 37 GHz. The 85 GHz channel is more affected by the atmosphere and thus is not used. Vertical polarization is preferred because it is less dependent on stratification and on surface roughness due to the measurement incident angle which is close to the Brewster angle for snow. Therefore,only the frequencies 19, 22 and 37 with vertical polarization are taken into account in this study.
The mean daily brightness temperatures of the pixels centered on the AWS stations are selected and shown in Figure 2 for Dome C. The same strong variations, with different amplitudes, can be seen for both the AWS temperatures and the brightness temperatures.
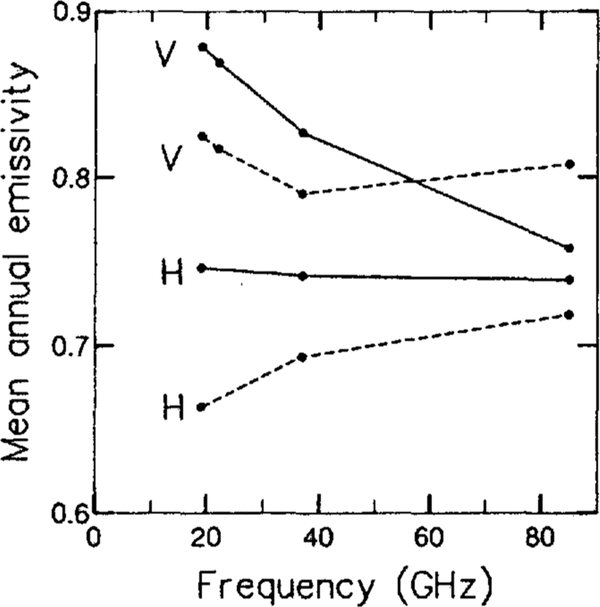
As illustrated in Figure 3, which represents the mean annual emissivity of Dome C and Lettau, the two stations have quite different behavior. The mean annual emissivity is defined as the ratio between the mean annual brightness temperature and the mean annual snow-surface temperature, which is approximated by the mean annual AWS temperature.
Mean annual vertical and horizontal emissivity forfrequencies 19, 22, 37 and 85 GHz at Dome C (dashedline) and Lettau (solid line). The values for 85V GHz are given for the year 1988 because this channel stopped functioning in 1989.

4. The Direct Model
First, the direct problem to solve is the retrieval of the daily mean brightness temperature at each frequency from the daily temperature profiles. To this objective,simple radiative-transfer and snow-thermodynamic models are used
4.1. The radiative-transfer model
For an absorbing and scattering semi-infinite medium,after using the Rayleigh-Jeans approximation, the brightness temperature at any point r is given by (Reference Ulaby, Moore and FungUlaby and others, 1981):

All terms in this equation pertain to propagation in the direction  r' represents a point along the path (0, r), and the brightness temperature at the origin is supposed to be equalto 0. K
a is the absorption coefficient, K
sis the scattering coefficient, K
e is the extinction coefficient and τ(r') is the temperature profile. τ(r',r) is the optical thickness:

 represents the radiation scattered in the direction
 from all other incident radiation with TB
 being the radiation incident from direction
 and
 the phase function accounting for the part of energy scattered from direction
 into direction


The contribution from an infinite simal layer dr' at point r' is reduced in magnitude by the factor exp( -τ(r', r)) due to extinction by the material between the layer at a point r' and the observation point at r
The second term in Equation (1) is difficult to obtain because it requires the evaluation of an integral involving the phase function, the scattering coefficient and the brightness temperature for all directions. This term is assumed to be proportional to the local temperature. Wethen introduce an empirical effective coefficient K eff combining absorption and scattering. This empirical coefficient takes into account, in a global way, the complex internal structure of the stratified polar firn.
Consequently, accounting for the reflection at the air-snow interface, the upward radiation emitted at the surface by the snow in the direction θ0 is approximated by:

with θ1 the refraction angle and R the Fresnel reflection coefficient calculated from the dielectric constants of ice (Reference Mätzler and WegmullerMätzler and Wegmüller, 1987) and of snow (Reference MätzlerMätzler,1987). This equation is similar to the one used by Reference Rott and PampaloniRott(1989). As a first approximation, K eff and K e are assumed to be constant in the layer of snow which gives the most important contribution. This assumption is crude because the Antarctic snow mantle is stratified but no a priori knowledge of the snow stratigraphy is needed.
Computing the mean brightness temperature over the year and assuming that the mean annual temperature profile for all depths is constant and equal to the mean annual surface temperature
 we obtain

The mean annual emissivity is calculated from the annual mean
 of the SSMI data and from the annual mean
 The emissivity is supposed to be roughly constant over the year. Due to low accumulation and temperatures, the snow-mantle structure and consequently the emissivity do not vary much. This feature is valid for most of the Antarctic. It was observed, indeed, that the spatial structure of the microwave signature is stable with time during many years on a large scale over Antarctica (Reference Fily and BenoistFily and Benoist, 1991).
4.2 The thermodynamic model
The previous integral in Equation (2) requires the evaluation of the temperature profile T (z). Daily temperature profiles are computed using a simple thermodynamic model. The one-dimensional heat-diffusion equation in a homogeneous medium is solved by a finite-difference method and an implicit time scheme (Reference Remson, Hornberger and MoltzRemson and others, 1971):

T represents the temperature, z the depth and t the time.
The density ρ is taken equal to 350 kg m-3; small variations of density do not change the results. The snow conductivity K is found in Reference Brun, Martin, Simon, Gendre and ColeouBrun and others (1989) and the specific heat capacity C in Reference YenYen (1981). The vertical speed of a snow particle u z, which is equal to the accumulation divided by the density, can be neglected.
The equation is discretized in space (with a vertical step of 0.1 m) and in time (with a time step equal to 1d).Thus, solving the heat-transfer equation comes down to solving a system of linear equations in which each temperature profile depends on the previous one
The following boundary conditions are imposed:
The temperature at the snow surface is approximated by the AWS air temperature at 3 m. The AWS temperatures do not represent exactly the snow-surface temperature; an accurate energy balance at the snow surface, taking into account the radiative,sensible and latent fluxes, would be necessary to know it more exactly. Because of solar radiation, the summer surface temperature may be under estimated and because of strong inversion the winter surface temperature may be overestimated.
The temperature gradient at 20 m depth is equal to 0.
Some examples of temperature profiles at Dome C for different seasons are given in Figure 4.
Examples of computed temperature profiles for different seasons.

4.3 Results
The temperature profile is obtained from the thermodynamic model. The relation between K eff and K e is given by the mean annual emissivity. To obtain the brightness temperature from Equation (2), we still haveone unknown: K e. Then, K eis computed in order to have the best fit, according to the least-square criterion,between the measured brightness temperatures and those computed from Equation (2).
So, the extinction coefficients K e and the corresponding penetration depths D p (Table 1 ) are computed from a semi-empirical model and from measured data. They are similar to those found by Reference Rott and PampaloniRott(1989) and Reference MätzlerMätzler,(1987).The two sites show quite different penetration depths. D p is smaller at Lettau due to different snow-mantle characteristics.Melting occurs on the Ross Ice Shelf, inducing ice layers and ice lenses in the stratification at Lettau (Reference Crary, Robinson, Bennett and BoydCrary and others, 1962), which are not present at DomeC (Reference Palais, Whillans and BullPalais and others, 1982). A smaller value of D p was also calculated by Reference Rott and PampaloniRott(1989) at a coastal site compared to one on the continental plateau. More reflections at these internal boundaries increase the extinction coefficient (Reference Rott, Sturm and MillerRott and others, 1993).
Equation (2) takes into account these features through the use of the mean annual emissivity which is computed from measured data.
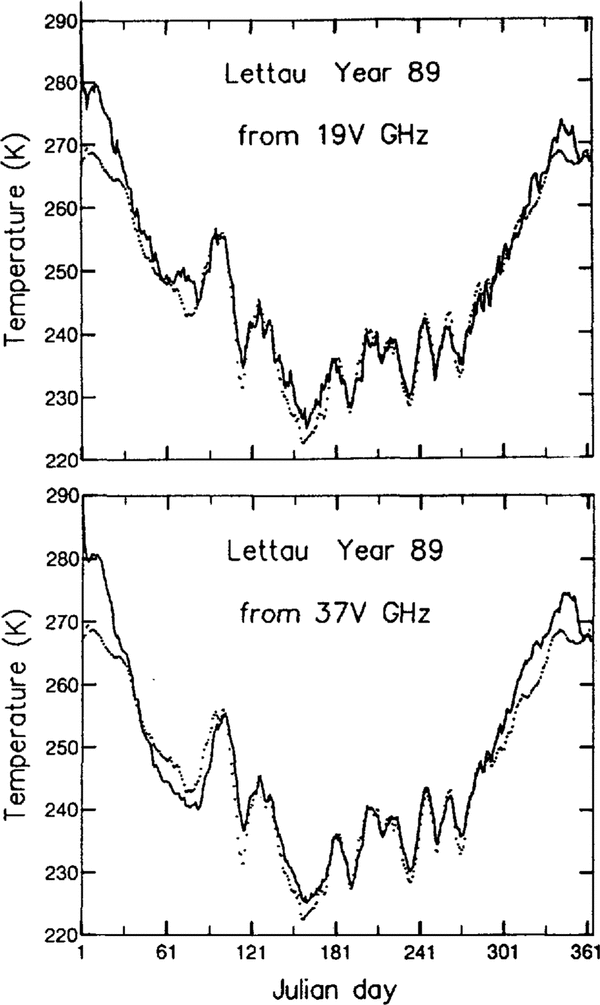
Brightness temperatures are shown in Figure 5 for Dome C and in Figure 6 for Lettau. Despite the simplicity of the model, the mean quadratic error E between the measured and calculated brightness temperatures is small, especially at Dome C (Table 1 ).
Measured (dotted line) and calculated (solid line)brightness temperatures for frequencies 19V, 22V and37V GHz at Dome C for the year 1989.

Measured (dotted line) and calculated (solid line) brightness temperatures for frequencies 19V, 22V and 37VGHz at Lettau for the year 1.989.

The main brightness temperature variations are maintained both for Dome C and Lettau. However, some differences appear between the absolute values, for which various explanations are proposed:
Computed extinction coefficients Ke andpenetration depths Dp; ϵis the mean quadratic errorbetween measured and calculated brightness temperatures

The computed brightness-temperature over estimation at the end of winter at Dome C (Fig. 5) could be due to a snow-surface temperature over estimation (particularly during the AWS strong variations).
The large difference in summer, especially at Lettau(5-10 K; Fig. 6) may be attributed mainly to atmospheric effects; under estimation of the snow-surface temperature from the air temperature may also have a small influence.
The assumption of a constant emissivity during the year seems valid for regions such as Dome C where the penetration depths are great and where the snow characteristics do not vary much; but, for regions with small penetration depths or for high frequencies, the emissivity may change more frequently due to variations in the top layer of snow with snowfalls and snow metamorphism.
The way in which the mean daily brightness temperature for one grid cell is calculated. We do not know if the raw data for each cell are well sampled through the entire day and a bias could therefore be introduced.
The inaccuracies of the extinction coefficient and of the snow conductivity are discussed subsequently.
4.4. Sensitivity study
In Equation (2), there are two essential parameters: the snow conductivity K and the extinction coefficient K e; however, these coefficients are not well known. The snow conductivity is complex because snow is an inhomogeneous medium in which convection takes place. The determination of the extinction coefficient K e requires knowledge of the snow-mantle stratigraphy and modeling of the snow/electromagnetic Nave interactions.
The effects of K eon the calculated brightness temperatures were studied by increasing or decreasing its value by 50%. Results are given for 19V GHz at Dome C (Fig. 7). By increasing K e, the amplitudes of brightness-temperature variations are increased: a smaller snow depth is taken into account so the contribution of the surface is greater. The opposite occurs when K e is reduced; the variations are attenuated. The same effect sare observed at other frequencies; however, the effects are weaker at 37V GHz because a smaller depth of snow is taken into account.
.Calculated brightness temperatures for different extinction coefficients and with a constant conductivity: K c computed previously and equal to 1.35 m-1(solid line),K e+ 50% (dotted line) and Ke - 50% (dashed line).

The conductivity has the same effects as the extinction coefficient on the amplitude variations but is less pronounced in the range of ±50% around its nominal value.
In conclusion, the errors in K or K ecould explain some of the small differences observed between the measured and the computed brightness temperatures but not the large discrepancies observed in summer at Lettau.
4.5. Phase-difference observation
Because of the different penetration depths at the various frequencies, and because of the propagation time of the heat wave, there is a phase difference between the temporal variations of the brightness temperature at one frequency and the temporal variations of the surface temperature or of the brightness temperature at another frequency. These phase differences can be observed in Figure 2.
The phase difference was computed from the summer data (November-February) at Dome C because the incident solar flux and then the snow-surface temperature vary sinusoidally during this period. A cosine function was fitted to the summer air and brightness temperatures, from which the following phase differences were found:

These phase differences depend on the extinction coefficient and on the conductivity; if the incident flux varies inusoidally, there is an analytical solution for the heat equation, which represents an exponentially decaying wave with an attenuation depth of z 0Replacing the expression for the temperature profile in the radiative-transfer Equation (2), the phase difference φ between the surface temperature and the brightness temperature is given by:

with: τ= K/ρC diffusivity,ω=2π/T,T is the period.
With the previously computed phase differences we find:

They are in the same range as the extinction coefficientscalculated previously (Table 1 ).
The aim of this preliminary work on phase differences is to show that valuable information can be obtained on 301 361 the penetration depth by looking at this single parameter.
5. The Inversion Model
The advantage of using such simple models as described above is the possibility, by combining Equation (2) with the finite-difference method, of expressing the surface temperature at day j as a function of the measured brightness temperature and of the computed temperature profile at the day (j - 1) (see Equation (3)).
The finite-difference method gives:

with: M tri-diagonal matrix (n, n); n IS the number of space discretizations.  temperature profile at time j (dimension n).
 temperature profile at time (j - 1) (dimension n),with boundary conditions: the surface temperature is the one at day j. the temperature gradient equals zero at 20 m depth.
 can be factored


Replacing the temperature profile in the radiative-transfer Equation (2), we obtain:


Ti(z) represents  in the analytical equation and TB
mes the measured brightness temperature.
AWS temperatures (dotted line) and snow-surface temperatures (solid line) computed from 19V and 37V measured brightness temperatures at Dome C for the year 1989. Before computation, the measured brightness temperatures were smoothed by a running mean over 10 d.

However, this method requires an initial profile, a mean annual temperature (to calculate and know-ledge of the extinction coefficient. First, the method is iterated for the entire year with the extinction coefficients calculated previously by the least-square method. The measured brightness temperatures (TB
mes) were first smoothed by a running mean over 10d to avoid too much noise.
Results are given in Figure 8 for Dome C and in Figure 9 for Lettau. The temperatures retrieved from the measured brightness temperatures are the snow-surface temperatures. They are compared with the air (AWS) temperatures in these figures.
AWS temperatures (dotted line) and computed snow-surface temperatures (solid line) computed from 19V and 37V measured brightness temperatures at Lettau for the year 1989. Before computation) the measured brightness temperatures were smoothed by a running mean over 10 d.

As observed with the direct model, large errors occur in summer when the atmospheric effects are greater, and some temperatures are even greater than 273 K. However, a positive point is that the iterative process does not diverge despite the errors at the beginning due to the initialization of the profile independently from measured brightness temperatures (Fig. 9). The wrong surface-temperature values are quickly “forgotten”, due to the small penetration depths.
For Dome C, the retrieval with 37V GHz gives good results (Fig. 8). For 19VGHz, the retrieved signal is much more noisy; due to a small extinction coefficient, the integral I 1 in Equation (3) is very small. Thus, a small error in the measured brightness temperature or the in accuracy of the radiative-transfer equation can lead to large errors in the computed snow-surface temperature. More over, the penetration depth is great and the errors propagate for a long time.
The remarks concerning the different approximations we have made for the direct model are also valid for the inversion mode
6 Conclusion
The objective of this preliminary work was to study the possibilities of introducing a temperature profile in a simple model and to reverse this model to retrieve surface temperatures.
The direct model proposed in this paper is based on radiative transfer; it enables us to compute the microwave penetration depths in snow from surface temperatures and measured brightness temperatures or to retrieve the brightness temperatures if the penetration depth is known. A constant emissivity is assumed, this assumption is more valid when the penetration depth is large.
This semi-empirical model does not take completely into account the complex internal structure of the snow mantle but, because of its simplicity, it can be reversed in order to retrieve the snow-surface temperatures from measured brightness temperatures without knowledge of the stratigraphy. However, this inversion model requires knowledge of the mean annual temperature, an initial profile and the extinction coefficient.
To improve the model:
The initial profile or the mean annual temperature may be computed by iteration from an approximated value.
The extinction coefficients could be determined independently by studying the spectral signatures or by improving the method of computing the extinction coefficient with phase differences.
A seasonal emissivity could be introduced.
The atmospheric effects in summer should be taken into account. It will also be necessary to validate the thermodynamic model with ground data such as snow-temperature profiles.
Another interesting possibility is to use thermal infrared remote sensing. Thermal IR is directly linked to the snow-surface temperature but has the inconvenience of being strongly dependent on the atmosphere, especially on clouds and water vapor. However, if IR data are available for a few cloud-free days, it would be possible to determine the surface temperature for these days and to use them as tie points to calibrate the inversion model from microwave brightness temperatures.
At the present state, the computed temperatures are not accurate enough for climatological studies; however, this method is promising for retrieving surface temperatures over the ice sheet where ground data are very rare.
Acknowledgements
We are grateful to the National Snow and Ice Data Center, Colorado, U.S.A., for providing the SSMI data and to the Department of Meteorology of the University of Wisconsin for providing the Automatic Weather Station data. We should like to thank R. Lestringant from LGGE for helpful discussions.