



1. Introduction
We are interested in turbulent mixing and internal wave dynamics induced by wind action in a stratified basin, archetypal of lakes or reservoirs. During the summer season, stable stratification develops that can be approximated by a three-layer model: an upper, well-mixed layer (epilimnion) with warm water; a transitional middle layer (metalimnion) with a high temperature gradient; and a bottom layer (hypolimnion) with cold and low-momentum water, isolated from the more energetic upper layer by the stable stratification in the metalimnion. The surface with the highest temperature gradient inside the metalimnion identifies the thermocline.
When the thicknesses of the epilimnion and hypolimnion are much larger than that of the metalimnion, the system can be approximated as composed of two layers with different densities which meet at the thermocline. In a closed basin, the main hydrodynamic forcing is wind stress. The response of a two-layer system to the wind shear stress is controlled by the Wedderburn number  $W$ (Thompson & Imberger Reference Thompson and Imberger1980; Imberger & Hamblin Reference Imberger and Hamblin1982), which is defined as the ratio between the baroclinic restoring force and the wind driving force,
 \begin{equation} W=\frac{g'h_1^2}{u_*^2L}. \end{equation}
Here  $g'=g\Delta \rho /\rho _0$ is the reduced gravity based on the density difference
 $\Delta \rho$ across the thermocline with density
 $\rho _0$;
 $g$ is the gravitational acceleration;
 $h_1$ is the thickness of the upper layer;
 $L$ is the length of the lake; and
 $u_*^2=\tau$ is the square of the friction velocity resulting from the kinematic wind shear stress over the water surface
 $\tau$. All the above and the other parameters used in this paper are listed in table 1.
Dimensional and non-dimensional parameters.

The action of the wind shear stress leads to the displacement of the thermocline. For steady wind, an analytical solution for the steady displacement is obtained, given by the balance between the baroclinic gravitational pressure force due to the tilted thermocline and the force due to the wind stress (Boegman Reference Boegman2009). When this solution is put into  $W$,
 $W^{-1}\approx \eta _0/h_1$, where
 $\eta _0$ is the steady-state vertical displacement of the thermocline at the endwalls. This solution allows the simplified interpretation of
 $W^{-1}$ as the portion of
 $h_1$ that is occupied by the displacement of the thermocline at the upwind endwall.
When the wind stops blowing and the surface stress is relaxed, a wave field forms and degenerates in time. As initially observed by Mortimer (Reference Mortimer1953) for various lakes, the internal wave field is dominated by basin-scale linear waves or internal seiches, which are the solution of the linear wave equation for the initial condition with inclined interface. This linear equation also allows the development of higher horizontal odd modes of linear waves. The period of the internal seiches is
 \begin{equation} T_i^{(n)}=\frac{2L}{nc_0},\end{equation}
where  $c_0=\sqrt {{g'h_1h_2}/{H}}$ is the linear long-wave speed,
 $h_2$ is the bottom layer thickness,
 $H$ is the depth of the reservoir and
 $n$ denotes the seiche's horizontal modal structure. If the amplitude of the internal seiches is large enough, nonlinear effects become significant, causing the occurrence of other wave modes including even horizontal modes.
The steepening of long waves due to nonlinear effects results in the formation of internal solitary-like waves. Associated with the nonlinearities is a steepening time scale  $T_s=L/(\alpha _{NL}\eta _0)$ where
 $\eta _0$ is the maximum displacement of the interface and
 $\alpha _{NL}=(3/2)c_0(h_2-h_1)/(h_1 h_2)$ is a nonlinear coefficient. As the wave steepens, the effects of dispersion increase and balance out the nonlinear steepening, leading to the generation of high-frequency solitary waves with permanent form. Horn, Imberger & Ivey (Reference Horn, Imberger and Ivey2001) and Boegman, Ivey & Imberger (Reference Boegman, Ivey and Imberger2005b) carried out a thorough theoretical and experimental analysis of the degeneration of the internal wave field. In general, high-frequency internal waves can be grouped into two fundamental classes: waves described by linear stability models, which are associated with shear instability; and waves described by weakly nonlinear models such as solitary waves, internal hydraulic jumps and waves excited by flow interaction with the boundaries (Boegman et al. Reference Boegman, Imberger, Ivey and Antenucci2003). As shown by Boegman et al. (Reference Boegman, Imberger, Ivey and Antenucci2003), waves associated with shear instability dissipate their energy locally, while nonlinear waves propagate to the boundary where they dissipate their energy through interactions with the boundary.
In lakes where the thicknesses of the metalimnion and epilimnion are comparable, which is often the case for the small and mid-sized lakes in which we are interested, the two-layer approximation is no longer valid and a response in terms of high-order vertical modes is possible. For example, the second vertical mode can be described as a variation of the thickness of the metalimnion, where the upper and lower edges of the metalimnion do not oscillate in phase.
The second vertical mode was mathematically described by using a three-layer stratification (see, among others, Csanady Reference Csanady1982; Monismith Reference Monismith1985; Münnich, Wüest & Imboden Reference Münnich, Wüest and Imboden1992), and more accurately using the continuous stratification model to calculate both the second-order (Münnich et al. Reference Münnich, Wüest and Imboden1992) and the higher-order vertical modes (LaZerte Reference LaZerte1980). Observations show that the occurrence of these modes strongly depends on the thickness of the metalimnion (Roget, Salvadé & Zamboni Reference Roget, Salvadé and Zamboni1997; Vidal, Rueda & Casamitjana Reference Vidal, Rueda and Casamitjana2007; MacIntyre et al. Reference MacIntyre, Clark, Jellison and Fram2009), the duration of forcing (Wiegand & Chamberlain Reference Wiegand and Chamberlain1987; Münnich et al. Reference Münnich, Wüest and Imboden1992; Vidal et al. Reference Vidal, Rueda and Casamitjana2007; Valerio et al. Reference Valerio, Pilotti, Marti and Imberger2012) and the bathymetry (Münnich Reference Münnich1996).
Most situations are characterized by wind stress oscillating according to a diurnal cycle, typically due to atmospheric circulations such as anabatic/katabatic winds and lake breezes. Oscillatory forcing was experimentally investigated by Boegman & Ivey (Reference Boegman and Ivey2007, Reference Boegman and Ivey2012) with an oscillating tank and by Rozas et al. (Reference Rozas, de la Fuente, Ulloa, Davies and Niño2014) by applying a moving belt, both using an experimental set-up with a two-layer stratification, therefore allowing only for the development of the first vertical mode. Boegman & Ivey (Reference Boegman and Ivey2007, Reference Boegman and Ivey2012) found that the response to the forcing is controlled by the ratio between the forcing period  $T_w$ and the fundamental oscillatory period, which we denote as
 $T_1=T_i^{(1)}$, calculated according to (1.2). We will denote this ratio as
 $r_T=T_w/T_1$. For
 $r_T<0.5$, internal seiches with higher horizontal mode occur; for
 $0.5< r_T<1.5$, a resonant fundamental internal seiche V1H1 develops; and for
 $r_T>1.5$, a non-resonant forced V1H1 internal seiche is present, where V1H1 denotes a combination of first vertical mode and first horizontal mode.
In general cases, the endwalls (beaches) of a lake are not vertical. Mixing in the near-shore region can originate from the interaction of boundaries and seiching currents or breaking of high-frequency waves.
Internal seiches induce upslope/downslope flow along the inclined walls and can cause the periodic occurrence of convective mixing. During an upwelling event, currents can transport heavier deep water over lighter surface water, leading to unstable stratification and consequent mixing. This process is described by Lorke, Peeters & Wüest (Reference Lorke, Peeters and Wüest2005) as shear-induced convection.
Breaking of the high-frequency progressive nonlinear internal waves (NLIWs) on the slopes has been extensively investigated via laboratory experiments (Helfrich Reference Helfrich1992; Michallet & Ivey Reference Michallet and Ivey1999; Boegman, Ivey & Imberger Reference Boegman, Ivey and Imberger2005a; Boegman & Ivey Reference Boegman and Ivey2009) and numerical simulations (Vlasenko & Hutter Reference Vlasenko and Hutter2002; Aghsaee, Boegman & Lamb Reference Aghsaee, Boegman and Lamb2010; Arthur & Fringer Reference Arthur and Fringer2014, Reference Arthur and Fringer2016). In the experiments of Michallet & Ivey (Reference Michallet and Ivey1999) it was found that mixing efficiency is low for small and large slopes; consistent with these findings are the results of Boegman et al. (Reference Boegman, Ivey and Imberger2005a) who analysed mixing efficiency with respect to the Iribarren number, which is the ratio of the beach slope to the wave slope, and found that mixing efficiency is highest for intermediate values of this parameter, which correspond to medium slopes. Wave breaking at the sloped walls can be described by the rotor model (Thorpe Reference Thorpe1998); breaking leads to diapycnal mixing, mainly in the lower layer, producing water of intermediate density that forms an intrusion and flows along isopycnals towards the body of the lake (Wain et al. Reference Wain, Kohn, Scanlon and Rehmann2013).
Boundary mixing induced by the high-frequency internal waves was observed by Lorke (Reference Lorke2007), while MacIntyre et al. (Reference MacIntyre, Clark, Jellison and Fram2009) and Wain & Rehmann (Reference Wain and Rehmann2010) found boundary mixing caused by low-frequency waves which correspond to internal seiches.
Although there have been many studies regarding internal waves, most of them used simplified models in terms of an idealized basin (e.g. Monismith Reference Monismith1987), two-layer models for stratification (e.g. Horn, Mortimer & Schwab Reference Horn, Mortimer and Schwab1986), or constant mean density profile, where perturbations of density field correspond only to seiche motion (e.g. Fricker & Nepf Reference Fricker and Nepf2000). More recently, Ulloa et al. (Reference Ulloa, Constantinescu, Chang, Horna-Munoz, Steiner, Bouffard and Wüest2019, Reference Ulloa, Constantinescu, Chang, Horna-Munoz, Hames and Wüest2020) employed large-eddy simulation (LES) to study the hydrodynamics of a full-scale lake. In Ulloa et al. (Reference Ulloa, Constantinescu, Chang, Horna-Munoz, Steiner, Bouffard and Wüest2019) a case-study investigation was conducted for the summer conditions in Lake Alpnach, Switzerland. A periodic diurnal forcing yielded a near-resonant V2H1 wave response, along with other non-resonant vertical modes. Besides the wave analysis, they investigated turbulence and mixing and identified episodic mixing at the sloped walls as a significant factor in overall mixing. In Ulloa et al. (Reference Ulloa, Constantinescu, Chang, Horna-Munoz, Hames and Wüest2020) different resonant wave responses (quasi-linear V1H1, V2H1 and nonlinear V2H1) to periodic forcing were obtained by varying the level of stratification in a three-layer stratified basin with sloping walls. The main focus of their investigation was the analysis of transport processes under the fully developed resonant wave regimes.
Similarly, we use LES to analyse the wave responses of a basin to periodic wind stress, mainly focusing on the influence of variations of forcing and bathymetry at a laboratory scale. The general set-up of our simulations is similar to that of Ulloa et al. (Reference Ulloa, Constantinescu, Chang, Horna-Munoz, Hames and Wüest2020) in that we apply periodic stress to a three-layer stratified domain with sloped walls; however, the focus of our research is substantially different, since we inspect the initial development of the wave response. This is an important issue, since in real systems often the wind stress regime does not allow a steady arrangement of the internal wave system, which, rather, often moves through successive transitional states.
Specifically, we investigate the response of a three-layer stratified basin to an oscillating surface shear stress. The three-layer model for the stratification is such that the proportions of layer thicknesses are similar to those typical of alpine mid-sized lakes (data from Magni et al. Reference Magni, Chinaglia, Maffotti, Borasi, Lefebvre, Zanella, Brancelj, Mori, Pagon and Urbanc-Berčič2008). We consider different forcing periods and study the initial and internal adjustment of the wave response to the forcing, and the feedback that sloped endwalls have on the wave field and mixing. Our focus is on two main issues: the response of the system to different forcing periods, quantified by different values of  $r_T$, and the influence of the slope of the endwalls on mixing and internal wave dynamics. The study is carried out at a laboratory scale, characterized by scale effects with respect to the Reynolds number.
At the present stage of the research, we are interested in lakes that are not affected by the Earth's rotation. The Coriolis force is negligible for mid-latitude small and mid-sized lakes (up to  $\approx$5 km). For a typical geometry and stratification profile of this class of lakes, only large ones (
 $\approx$5 km) may have a fundamental period that matches the diurnal forcing period (
 $r_T=1$); smaller lakes generally have a fundamental period that is several times smaller than a day. That is why we will focus on
 $r_T\geq 1$.
The paper is organized in the following way. In § 2 we describe the numerical model, which is validated in Appendix A, by reproducing experiments relevant for the purposes of our research. In § 3 the response of the system with vertical endwalls is considered. In § 4 we analyse the influence of the variations of the angles of the endwalls. In § 5 we give concluding remarks. Appendix B contains results of regridding tests for the case study.
2. Mathematical model
The flow we investigate in the present paper is characterized by the coexistence of internal waves and turbulence. We will see that mechanical turbulence is generated in the near-surface layer, in the corner flow due to the presence of a downward jet and processes that take place at the sloped walls. Also, wave breaking at the slope walls produces turbulence which flows into the interior; reproduction of these mechanisms needs eddy-resolving simulations, either direct numerical simulation (DNS) or LES. The former would need a resolution of the near-wall and free-surface thin viscous layer; the latter requiring a huge and unjustified resolution in a flow region not central for the scopes of the present research. For this reason, our strategy was to use LES in conjunction with a wall-layer model of the wind stress at the free surface, which accurately reproduces the mechanism of generation of mechanical turbulence at the free surface. On the other hand, since the flow may stand in a transitional regime, due to the above-mentioned interaction between turbulence and internal waves and to the periodic forcing, we use a dynamic Lagrangian model, which is well known in the literature to be able to reproduce accurately flows characterized by transitional and intermittent turbulence. Specifically, the model automatically switches off in regions of relaminarization and switches on in the presence of turbulence, to reproduce significant subgrid-scale (SGS) events, whenever they occur. We solve the set of filtered three-dimensional Navier–Stokes equations under the Boussinesq approximation for the density field:
 $$\begin{gather} \frac{\partial\bar u_j}{\partial x_j}=0, \end{gather}$$
 $$\begin{gather}\frac{\partial\bar u_i}{\partial t}+\frac{\partial}{\partial x_j}(\bar{u}_i \bar{u}_j) ={-}\frac{\partial \bar{p} }{\partial x_i} +g_i\frac{\rho}{\rho_0} + \frac{\partial}{\partial x_j} \left\{\nu_{eff}\left[\left(\frac{\partial \bar{u}_i}{\partial x_j}+\frac{\partial \bar u_j}{\partial x_i}\right)-\frac 2 3 \left(\frac{\partial\bar u_k}{\partial x_k}\delta_{ij}\right)\right]\right\}, \end{gather}$$
 $$\begin{gather}\frac{\partial\bar \rho}{\partial t}+\frac{\partial}{\partial x_j}(\overline{\rho u}_j) = \frac{\partial}{\partial x_k}\left(\kappa_{eff}\frac{\partial\bar \rho}{\partial x_k} \right). \end{gather}$$
In (2.1)–(2.3), the overbar denotes a filtering operation,  $u_i$ is the velocity component along the
 $x_i$ direction (hereafter we use
 $x_1,x_2,x_3$ and
 $x,y,z$, respectively, for along-wind, transverse and vertically upward directions),
 $p$ is pressure divided by the bulk density
 $\rho _0$,
 $\boldsymbol {g} \equiv (0,0,-g)$ is the gravitational acceleration vector,
 $\nu _{eff}=\nu +\nu _{SGS}$ is the sum of the kinematic viscosity
 $\nu$ and the SGS turbulent viscosity
 $\nu _{SGS}$,
 $\rho$ is the fluid density, and
 $\kappa _{eff} = \nu /Sc+\nu _{SGS}/Sc_{SGS}$ is sum of molecular and SGS diffusivity of a dissolved phase (i.e. salt), with
 $Sc$ and
 $Sc_{SGS}$ being the molecular and SGS Schmidt number, respectively.
The SGS tensor, which comes out from filtering the Navier–Stokes equations,  $\tau _{ij}=\overline {u_iu_j}-\bar u_i \bar u_j$, is here parametrized using the eddy viscosity assumption:
 \begin{equation} \tau_{ij}-\frac{\delta_{ij}}3 \tau_{kk}={-}2\nu_{SGS}\bar S_{ij},\end{equation}
where  $\bar S_{ij}=\frac 12({\partial \bar u_i}/{\partial x_j}+{\partial \bar u_j}/{\partial x_i})$ is the filtered strain-rate tensor. The SGS viscosity is related to the strain-rate tensor (Smagorinsky Reference Smagorinsky1963) as
 \begin{equation} \nu_{SGS}=c_S^2 \varDelta^2 |\bar S_{ij}|,\end{equation}
where  $\varDelta =(\varDelta _x \varDelta _y \varDelta _z)^{1/3}$ is the filter width computed using the local cell width and
 $c_S^2$ is the Smagorinsky constant for SGS momentum fluxes. Here the constant is determined dynamically using the Lagrangian dynamic SGS model of Meneveau, Lund & Cabot (Reference Meneveau, Lund and Cabot1996) as implemented by Cintolesi, Petronio & Armenio (Reference Cintolesi, Petronio and Armenio2015). For SGS concentration diffusivity, we use the Reynolds analogy
 $\kappa _{SGS}=\nu _{SGS}/Sc_{SGS}$, with
 $Sc_{SGS}=1$. The Schmidt number is set to
 $Sc=\nu /\kappa =500$ as discussed in Lienhard & Atta (Reference Lienhard and Atta1990) and Liu (Reference Liu1995), while
 $\nu = 10^{-6}\ \mbox {m}^2\ \mbox {s}^{-1}$. The choice of the Schmidt number corresponds to use of salt as the stratifying agent, and it is consistent with the laboratory-like set-up that we choose for our numerical experiments. Though most stratified lakes are subject to thermal stratification, a number of closed basins are characterized by salt stratification, which is typically much stronger than the thermal one (Boehrer & Schultze Reference Boehrer and Schultze2008). Regardless of the type of stratification, our set-up is relevant for the internal wave dynamics in stratified lakes, which is the main focus of our investigation.
As initial condition, we consider a fluid at rest with a piecewise-linear density stratification:
 \begin{equation} \rho(\boldsymbol{x},t=0)= \left\{ \begin{array}{@{}ll} \rho_1 & \mbox{if } z \geq h_{m1} , \\ \dfrac{\rho_2-\rho_1}{h_{m2}-h_{m1}}(h_{m2}-z) +\rho_2 & \mbox{if } h_{m2} < z < h_{m1} , \\ \rho_2 & \mbox{if } z \leq h_{m2} , \end{array} \right.\end{equation}
where  $\rho _1$ and
 $\rho _2$ are the densities of the upper and lower layer, and
 $h_{m1} = h_2-0.5\Delta h$ and
 $h_{m2} = h_2+0.5\Delta h$ are the heights of the edges of the middle layer. The vertical coordinate
 $z$ is zero at the bottom and positive upwards. The positions and thicknesses of the layers are sketched in figure 1.
Sketch of the simulation set-up with the main parameters and locations of the probes.

Since large movements of the free surface are not expected in the cases under investigation (Boegman Reference Boegman2009), the free surface is approximated as a rigid lid and the periodic wind stress with period  $T_w$ is represented through sinusoidal kinematic shear stress implemented as
 \begin{equation} \tau=(\nu+\nu_{w})\frac{\partial u}{\partial z}=u_*^2\sin\left(\frac{2{\rm \pi} t}{T_w}\right),\quad \frac{\partial v}{\partial z}=0,\quad w=0, \end{equation}
where  $\nu _{w}$ is calculated with a wall function that generates a near-wall value of
 $\nu _{w}$ based on the modelled kinetic energy (Robertson et al. Reference Robertson, Choudhury, Bhushan and Walters2015; Liu Reference Liu2016).
We use  $u \equiv u_1$,
 $v \equiv u_2$ and
 $w\equiv u_3$. Horizontal stress components are energized with the addition of random fluctuations with zero average. In the
 $x$ and
 $y$ directions, fluctuations were 20 % and 1 %, respectively, of the mean value of
 $\tau$. We use no-slip conditions along the solid walls.
The boundary condition for the density field is zero gradient for surface, bottom and endwalls (no-flux conditions). We consider a two-dimensional problem, meaning that the problem is, in a Reynolds-averaging sense, two-dimensional. Hence, we use a three-dimensional domain with periodic conditions along the cross-stream  $x_2$ or
 $y$ direction.
The Courant number is defined as  $Co=c_0 \Delta t/ \Delta x$, with
 $c_0$ the internal wave speed,
 $\Delta t$ the time step and
 $\Delta x$ the cell length. To properly resolve the wave field,
 $C_0 \sim 0.2$ is obtained using
 $\Delta t=0.01\ \mbox {s}$. For larger time steps (i.e.
 $\Delta t=0.02$), non-physical high-frequency waves develop at the interface.
The Navier–Stokes equations are integrated in time using the PISO (pressure implicit with splitting of operators) algorithm (Issa, Gosman & Watkins Reference Issa, Gosman and Watkins1986). For the time scheme, we used the Crank–Nicolson scheme (Crank & Nicolson Reference Crank and Nicolson1947), for spatial derivatives we use central differences, and for the divergence operator we use the Van Leer scheme (Van Leer Reference Van Leer1974). The system of equations is solved using the solver buoyantBoussinesqPimpleFoam implemented in the OpenFOAM library (Jasak Reference Jasak1996; Weller et al. Reference Weller, Tabor, Jasak and Fureby1998; Chen et al. Reference Chen, Xiong, Morris, Paterson, Sergeev and Wang2014). The solver has been extensively validated in a number of cases, including variable-density flows (see, among others, Cintolesi et al. Reference Cintolesi, Petronio and Armenio2015).
In order to calculate turbulent statistics, we will decompose the filtered field in a Reynolds-averaging sense as  $\bar {\theta }(t)=\langle \theta \rangle + \theta ''(t)$, where
 $\theta$ represents a generic field quantity,
 $\langle \theta \rangle$ represents the mean value and
 $\theta ''(t)$ represents the resolved part of the fluctuating field. Note that the total fluctuating field is the sum of resolved fluctuations plus SGS ones
 $\theta '(t)=\theta ''(t)+\theta _{SGS}$. The quantity
 $\theta _{SGS}$ is unknown in a deterministic sense, but one can write that the generic field is a sum of resolved and SGS ones, specifically for the turbulence dissipation rate
 $\epsilon = \epsilon _{RES} + \epsilon _{SGS}$. The resolved part comes from post-processing the LES resolved field, and the SGS part comes from the SGS model.
In the rest of the paper we omit the overbar for the filtered quantities. We anticipate that, since the grid resolution of our numerical experiments is high, in our simulations most of the turbulent spectrum is resolved directly during the simulation and the residual SGS stresses are low. After the initialization of the wave response, the modelled  $\nu _{SGS}$ is quite low throughout the interior due to the grid resolution and the nature of the flow. The highest values are about
 $2\nu$, and they are located near the surface and at the intersection of the stratified middle layer and endwalls. This indicates that the flow field is well resolved by the grid used herein and also classifies our simulation as quasi-DNS, according to the definition given in Spalart (Reference Spalart2000). This family of simulations is well known in the literature and indicates the case when most of the turbulent spectrum is directly resolved in the simulations. Apart from fully turbulent fields (see, among others, Armenio & Piomelli Reference Armenio and Piomelli2000), these simulations are especially suited for simulation of transitional flows, like that of the present study.
3. Analysis of the rectangular basin response to oscillating surface shear stress
We perform laboratory-scale numerical experiments of a stably stratified basin subject to periodic surface stress, mimicking the effect of a daily-cycle breeze over the surface of a stratified lake.
Here, we first discuss the case of vertical endwalls  $(\alpha = 90^\circ )$ and discuss the response of the basin with respect to the oscillatory modes. The importance of using idealized basins, such as rectangular, stands in the fact that results of simulations can be compared to analytical solutions and experimental data, which typically consider the idealized rectangular domain. In addition, this geometry yields results that are easier to interpret, as they are free from complex processes that take place at the sloping walls.
The dimensions of the domain are, respectively, length  $L=2\ \mbox {m}$, depth
 $H=0.2\ \mbox {m}$ and cross-stream extension of the computational domain
 $B=H$. The conditions of the simulation are summarized in table 2. The density difference used herein is typical for laboratory-scale experiments, while the vertical stratification profile, namely the thickness of the three layers, is typical for medium and small lakes. We will label the surface and bottom layers as epilimnion and hypolimnion, respectively, and transitional layer as metalimnion. The density distribution used herein, characterized by the thickness of the metalimnion being comparable to those of the other layers, is well known to favour the development of internal waves with higher vertical modes. The steepening time scale
 $T_s$ presented in table 2 is calculated as a reference value using the approximation
 $\eta _0\approx h_1/W$. A sinusoidal kinematic shear stress applied to the surface is set in such a way as to give a ratio
 $r_T\approx 1,2,3$. The initial condition for density and the wind stress boundary condition are sketched in figure 1. Each simulation has a duration of
 $6T_w$.
Main parameters of the numerical experiment.

The computational grid is discretized as  $(n_x\times n_y\times n_z)= (300\times 25\times 80)$, such that the middle layer contains
 $(300 \times 25 \times 16)$ cells. The grid resolution as wall units per cell size
 $\Delta z^+ = \Delta z u_*/\nu$ is
 $(\Delta x^+, \Delta y^+, \Delta z^+) = (37.2,44.6,13.9)$.
For each case, we store time series of isopycnal heights, which were used for spectral analysis. The sampling resolution in time for the time series is  $\Delta t = 0.01$ s. At each time step, we sampled the density profile over the 80 vertical grid points and then interpolated the height for the values of density to be tracked. Time series of isopycnal heights are sampled at
 $0.25L$ (probe A) and
 $0.5L$ (probe B) (see figure 1). Probe B is on a nodal location for odd quasi-linear horizontal waves, and therefore isopycnal fluctuations at this location are indicative of energy transfer to even modes and NLIWs.
We define the interface as  $\rho _0=0.5(\rho _1+\rho _2)$ and we compute the spectral energy of interface height time series. For two isopycnals, respectively above and below the interface (
 $\rho _0-0.25\Delta \rho$ and
 $\rho _0+0.25\Delta \rho$), where
 $\Delta \rho = \rho _2-\rho _1$, we compute the cross power spectral density to indicate the phase lag among them. The absence of a phase lag indicates that the vertical distance between these isopycnals does not vary in time, which corresponds to the behaviour of the first vertical mode, while the existence of a phase lag indicates the existence of higher vertical modes.
To examine the vertical modal structure of the dominant wave response, we show vertical profiles of velocity components and buoyancy frequency squared for each case. The displayed quantities are sampled during the last forcing period when the flow is fully developed. The quantities are averaged over 25 cells in the homogeneous spanwise direction and shown at a time instant, where time is denoted as the phase of the forcing period  $\varphi$, where
 $\varphi = 0$ corresponds to the beginning of the sixth forcing period
 $t = 5T_w$.
When a surface forcing is applied on the rectangular basin at the laboratory scales, the fast near-surface layer rapidly produces downwelling as it reaches the endwall and penetrates through the stratified region. This was observed in the experimental set-ups of Monismith (Reference Monismith1986) and Stevens & Imberger (Reference Stevens and Imberger1996), who prevented this jet-like flow from destroying the stratification by using a sponge at the endwalls. To reduce the effects of the formation of the geometry-related return jet (see Appendix A for details), we apply a stronger stratification and weaker amplitude of forcing, which results in a higher Wedderburn number. This parameter cyclically changes in time, with a minimum ( $W=5$) at the peak of forcing, while it is higher during the rest of the forcing period. The Wedderburn number used in our numerical experiment is representative of situations in real-scale basins exposed to weak to moderate wind forcing. Based on Horn's diagram (Horn et al. Reference Horn, Imberger and Ivey2001) and the parameters used for our set-up,
 $W^{-1}=0.2$ and
 $h_1/H=0.2$, we expect the degeneration of large-scale waves due to damped linear waves and the formation of high-frequency NLIWs.
3.1. Case  $r_T=1$

When  $r_T = 1$, the fundamental V1H1 seiche is directly forced and we obtain a resonant response. In the time series of interface height
 $h_i$ (figure 2a,b), we observe at position A (non-nodal for odd modes) that a wave response with the fundamental period develops, which corresponds to the occurrence of a basin-scale linear wave. As forcing continues, the fundamental response is subject to resonant amplification, and we observe an increase in the wave amplitude. The formation of nonlinear modes is highlighted at position B, which is nodal for odd-mode quasi-linear waves. There, a dominant wave response has a periodicity of half the fundamental period, which corresponds to the V1H2 mode. We observe that the growth of the amplitude of nonlinear waves is roughly ruled by the steepening time scale
 $T_s$; for
 $t>T_s$, the amplitude of nonlinear waves is nearly constant and high-frequency NLIWs develop. These waves can be observed as pulse-like waves that degenerate the large-scale waves marked with a circle in figure 2(a).
(a,b) Time series of non-dimensional interface height  $h_i/H$ for resonant forcing
 $r_T=1$ plotted versus the number of forcing periods at probes A and B, respectively. The signature of the high-frequency NLIWs is marked with a circle and the dashed grey vertical lines denote the non-dimensional time period
 $T_1/T_w$ and multiple values, while the dashed black vertical line denotes the non-dimensional steepening time scale. (c,d) Non-dimensional spectral energy of interface height (lines) and phase lag among isopycnals (grey crosses) at probes A and B, respectively. Vertical dotted lines represent non-dimensional forcing frequency and its
 $m$th superharmonics. Theoretical frequencies of internal seiches are integer values of
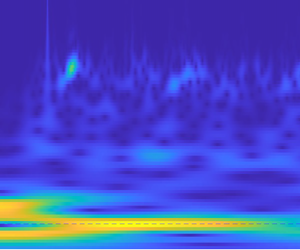
 $f/f_1$. (e,f) Wavelet spectra of interface height sampled at probes A and B, respectively. The dashed white horizontal lines denoted with letters indicate:
 $w$, forcing frequency
 $f_w$; f, fundamental frequency
 $f_1$; and
 $s$, approximate frequency of high-frequency NLIWs
 $\approx f_s$.

While we do not inspect the instantaneous fields for each high-frequency wave that appears in the time series, we note that the Richardson number  $Ri$ (shown in § 4) is generally supercritical except in the near-surface layer; thus we can exclude shear instabilities as theorigin of these waves. The degeneration of the wave field by high-frequency NLIWs is expected based on Horn's diagram, and they are the only high-frequency waves that we observe in instantaneous fields. The high-frequency NLIWs propagate with almost permanent form, and therefore they can be observed at all locations. They decay in time due to viscous wall effects (Koop & Butler Reference Koop and Butler1981; Tang, Patel & Landweber Reference Tang, Patel and Landweber1990) or they deform and disintegrate (Grimshaw et al. Reference Grimshaw, Pelinovsky, Talipova and Kurkina2010). Given that our time series contain many superimposed waves, we cannot directly observe these changes.
The presence of higher horizontal modes is also evident in the energy spectrum of the interface height time series (figure 2c,d). We indicated forcing frequency  $f_w$ and its superharmonics
 $f_{wm}=mf_w$,
 $m=2,3,\ldots$. The fundamental frequency of the basin-scale linear wave is
 $f_1$ and the higher-mode frequencies are calculated as
 $f_n = f_1 /n$. Most energy is confined in the first mode, although appreciable energy is transferred by nonlinear interactions to the second horizontal mode. The excitation of higher horizontal modes up to mode 10 is observable in the spectra. To get information on the vertical structure of the modes identified by energy spikes, we calculate the phase lag (coherence phase interpreted as a phase lag) between the heights of the isopycnals
 $\rho _0\pm 0.25\Delta \rho$. The phase lag is generally very small across all frequencies, indicating that isopycnals maintain approximately constant vertical separation distances so that the system response corresponds to the first vertical mode. The largest phase lag is found only in the middle of the basin (position B) near the fundamental frequency, corresponding to the periodic spreading and contraction of isopycnals at this location.
To better understand the development of the wave field in time, we use the wavelet analysis of the interface height time series (figure 2e,f). The cone of influence is plotted within the white dashed lines; it represents the border between data with accurate time–frequency representation and data in the shaded region where the accuracy of data is potentially influenced by edge effects. Initially, the fundamental mode is energized. After the first forcing cycle, the resonant response begins, which is characterized by the increase of energy in the fundamental mode (figure 2e). With time, energy is gradually transferred towards modes with higher frequencies, and high-frequency NLIWs (approximately denoted by the dashed line  $s$ at a frequency that corresponds to short NLIWs observed in the time series for
 $r_T = 1$) can be observed in the wavelet spectrum of time series from probe B (figure 2f). After the third oscillatory cycle, a quasi-steady state is reached without further changes in energy distribution.
The dominant vertical modes of the internal waves can be identified by looking at the vertical profiles of the velocity components. The vertical profile of streamwise velocity allows identification of the dominant mode; the vertical profile of vertical velocity, which is more sensitive to particular waves passing through the chosen location, helps identification of other higher vertical modes.
In figure 3 we show the vertical profiles of the spanwise-averaged velocity components at probe B at several phases during the oscillatory cycle. We observe the presence of a three-layer structure: the near-surface layer, where stratification is weak, which is characterized by high velocity gradient and a velocity that decreases rapidly up to the beginning of the strongly stratified region; a stratified middle layer, where the velocity decreases with lower shear; and the third layer in the lower unstratified region, where velocity is nearly uniform and changes sign, due to the inversion of the mean current. Overall, the behaviour is that of a two-layer response showing the presence of an upper layer moving along the wind direction and a lower layer moving in the opposite direction. This scenario corresponds to the first vertical mode V1, as described by Monismith (Reference Monismith1985) for a system exposed to surface forcing. Two local maxima of  $\langle N^2 \rangle = -(g/\rho _0) \langle \partial \rho / \partial z\rangle$ form at
 $\varphi =0$ and
 ${\rm \pi}$ and they collapse to a single one at
 $\varphi =0.5{\rm \pi}$ and
 $1.5{\rm \pi}$, indicating that these variations of density profile are not permanent.
Vertical profiles at probe B of (a)  $\langle u \rangle / u_*$, (b)
 $\langle w \rangle / u_*$ and (c)
 $\langle N^2 \rangle$. Curves: ——,
 $\varphi =0$;
 $\cdot \cdot \cdot \cdot \cdot$,
 $\varphi =0.5{\rm \pi}$; – – – –,
 $\varphi ={\rm \pi}$; and –
 $\cdot$ –,
 $\varphi =1.5{\rm \pi}$. The initial position of the middle layer is between
 $z/H = 0.7$ and
 $z/H = 0.9$.

During the resonant two-layer response, the maximum streamwise velocity of the metalimnion is  ${\approx }5u_*$, and it reduces to
 ${\approx }2u_*$ in the hypolimnion. Surface velocity locally reaches values of
 $20u_*$. The near-surface region follows the forcing oscillatory behaviour with a phase lag between streamwise velocity
 $u$ and forcing
 $\tau$ of about
 $\Delta \varphi \approx 0.2{\rm \pi}$.
As observed by Lorke et al. (Reference Lorke, Umlauf, Jonas and Wüest2002), under the influence of seiching, the bottom boundary layer dynamics are governed by the oscillatory nature of the system. In our case, the bottom boundary layer is periodically driven by the internal seiches, as a system response to wind forcing; hence we use a simple analysis for Stokes oscillatory bottom boundary layer (SBL).
The Reynolds number, based on the Stokes viscous penetration length  $\delta _S=\sqrt {2\nu /(2{\rm \pi} f_w)}$, is
 $Re_\delta =U_0 \delta _S/\nu$. As free-stream velocity, we use the maximum velocity of the bottom layer and obtain
 $Re_\delta = 44.5$, which is strictly in the laminar regime – for details see Salon, Armenio & Crise (Reference Salon, Armenio and Crise2007) and references therein. Consistently, we do not observe any indicators of turbulent disturbances. In other words, in the present case the bottom boundary layer generated by the internal seiches is weak and not able to produce substantial turbulence in the hypolimnion. The SBL behaviour matches that observed by Lorke et al. (Reference Lorke, Umlauf, Jonas and Wüest2002) when analysing field data, although in our study a scale effect on Reynolds number is present. Ulloa et al. (Reference Ulloa, Constantinescu, Chang, Horna-Munoz, Steiner, Bouffard and Wüest2019) found a large value of the turbulent intensity parameter in a region near the centre of the basin in their real-scale simulation.
3.2. Case $r_T=2$

Variation of the forcing period dramatically changes the response of the basin. The time series of the interface height for the forcing period  $r_T=2$ is plotted in figure 4(a,b). After the initial fundamental wave response, characterized by a linear wave with the fundamental period (marked with the grey dashed vertical lines), the oscillation adjusts to the forcing period together with the appearance of high-frequency waves. Based on the analysis of Boegman et al. (Reference Boegman, Imberger, Ivey and Antenucci2003) for high-frequency waves, these waves are excited by nonlinear effects and we denote them as high-frequency NLIWs. They cannot be associated with shear instability because they occur in a region where the Richardson number
 $Ri=\langle N^2\rangle /\langle S^2\rangle$ is well above the critical value
 $Ri_{cr}=0.25$ under which shear instability can develop. The nonlinear effects that excite high-frequency NLIWs, in this case, are related to the destruction of the fundamental wave. Their presence just at probe A together with an inspection of the instantaneous field suggests that they are created locally, between probe A and the left endwall, and they travel towards the left endwall, where they lose a substantial part of their energy.
(a,b) Time series of non-dimensional interface height  $h_i/H$ for
 $r_T=2$ plotted versus the number of forcing periods at probes A and B, respectively. The dashed grey vertical lines denote the non-dimensional time period
 $T_1/T_w$ and multiple values, while the dashed black vertical line denotes the non-dimensional steepening time scale. The arrow denotes the fundamental wave destruction event. (c,d) Non-dimensional spectral energy of interface height (lines) and phase lag among isopycnals (grey crosses) at probes A and B, respectively. Vertical dotted lines represent forcing frequency and its
 $m$th superharmonics. Theoretical frequencies of internal seiches are integer values of
 $f/f_1$. (e,f) Wavelet spectra of interface height sampled at probes A and B, respectively. The dashed white horizontal lines denoted with letters indicate:
 $w$, forcing frequency
 $f_w$; f, fundamental frequency
 $f_1$; and
 $s$, approximate frequency of high-frequency NLIWs
 $\approx f_s$.

According to Cooker, Weidman & Bale (Reference Cooker, Weidman and Bale1997) upon collision of a large-amplitude solitary wave with a vertical wall, it loses energy (to a dispersive wave train) and height, which explains why we do not observe these high-amplitude, high-frequency NLIWs later in the time series. Instead, high-frequency waves with lower amplitudes appear and remain present throughout the simulation. Given that the Richardson number is very high in the metalimnion, all of these high-frequency waves are NLIWs. At the nodal location B, the initial response corresponds to even mode V1H2 with frequency  $f_2$. However, as the system basin-scale response adjusts to the forcing conditions, due to energy transfer, so do the higher modes, as the period of the second horizontal mode at location B adjusts to the half-period of forcing
 $f_{w2}$. In this case, we do not observe resonant amplification.
In spectral energy analysis of these time series (figure 4c,d), we can identify forcing frequency  $f_w$ as the most energetic at location A. The energy spike that belongs to the fundamental wave V1H1 is found near
 $f_1$ at the same location. At location B, which is nodal for the fundamental wave, the spike of energy near
 $f_1$ is associated with a wave that occurs as a superharmonic of the forcing frequency near
 $f_1 = f_{w2}$. Higher superharmonics of the forcing frequency can be identified:
 $f_{w3}$ at non-nodal location A; and
 $f_{w4}$ and
 $f_{w5}$ at nodal position B. The phase lag near
 $f_w$ and
 $f_{w4}$ indicates that these waves are in the form of higher vertical modes. There is increased energy in the region with high-frequency NLIWs (circled), which is characterized by the absence of a phase lag, indicating the presence of V1 mode.
The wavelet spectrum analysis of interface height series (figure 4e,f) shows that, initially, both the fundamental frequency and the forcing frequency are energized. During the second forcing period, the energy of the fundamental wave mode decreases rapidly (figure 4e), followed by the transfer of energy to nonlinear waves (figure 4f) and towards the high-frequency NLIWs. Upon transfer, energy is soon dispersed. After the decay of the fundamental mode, the energy of the wave with the frequency of forcing  $f_w$ rises. Part of this energy is transferred to higher modes
 $f_{wm}$ up to the high-frequency NLIWs that develop as a result of steepening of the nonlinear waves.
Antenucci, Imberger & Saggio (Reference Antenucci, Imberger and Saggio2000) analysed data from field observations using an analytical model and found that a forcing period equal to that of the internal wave is not enough for resonant amplification. If the wave is pre-existing, the phase between wind and wave plays an important role. A zero phase causes resonant amplification, while a phase equal to  $180^\circ$ (half-period) causes antiresonance and wave cancellation. Vidal et al. (Reference Vidal, Rueda and Casamitjana2007) further hypothesized that strong wind events that are out of phase with the dominant wave drain its energy and energize other vertical modes. Observing the destruction event on figure 4(a) (marked with an arrow), we see that the existing wave reaches its peak amplitude when forcing is at phase
 $\varphi = 0$, yielding a phase difference between wave and forcing of about a quarter of the forcing period. This difference is enough to drain energy from the fundamental mode and cause a wave cancellation. This process occurs with energy transfer from a quasi-linear fundamental wave to NLIWs, and subsequent energizing of the non-resonant wave with frequency
 $f_w$ and higher vertical mode.
The behaviour of the velocity and density fields during the wave cancellation events is depicted in figure 5. At  $t/T_w = 0.7$ the wave starts its upward motion on the left side of the basin, which can be observed in the time series sampled at location A, and develops positive streamwise velocity
 $u$ in the middle layer, while the forcing produces negative
 $u$ near the surface, which is in the same direction as the flow in the bottom layer. At
 $t/T_w = 0.9$ to
 $t/T_w = 1$, the velocity in the middle layer intensifies, and spread and contraction of the metalimnion occur, respectively, at the left and at the right endwall. At
 $t/T_w=1$ the basin-scale V1 wave is at its own peak and about to start the downward motion (at the left side, where the sampling point is) and to reverse its circulation. At
 $t/T_w = 1.1$ close to the bottom and endwalls,
 $u$ has reversed its direction, while most of the middle and upper layer are still strongly dominated with the forcing-induced velocities from the previous forcing period. At the left side of the basin, where the metalimnion is contracted, short waves appear whose signature in
 $u$ is visible throughout the upper part of the water column. At
 $t/T_w = 1.2$ both density and velocity field are favourable for the formation of V2 waves.
Illustration of the velocity and density fields during the wave cancellation event. Time series display the oscillation of isopycnal  $\rho _0$ at
 $0.25L$ while red areas display the state of the non-dimensional forcing
 $\tau /u_*^2$. The five panels above the time series show internal fields at various times. White lines show the isopycnals in the range
 $\rho _0\pm 0.5\Delta \rho$, arrows show velocity direction and the field is coloured with non-dimensional streamwise velocity
 $u/u_*$.

The increase of the period of oscillation substantially changes the response of the basin; namely, it moves from two-layer to three-layer dynamics. Vertical profiles of the averaged velocity components and squared buoyancy frequency at probe B are shown in figure 6 at different phases during the oscillatory cycle. A clear three-layer response is depicted with two horizontal velocity inversions at the edges of the metalimnion. Basically, in the surface and bottom layers, the flow moves in the same direction, and inversion is present in the intermediate stratified region. This comes from a combination of a spatially evolving wave (typical of oscillatory flows) and the inversion required by mass conservation due to the presence of the endwalls. This structure clearly indicates that the dominant response of the system is in terms of second vertical mode V2 with forcing frequency.
Vertical profiles at probe B of (a)  $\langle u \rangle / u_*$, (b)
 $\langle w \rangle / u_*$ and (c)
 $\langle N^2 \rangle$. Curves: ——-,
 $\varphi =0$;
 $\cdot \cdot \cdot \cdot \cdot$,
 $\varphi =0.5{\rm \pi}$; – – – –,
 $\varphi ={\rm \pi}$; and –
 $\cdot$ –,
 $\varphi =1.5{\rm \pi}$.

The maximum of the streamwise velocity in the metalimnion and hypolimnion is about  $3u_*$ and
 $0.4u_*$, respectively. Vertical velocity is more sensitive to the passage of different waves. Together with profiles with one vertical reversal (at
 $\varphi =0$ and
 $0.5{\rm \pi}$), which corresponds to the second vertical mode, we can observe a profile with no reversals (at
 $\varphi =0.5{\rm \pi}$), which corresponds to the passage of a wave with the first vertical mode. The system adjusts to the forcing period via a second vertical mode, while waves with the first vertical mode remain present. The profile of
 $\langle N^2 \rangle$ shows periodic behaviour, where
 $\langle N^2 \rangle$ increases at
 $\varphi = 0.5{\rm \pi}$ and
 $1.5{\rm \pi}$ and decreases at
 $\varphi = 0{\rm \pi}$ and
 $1{\rm \pi}$. The increase of
 $\langle N^2 \rangle$ corresponds to stronger stratification as a consequence of the contraction of metalimnion, while the decrease of
 $\langle N^2 \rangle$ corresponds to the metalimnion spread, which is a behaviour characteristic of waves with second vertical mode. In this case, the Reynolds number of the bottom SBL is
 $Re_\delta =12.6$ for which the flow is again in the strictly laminar regime.
3.3. Case $r_T=3$

A third forcing period was considered, resulting in the response of the interface height time series depicted in figure 7(a,b). At the non-nodal location A, we observe that the initial response is in terms of a non-resonant fundamental seiche (the fundamental period is marked by vertical dashed grey lines) as predicted for the two-layer system based on the results of Boegman & Ivey (Reference Boegman and Ivey2012). During the third forcing period, the fundamental wave degenerates, and NLIWs become dominant. We note that the fundamental wave is cancelled and re-formed several times. The first cancellation is observed at the beginning of the second forcing period, similarly to the  $r_T=2$ case. A fundamental wave peak appears at forcing phase
 $\varphi =0$, which results in fundamental wave cancellation and formation of a new fundamental wave; the transition is always followed by energy transfer towards higher frequencies and the appearance of the high-frequency NLIWs. At the nodal location B, the initial response has a half-fundamental period, therefore corresponding to V1H2 mode. At the beginning of the second forcing period, even modes and NLIWs with a half-forcing oscillatory period appear, corresponding to forcing superharmonic
 $f_{w2}$. Growth of nonlinear waves and the appearance of NLIWs does not occur at
 $T_s$, so we can argue that their origin is related to processes that are not explained by the two-layer theory from which the steepening time scale
 $T_s$ is derived.
(a,b) Time series of non-dimensional interface height  $h_i/H$ for
 $r_T=3$ plotted versus the number of forcing periods at probes A and B, respectively. The dashed grey vertical lines denote the non-dimensional time period
 $T_1/T_w$ and multiple values, while the dashed black vertical line denotes the non-dimensional steepening time scale. (c,d) Non-dimensional spectral energy of interface height (lines) and phase lag among isopycnals (crosses) at probes A and B, respectively. Vertical dotted lines represent forcing frequency and its
 $m$th superharmonics. Theoretical frequencies of internal seiches are integer values of
 $f/f_1$. (e,f) Wavelet spectra of interface height sampled at probes A and B, respectively. The dashed white horizontal lines denoted with letters indicate:
 $w$, forcing frequency
 $f_w$; f, fundamental frequency
 $f_1$; and
 $s$, approximate frequency of high-frequency NLIWs
 $\approx f_s$.

We show the spectral energy of the interface height time series in figure 7(c,d). At non-nodal location A, the highest-energy peak is found at fundamental and forcing frequencies  $f_1$ and
 $f_w$, respectively; at the nodal location B, the superharmonic
 $f_{w2}$ is even more energetic. At the non-nodal position, peaks of energy can also be observed for superharmonics
 $f_{w4}$ and
 $f_{w5}$ and at the nodal position for
 $f_{w4}$ and
 $f_{w6}$. Phase lag is generally high across most frequencies, indicating that the motion of isopycnals
 $\rho _0\pm 0.25\Delta \rho$ is practically decoupled and that the system responds with higher vertical mode. This is also true for the region with NLIWs.
The wavelet spectrum analysis of the interface height shown in figure 7(e,f) indicates that fundamental and forcing frequencies are dominant at probe A (figure 7e). The wave with fundamental frequency has a particular behaviour with respect to energy content, which is characterized by several events of increase and decrease of energy. These events coincide with the appearance of energy in the higher frequencies. The sudden losses in fundamental wave energy are caused by wave cancellation, due to the phase difference between wave and forcing. Besides the high-frequency NLIWs that originate from the wave cancellation events, there are energy bursts in NLIWs with lower frequencies whose energy increases with each occurrence, which will be discussed later. At location B (figure 7f), substantial energy is contained in the even superharmonic  $f_{w2}$. In fact, energizing of
 $f_{w2}$ coincides with both energy loss from
 $f_w$ and cancellation of
 $f_1$, upon which the energy of
 $f_{w2}$ remains constant throughout the simulation. This leads to the conclusion that the system adjusts to the
 $f_{w2}$ response. Given that this wave is absent at location A, and this location is nodal for H2 waves, we can identify this wave as horizontal H2 mode. The wavelet spectrum analysis of the time record at probe B shows that superharmonics originate from
 $f_{w2}$. Besides, we see the pathways of energy towards high-frequency NLIWs, which occur with period
 $0.5T_w$ (corresponding to
 $f_{w2}$). By inspecting the spanwise-averaged fields at the time instant (discussed in the § 4), we find that these are V2 mode NLIWs that periodically pass through the probe with frequency
 $f_{w2}$.
The vertical profiles of the spanwise-averaged velocity components are shown in figure 8. The streamwise velocity profile (figure 8a) has a three-layer structure similar to that of the  $r_T=2$ case, but it is substantially less uniform across the metalimnion. This indicates that the second vertical mode V2 dominates in the presence of other superimposed waves. Occasionally, metalimnion jet-like behaviour appears, which is related to the V2 response. It reaches a velocity of about
 $4u_*$. By examining the instantaneous fields, we found that this behaviour is associated with the occurrence of V2 high-frequency NLIWs. Similar association of the V2 mode NLIWs with the metalimnic jet is made in Boegman et al. (Reference Boegman, Imberger, Ivey and Antenucci2003). Excluding the jet-like events, the maximum of the streamwise velocity in the middle layer is
 $\approx 2u_*$ and up to
 $\approx 0.4u_*$ in the lower layer. The vertical velocity profile (figure 8b) at
 $\varphi =0.5{\rm \pi}$ clearly belongs to the wave with the second vertical mode, while in other profiles different waves are superimposed. The metalimnion appears deepened compared to other cases (figure 8c), which is partially the consequence of substantially different duration of the numerical experiment. Even in this case (
 $Re_\delta =15.4$), the bottom layer flow is strictly in the laminar regime.
Vertical profiles at probe B of (a)  $\langle u \rangle / u_*$ (the inset shows the metalimnion jet at
 $\varphi =1.6{\rm \pi}$), (b)
 $\langle w \rangle / u_*$ and (c)
 $\langle N^2 \rangle$. Curves: ——-,
 $\varphi =0$;
 $\cdot \cdot \cdot \cdot \cdot$,
 $\varphi =0.5{\rm \pi}$; – – – –,
 $\varphi ={\rm \pi}$; and –
 $\cdot$ –,
 $\varphi =1.5{\rm \pi}$. As before,
 $\varphi$ indicates the phase within the forcing cycle.

Ulloa et al. (Reference Ulloa, Constantinescu, Chang, Horna-Munoz, Hames and Wüest2020) resonantly forced a nonlinear V2H1 wave that is characterized by a V2 undular bore and found that it is followed by a train of V2 high-frequency NLIWs. In our case, a nonlinear V2H2 wave is the dominant response, and its period corresponds to that of the passage of V2 NLIWs; therefore, V2H2 is likely to be the wave they originate from. The inspection of the structure of V2 NLIWs corresponds to the description of Ulloa et al. (Reference Ulloa, Constantinescu, Chang, Horna-Munoz, Hames and Wüest2020), where each wave consists of the two cores with opposite vorticity (not shown). While the association of the nonlinear V2 wave and V2 NLIWs corresponds to that observed by Ulloa et al. (Reference Ulloa, Constantinescu, Chang, Horna-Munoz, Hames and Wüest2020), the general response differs. Namely, we do not observe the differentiation on the quiescent and disturbed part of the domain by the nonlinear wave. This may be because in our case the nonlinear response is a non-resonant wave and there are a variety of other superimposed waves in the field.
3.4. Summary
In basins where metalimnion thickness cannot be neglected and when periodic forcing has period close to or greater than the fundamental one (which is the case for most small and mid-sized lakes), only resonant forcing of V1H1 ( $r_T\approx 1$) excites a response in terms of first vertical mode. Forcing with larger forcing period produces a response with higher vertical mode; in the cases we tested,
 $r_T= 2,3$, the wave response has a second vertical mode. The excitation of the higher vertical modes by larger
 $r_T$ is expected because the propagation speed of vertical mode-
 $n$ waves decreases roughly like
 $n^{-1}$ (Monismith Reference Monismith1987), which increases the period of these waves with
 $n$. We may argue that the limit for resonant excitation of V1H1 is
 $r_T\gtrapprox 1.5$ as determined by Boegman & Ivey (Reference Boegman and Ivey2007) for a two-layer system. The results of Boegman & Ivey (Reference Boegman and Ivey2007) are also valid for the initial response for forcing periods larger than those given by the above condition, where the initial response is in terms of the non-resonant fundamental wave.
Differences arise after a time period when forcing conditions become unfavourable to the fundamental wave, and lead to its cancellation. This process results in transfer of energy from the fundamental mode to high-frequency NLIWs through nonlinear mechanisms. In the  $r_T=2,3$ cases, the first cancellation occurs at about
 ${\approx }1.15T_w$. Upon cancellation, the wave field develops differently depending on the forcing period. Namely, for
 $r_T=2$, this cancellation is permanent; the system adjusts to forcing by energizing the V2H1 wave whose frequency corresponds to that of the forcing. For
 $r_T=3$, the fundamental wave V1H1 re-forms and gets cancelled several times during the oscillatory cycles. Upon the first cancellation, forcing superharmonic
 $f_{w2}$ is energized as nonlinear V2H2, while the energy of
 $f_w$ decreases; therefore, the system adjusts to nonlinear
 $f_{w2}$ and it becomes the dominant response.
Generalizing the results, a lake-like system with a fundamental period shorter than diurnal and having relatively thick metalimnion compared to other layers is susceptible to the formation of higher vertical modes and will respond with higher vertical mode waves unless the fundamental wave is resonantly forced with  $r_T\lessapprox 1.5$. The response can adjust to forcing frequency
 $f_w$ or to its superharmonic. The ability of the system to adjust to the periodicity of the forcing is closely related to the occurrence of NLIWs, and they might be a bridge for internal adjustment.
4. Influence of inclination of the endwalls
Here we investigate how the inclination of the endwalls modifies the response of the basin to the periodic wind forcing discussed in the previous section. The variations of the domain are obtained by varying the angle  $\alpha$, which is the angle between the endwalls and the bottom along
 $L$ (figure 1). Specifically, we vary the angles of the endwalls
 $\alpha =30^\circ,45^\circ,\ldots,90^\circ$, where the latter stands for vertical walls. This bathymetry is representative of alpine glacier-carved lakes whose water basins are typically found in steep valleys.
The endwalls are varied such that the length of the domain at the height of the interface where  $\rho =\rho _0$ (
 $h_2$) is kept constant. Shintani et al. (Reference Shintani, de la Fuente, Niño and Imberger2010) gave a formulation of the effective Wedderburn number that accounts for the sloping bottom geometry. The effective Wedderburn number slowly changes with geometry variations due to physical characteristics such as symmetry over the
 $yz$-plane, constant pycnocline length and relatively steep slopes. We found that, for the different geometrical configurations herein investigated, differences in Wedderburn number are of the order of
 $10^{-3}$, and therefore (1.1) is valid for all the cases.
As in the previous section, turbulent statistics are obtained by averaging the instantaneous field data along the spanwise direction and shown at a given time instant during the last forcing period. Owing to continuous mixing during the simulations, averaging in time was considered not appropriate; thus we discuss separately the cases at constant  $r_T$ and analyse the effect of the inclination of the endwalls.
4.1. Resonant response, $r_T=1$

The time series of interface height in figure 9(a,b) show that, as  $\alpha$ decreases, high-frequency NLIWs (circled) appear before the steepening time scale
 $T_s$, indicating that the mechanism of their formation is not gradual energy transfer from quasi-linear waves to nonlinear ones and their subsequent steepening. As in the previous section, the presence of high-frequency NLIWs in the time series is characterized by high-frequency pulse-like waves superimposed on the main almost sinusoidal low-frequency wave field. Another effect of inclination of the endwall is that the time series are smoother, with less pronounced high-frequency NLIWs for small values of
 $\alpha$. The time series are all very similar apart from
 $\alpha \leq 45^\circ$, for which the amplitude of the oscillation of density interface reduces substantially with time at both probes. This matches the behaviour speculated by Ulloa et al. (Reference Ulloa, Constantinescu, Chang, Horna-Munoz, Hames and Wüest2020) that water bodies with a lower slope angle will escape resonance sooner than those with steep slopes due to enhanced mixing at the sloping boundaries which changes the background stratification. We will further discuss these effects later on.
(a,b) Time series of interface height for  $r_T=1$ and different values of
 $\alpha$ at probes A and B, respectively. (c–e) Vertical profiles of the velocity components and
 $\langle N^2 \rangle$ sampled at probe B for all values of
 $\alpha$. (f,g) Wavelet spectrum for
 $\alpha = 30^\circ$ at probes A and B, respectively. Dashed white horizontal lines denoted with letters indicate:
 $w$, forcing frequency
 $f_w$; f, fundamental frequency
 $f_1$; and
 $s$, approximate frequency of high-frequency NLIWs
 $\approx f_s$. (h,i) Slices through the instantaneous density field together with velocity vectors and interface
 $\rho =\rho _0$ denoted with a white line for the case
 $\alpha = 30^\circ$ at time instants
 $t/T_w = 0.9$ and
 $t/T_w = 1$, respectively. Colour code for (a–e): black,
 $\alpha =90^\circ$; red,
 $\alpha =75^\circ$; green,
 $\alpha =60^\circ$; blue,
 $\alpha =45^\circ$; and brown,
 $\alpha =30^\circ$.

The energy spectra of the time series of interface height are very similar for all inclination angles of the endwalls (not shown). Also, the phase lag between the two chosen isopycnals is generally low, except at frequencies near  $f_1$ in the middle of the channel. This corresponds to periodic spread and contraction of the metalimnion in the middle of the basin, which is the indicator of the formation of higher vertical modes. This effect is more pronounced for the lower inclination of the endwalls.
The wavelet spectrum analysis of the time series for  $\alpha = 30^\circ$ shown in figure 9(f,g) reveals that high-frequency NLIWs form before
 $T_s$, at the end of the first forcing period, which can be observed as an increased amount of energy near the dashed line
 $s$ (figure 9f). We note that, before reaching high-frequency waves, energy is transferred through the lower frequencies. The origin of these waves may be attributed to forcing-induced nonlinear surges, like those observed by Farmer (Reference Farmer1978), that quickly steepen, thus producing high-frequency NLIWs. This is confirmed by inspection of the instantaneous fields: figure 9
 $(h)$ shows the formation of the surge at the interface (denoted with a downward triangle), while figure 9
 $(i)$ shows the degeneration of the surge into the high-frequency NLIWs.
The energy contained in the region of the high-frequency NLIWs is relatively low until the third forcing period, which corresponds to the formation of solitary-like waves by nonlinear steepening (timed by  $T_s$), after which their energy is reduced. This behaviour is significantly different from that of the rectangular case, where, for
 $t>T_s$, a quasi-steady state is reached. The cause of this behaviour will be discussed later in this section.
Vertical profiles of averaged streamwise and vertical velocity components and squared buoyancy frequency are shown in figure 9(c–e). The vertical profiles of buoyancy frequency squared (figure 9e) show that the epilimnion becomes more stratified for steeper slopes. Given that the initial state of the epilimnion is uniform density  $\langle N^2\rangle =0$, this indicates that, as the slope steepens, there is more mixing in the upper layer. Going down, we observe that for steep slopes
 $\alpha =75^\circ,90^\circ$, the maximum of
 $\langle N^2\rangle$ (indicating pycnocline) is shifted downwards. Both these phenomena can be explained by vigorous corner flow at the downwind end that appears for steep slopes (such as that described by Monismith (Reference Monismith1986) and Stevens & Imberger (Reference Stevens and Imberger1996)). This flow cannot penetrate through the metalimnion, but it erodes it with time. At the bottom of the metalimnion, the stratified region, with non-zero
 $\langle N^2\rangle$, spreads downwards with a decrease of
 $\alpha$. Mixing under the metalimnion can be explained in relation to the reduction/decrease of the high-frequency NLIWs from the wave field (as observed in figure 9a,b,f,g), as a consequence of breaking of the NLIWs at the slopes, which is known to cause mixing in the lower layer (e.g. Michallet & Ivey Reference Michallet and Ivey1999). Widening of the metalimnion is known to promote the formation of higher vertical modes.
The vertical velocity profiles (figure 9d) do not exhibit reversals, indicating V1 as the dominant vertical mode for all endwall angles. However, as  $\alpha$ decreases, a substantial reduction of the vertical velocity and additional spatial oscillations occur. The first one is explained by the resonance-escape hypothesis of Ulloa et al. (Reference Ulloa, Constantinescu, Chang, Horna-Munoz, Hames and Wüest2020), whereas the latter indicates the existence of higher vertical modes superimposed over the profile of the dominant V1H1 mode. The additional waves drain energy from the fundamental mode, causing the further reduction of the amplitude of vertical velocity, as observed in figure 9(d).
The vertical profile of streamwise velocity (figure 9c) changes little with the variation of the angle of the endwalls, and the behaviour roughly corresponds to that described for the rectangular domain. We observe that, as  $\alpha$ decreases, the vertical profiles become less sharp, which is related to the appearance of higher vertical modes that create a non-uniform distribution of velocity in each layer.
The spatial oscillations observed in the vertical velocity profiles, together with the progressive irregularities of profiles of horizontal velocity component, for low endwall angles  $\alpha$, indicate the increase of the number of shearing layers.
The quantity  $\langle S^2\rangle =\langle \partial u/\partial z\rangle ^2+\langle \partial v/\partial z\rangle ^2$ is indicative of regions with high shear, where turbulence is more likely to occur if stratification is weak, resulting in low values of Richardson number. The largest values are close to the free surface in all cases, due to the action of the wind stress. The second region with high
 $\langle S^2\rangle$ is found in the lower end of the metalimnion where the velocity reverses (see figure 9c). Lowering of
 $\alpha$ introduces higher shear into the interior, as a direct consequence of the occurrence of the higher vertical modes. Indeed, they produce a number of layers moving with different velocities. In all cases, shear is evident close to the bottom, indicating the presence of a weak boundary layer, and at the inclined walls, for a low value of
 $\alpha$. As already discussed, the bottom boundary layer is very weak and in the laminar regime. This holds also in the presence of inclined walls.
The gradient Richardson number  $Ri=\langle N^2\rangle /\langle S^2\rangle$ shown in figure 10 quantifies the relative importance of the local stabilizing buoyancy forces against the destabilizing effect of shear. In general, in our simulations,
 $Ri$ is very high, which is a consequence of the laboratory configuration. There is a thin near-surface layer where
 $Ri$ is under the critical value
 $Ri_{cr}=0.25$, which corresponds to the surface mixed layer, where
 $\langle N^2\rangle$ is very low and
 $\langle S^2\rangle$ is very high. This is the case also in real-scale basins. The region with subcritical and negative
 $Ri$ can be found near the corner due to the return jet, where the downward jet creates overturns. We observe that the downward reach of this jet increases with
 $\alpha$. In the interior,
 $Ri$ is generally supercritical; exceptions are the intermittent regions with subcritical
 $Ri$ that appear at the lower edge of the metalimnion (where
 $\langle N^2 \rangle$ is very low) for lower
 $\alpha$. For the lowest
 $\alpha$, some wider regions with
 $Ri< Ri_{cr}$ are observed, in particular near the walls, as a consequence of wave breaking, which will be discussed below in the following paragraphs. We acknowledge that, due to laboratory-type set-up, there is a lack of patches with subcritical
 $Ri$ that would produce shear instabilities and turbulence in the interior, compared to real lakes (Saggio & Imberger Reference Saggio and Imberger2001).
Richardson number  $Ri$ for
 $r_T=1$ at
 $\varphi =1.2{\rm \pi}$: (a)
 $\alpha =90^\circ$, (b)
 $\alpha =60^\circ$ and (c)
 $\alpha =30^\circ$. The turquoise colour scale represents subcritical
 $Ri$.

In our numerical experiments, as in real lakes, the flow is strongly dominated by the internal wave field characterized by continuous variations in space and time, which produces high intermittency. In such situations, vertical fluxes (such as  $\langle \rho ' w' \rangle$,
 $\langle u' w' \rangle$, …) appear at a similar rate as down-gradient and counter-gradient (Saggio & Imberger Reference Saggio and Imberger2001), indicating the presence of stirring, or reversible fluid rearrangement (see Linden Reference Linden2018; Villermaux Reference Villermaux2019; Caulfield Reference Caulfield2021). This characteristic of lakes makes it difficult to quantify the irreversible part of vertical density flux
 $\langle \rho ' w' \rangle$ and subsequently the buoyancy flux
 $B = (g/\rho_0)\langle\rho'w'\rangle$, which are needed in order to calculate the diffusivity of density
 $K_\rho = \langle \rho ' w' \rangle / (\partial \langle \rho \rangle / \partial z) = B/N^2$. The vertical fluxes are dominated by the reversible component in all simulated cases. In other words, these quantities are not very robust for quantification of mixing in the case studied herein.
There are several methods that have been developed in the literature to extract information on the turbulent mixing: the widely used Osborn–Cox method (Osborn & Cox Reference Osborn and Cox1972) evaluates the turbulent diffusivity of the scalar, using some assumptions that are difficult to verify in transitional non-equilibrium flows; the available potential energy methods (e.g. Winters et al. Reference Winters, Lombard, Riley and D'Asaro1995; Scotti & White Reference Scotti and White2014) directly relate changes in the available potential energy to irreversible diapycnal mixing; and, finally, there are parametrizations which constitute a simple and efficient way to obtain the desired field.
The laboratory-scale parametrization of  $K_\rho$ for Prandtl number
 $Pr=0.7$ proposed by Shih et al. (Reference Shih, Koseff, Ivey and Ferziger2005) was extended to the range
 $0.7< Pr<700$ by Bouffard & Boegman (Reference Bouffard and Boegman2013). These models are based on the strong correlation between
 $K_\rho$ and the turbulence intensity parameter
 $Re_b=\epsilon /(\nu N^2)$, where
 $\epsilon$ is the dissipation rate of turbulent kinetic energy, namely,
 $K_\rho =C_1\nu Re_b^n$, where
 $C_1$ and
 $n$ are constants characteristic of the mixing regimes initially defined by Shih et al. (Reference Shih, Koseff, Ivey and Ferziger2005) and successively expanded by Bouffard & Boegman (Reference Bouffard and Boegman2013) as the molecular, buoyancy-controlled, transitional and energetic regimes.
We calculated the turbulence intensity parameter (or Reynolds buoyancy number)  $Re_b$ using the dissipation rate
 $\epsilon = - (\nu + \langle \nu _{sgs} \rangle ) \langle ({\partial u''_i}/{\partial x_j})({\partial u''_i}/{\partial x_j})\rangle$, for
 $i,j=1,2,3$ and buoyancy frequency
 $\langle N^2 \rangle$.
Instantaneous resolved buoyancy fluxes in the metalimnion for the phase  $\varphi =0.8{\rm \pi}$ are plotted as a function of the turbulence intensity parameter
 $Re_b=\epsilon /(\nu \langle N^2\rangle )$ in figure 11. Here we take the metalimnion to be the region
 $0.5< z/H<0.9$, which is wider than in the initial set-up, in order to account for metalimnion spread due to mixing (see figure 9e). We show the values of positive and negative buoyancy flux events as
 $B^+$ and
 $B^-$ made non-dimensional with
 $\kappa N^2$. We are not replacing
 $B/(\kappa N^2)$ with the equivalent expression
 $K_\rho /\kappa$ because the first contains events of reversible fluid rearrangement that do not contribute to turbulent mixing. We note that in our simulations the events with
 $Re_b$ values are significantly lower than in the real-scale simulations of Ulloa et al. (Reference Ulloa, Constantinescu, Chang, Horna-Munoz, Steiner, Bouffard and Wüest2019), where typical values of
 $Re_b$ in the metalimnion are
 ${\approx }10^2$ and at the sloped walls from about
 $10^2$ to
 $10^5$. Vertical lines divide different regions as defined by Bouffard & Boegman (Reference Bouffard and Boegman2013). Most of the distribution is found to be in the molecular and buoyancy-controlled regimes. This is due to the laboratory scale employed in our study, which is better suited for the analysis of internal wave dynamics rather than for the analysis of mixing. The values obtained in our simulations are higher than those estimated using the Bouffard & Boegman (Reference Bouffard and Boegman2013) parametrization for
 $Sc=500$, probably due to the reversible buoyancy fluxes associated with internal waves. The effect of the angle
 $\alpha$ is hardly detectable from these plots since the dots are overlapped over the same regions, but histograms (not shown) show the shift of the distribution towards higher values for lower
 $\alpha$.
Non-dimensional buoyancy fluxes  $B/(\kappa \langle N^2\rangle )$ as a function of turbulence intensity parameter
 $Re_b$ for
 $r_T=1$ at
 $\varphi =0.8$. Plots of directly calculated positive
 $B^+$ and negative
 $B^-$ buoyancy flux. Thick purple lines represent the parametrization of Bouffard & Boegman (Reference Bouffard and Boegman2013) for
 $Pr=500$ . Colour code: black,
 $\alpha =90^\circ$; red,
 $\alpha =75^\circ$; green,
 $\alpha =60^\circ$; blue,
 $\alpha =45^\circ$; and brown,
 $\alpha =30^\circ$.

Spatial distributions of the turbulent dissipation rate and turbulent diffusivity of density calculated using the Bouffard & Boegman (Reference Bouffard and Boegman2013) parametrization based on laboratory and numerical data are shown in figure 12. The turbulent dissipation rate  $\epsilon$ (figure 12a–c) is larger near the surface and near the corner where vigorous corner flow is present. With the decrease of
 $\alpha$, we observe that the spatial distribution of dissipation rate changes substantially; regions with significant dissipation rate, which are in the path of the downward beams radiating off-slope, penetrate further into the hypolimnion; for the lowest values of
 $\alpha$, we find high dissipation rate in the regions where the metalimnion encounters the endwalls. For the lowest inclination angle, a large non-dimensional dissipation rate
 $\epsilon /(u_*^4/\nu )$ occurs in the metalimnion near the walls
 ${\sim }10^{-2} - 10^{-3}$, while in the interior it is
 ${\sim }10^{-5} - 10^{-6}$. This difference is close to that observed by MacIntyre et al. (Reference MacIntyre, Flynn, Jellison and Romero1999) for onshore and offshore dissipation rates (two to three orders of magnitude), while it is somewhat higher than that simulated by Ulloa et al. (Reference Ulloa, Constantinescu, Chang, Horna-Munoz, Steiner, Bouffard and Wüest2019) and substantially higher than that observed by Wain & Rehmann (Reference Wain and Rehmann2010).
Fields of (a–c) non-dimensional turbulent dissipation rate  $\epsilon /(u_*^4/\nu )$, (d–f) dissipation rate of turbulent available potential energy
 $\epsilon _\rho /(u_*^2 N_{init})$ and (g–i) turbulent diffusivity of density
 $K_\rho /\kappa$ for
 $r_T=1$ at
 $\varphi =0.4{\rm \pi}$ for (a,d,g)
 $\alpha =90^\circ$, (b,e,h)
 $\alpha =60^\circ$ and (c,f,i)
 $\alpha =30^\circ$. White lines represent isopycnals. Closed yellow lines represent the unstable stratified regions with negative
 $\langle N^2 \rangle$.

We use the method of Scotti & White (Reference Scotti and White2014) in order to calculate the dissipation rate of the available potential energy  $\epsilon _\rho$ as
 \begin{equation} \epsilon_\rho = \kappa \left\langle \frac{\partial\rho''}{\partial x_j}\frac{\partial\rho''}{\partial x_j} \right\rangle \frac{g^2}{2\rho_0^2 \langle N^2\rangle}, \end{equation}
which we show in figure 12(d–f). We note that the spatial distribution of  $\epsilon _\rho$ is similar to that of
 $\epsilon$ with the abrupt drop in the hypolimnion region where
 $\langle N^2 \rangle\approx 0$. We note that, for the steep slopes
 $(\alpha = 60^\circ, 90^\circ )$, regions with high
 $\epsilon _\rho$ are located in the near-wall regions and upper metalimnion, while for the gentle slope
 $(\alpha = 30^\circ )$, high-
 $\epsilon _\rho$ regions are shifted towards the border between the metalimnion and unstratified hypolimnion.
We calculate the spatial distribution of diffusivity of density  $K_\rho$ (figure 12g–i) and mixing efficiency
 $E$ (not shown) following VanDine, Pham & Sarkar (Reference VanDine, Pham and Sarkar2021), where
 $K_\rho = {\epsilon _\rho }/{\langle N^2\rangle }$ and
 $E = {\epsilon _\rho }/{(\epsilon +\epsilon _\rho )}$. We note that, for steep slopes,
 $K_\rho$ is high only near the surface and corner, where mixing is a direct consequence of forcing. As slope angle decreases, we observe some mixing also near the walls, at the edges of the metalimnion. The increase of mixing as the slope moves from steep to moderate, together with lowering of mixing location, corresponds to the behaviour associated with high-frequency NLIWs breaking (Michallet & Ivey Reference Michallet and Ivey1999; Boegman et al. Reference Boegman, Ivey and Imberger2005a) and shear-induced convective mixing (Lorke et al. Reference Lorke, Peeters and Wüest2005). For the lowest angle
 $\alpha = 30^\circ$, we observe an overturn event (region with negative
 $\langle N^2 \rangle$) at the bottom of the metalimnion.
The observed mixing efficiency is generally low throughout the metalimnion  $(O(10^{-3}))$, while at the bottom of the metalimnion, where stratification is weak and shear is high due to the structure of the internal waves,
 $E$ is high locally
 $(O(10^{-2} - 10^{-1}))$ with highest values of almost 0.6.
We also observe downward beam-like activity near the sloped walls, and we investigate the criticality of the slopes. We use the slope criticality parameter (Garrett & Kunze Reference Garrett and Kunze2007; Gayen & Sarkar Reference Gayen and Sarkar2010, Reference Gayen and Sarkar2011) defined as  $\gamma = {\tan \alpha }/{\tan \theta }$, where
 $\tan {\theta } = \sqrt {\omega _w^2/(\langle N^2 \rangle -\omega _w^2)}$ is the slope of the forced internal wave with frequency
 $\omega _w = 2{\rm \pi} f_w$. Slope criticality and observed beams are shown in figure 13. Slopes are near-critical at the bottom edge of the metalimnion (white line) and supercritical above it. In the streamwise velocity, we observe the downward beams that radiate away from the slopes, which is a known behaviour at supercritical slopes (Sarkar & Scotti Reference Sarkar and Scotti2017). These downward beams can induce turbulence and overturns on their path (Aucan et al. Reference Aucan, Merrifield, Luther and Flament2006). This explains the particular spatial distribution of
 $Ri$, where cases with low
 $\alpha$ show regions in the deep interior where the Richardson number is near-critical or subcritical. For
 $\alpha = 30^\circ$, there is a weak downslope flow near the critical region of the slope, which induces weak mixing (
 $K_\rho \approx 20\kappa$) at the endwalls and creates a region with subcritical
 $Ri$.
Non-dimensional streamwise velocity component for  $r_T = 1$ at
 $\varphi = 0$ for (a)
 $\alpha = 60^\circ$, (b)
 $\alpha = 45^\circ$ and (c)
 $\alpha = 30^\circ$. The line shows the slope criticality parameter
 $\gamma = 1$ and the arrows indicate the near-wall end of downward beams.

Near-shore mixing can be generated by seiching currents or breaking of internal waves. We observed in both time series and their wavelet spectrum analysis that high-frequency NLIWs are substantially reduced for low  $\alpha$. In figure 14 we can observe the formation of an unstable layer during the upslope seiching event that corresponds to the shear-induced convective mixing as described by Lorke et al. (Reference Lorke, Peeters and Wüest2005). We can therefore conclude that the increased mixing and dissipation rate near the wall is due to the combination of wave breaking events and shear-induced mixing.
Contours of density field and velocity direction for  $\alpha =30^\circ$ at
 $\varphi = 1.8{\rm \pi}$, showing generation of unstable stratification during the upwelling event.

Time development of the horizontally (along  $x$ and
 $y$ directions) averaged field
 $\langle N^2\rangle _h$ is shown in figure 15. In all cases, deepening of the metalimnion is more rapid during the initial transient, when shear-induced mixing occurs. According to Spigel & Imberger (Reference Spigel and Imberger1980), this mixing is later damped by the internal waves and the deepening slows down. There is a clear tendency of faster metalimnion deepening for basins with lower
 $\alpha$. It should be stressed that this deepening weakly stratifies the hypolimnion (which initially has uniform density) and it becomes susceptible to the occurrence of internal waves. On the other hand, deepening does not cause such dramatic changes in the stratified region, in terms of relocating isopycnals, as seen in figures 9(a,b) and 12.
Time development of the horizontally averaged buoyancy frequency squared  $\langle N^2\rangle _h$ for (a)
 $\alpha =90^\circ$, (b)
 $\alpha =60^\circ$ and (c)
 $\alpha =30^\circ$.

Analysis of the time series, velocity, indicators of stratification and turbulence fields suggests the following scenario. After the initial transient, the mechanism that deepens the metalimnion for lower slope angles is a combination of wave breaking, seiching currents, downward beams and the presence of higher vertical modes. Owing to wave breaking, shear-induced mixing and near-critical or supercritical slopes, fluid under the metalimnion is getting mixed near the boundaries, whereas the higher vertical modes enhance the intrusion that transports this mixed fluid towards the interior (Wain & Rehmann Reference Wain and Rehmann2010).
4.2. Non-resonant response and wave destruction, $r_T=2$

In the interface height time series of figure 16(a,b), we observe similar oscillatory behaviour for cases with different angles of the endwalls. First, the fundamental mode is excited; later on, the forcing frequency dominates the oscillatory cycle. The inclination angle of the endwalls does not affect the response very much. For lower inclination angles, high-frequency waves appear earlier, being less pronounced in the later forcing periods compared to the rectangular case; likewise the case of resonant forcing. A larger quantitative variation of the amplitude of oscillation of the density interface occurs for  $\alpha \geq 45^\circ$. There is a characteristic behaviour of interface height to decrease with time, and this decrease is greater for larger
 $\alpha$. This is due to the already discussed erosion of the upper side of the metalimnion by forcing. We notice that, as in the previous case, high-frequency NLIWs (pulse-like waves) appear earlier in the time series, but are substantially reduced at later times for the low-
 $\alpha$ cases. The explanation for this behaviour is the same as for
 $r_T=1$.
(a,b) Time series of interface height for  $T_w/T_2=2$ sampled at probes A and B, respectively, for all values of
 $\alpha$. (c) Wavelet spectrum for
 $\alpha = 30^\circ$ at probe A. Colour code for (a,b): black,
 $\alpha =90^\circ$; red,
 $\alpha =75^\circ$; green,
 $\alpha =60^\circ$; blue,
 $\alpha =45^\circ$; and brown,
 $\alpha =30^\circ$.

The response in terms of spectral energy of these time series does not exhibit substantial modification from case to case (not shown). For all inclination angles,  $f_w$ and
 $f_{w2}$ are the dominant response frequencies. The phase lag near the forcing frequency increases with a decrease of
 $\alpha$, indicating stronger V2 response for lower inclination angles. The wavelet spectrum for
 $\alpha = 30^\circ$ shown in figure 16c is very similar to that of the rectangular case. The main differences are that high-frequency waves appear earlier (at
 ${\approx }0.5t/T_w$) and that
 $f_w$ and its superharmonics are more energetic.
The inclination of the walls produces only minor modifications of the streamwise velocity profiles. The streamwise velocity maximum in the metalimnion is up to (3–4)  $u_*$ and in the hypolimnion (0.4–0.7)
 $u_*$. Vertical velocity profiles show a variety of profiles with a different number of velocity reversals. Profiles for cases with lower
 $\alpha$ tend to have more vertical velocity reversals that intrude deeper into the interior of the basin. Profiles of buoyancy frequency show similar behaviour as in the
 $r_T=1$ case. In addition, we can observe the tendency of cases with lower
 $\alpha$ to have multiple local maxima, indicating the formation of a multiple-layer structure.
Given that we identified the second vertical mode as the dominant response for forcing  $r_T=2$, we are interested in the analysis of how different responses affect the spatial distribution of internal fields.
The tendency of cases with lower  $\alpha$ to develop multiple shearing layers is present for
 $r_T=2$, similar to the case
 $r_T=1$. Owing to the nature of the V2 response, for
 $r_T=2$, there are two layers with high shear, corresponding to two regions with horizontal velocity reversals. The non-dimensional turbulent dissipation rate
 $\epsilon$ and turbulent diffusivity of density
 $K_\rho$ shown in figure 17 exhibit similar characteristics as in the previous case. Most of the dissipation rate and mixing occurs near the surface, while the decrease of
 $\alpha$ promotes the intrusion of dissipation rate and mixing events, from the near-wall region further into the interior. In figure 17, we can also observe a substantially larger amplitude of the V2 mode for the lowest values of
 $\alpha$, as isopycnals have a much wider opening.
Fields of (a–c) non-dimensional turbulent dissipation rate  $\epsilon /(u_*^4/\nu )$, (d–f) dissipation rate of turbulent available potential energy
 $\epsilon _\rho /(u_*^2 N_{init})$ and (g–i) turbulent diffusivity of density
 $K_\rho /\kappa$ for
 $r_T=2$ at
 $\varphi =0.4{\rm \pi}$ for (a,d,g)
 $\alpha =90^\circ$, (b,e,h)
 $\alpha =60^\circ$ and (c,f,i)
 $\alpha =30^\circ$. White lines represent isopycnals. Closed yellow lines represent the unstable stratified regions with negative
 $\langle N^2 \rangle$.

The turbulent dissipation rate has higher values in the region of the first horizontal velocity reversal compared to the  $r_T=1$ case. Still, most of the dissipation rate is a direct consequence of forcing and is located near the surface and near the corners. For
 $\alpha =60^\circ$ (figure 17b), we observe a higher dissipation rate near the walls, under the metalimnion. For
 $\alpha =30^\circ$ (figure 17c), the dissipation rate increases throughout the metalimnion close to the walls, eventually spreading far into the interior. The spatial distribution of regions with increased
 $\epsilon$ coincides with the spatial distribution of shear squared (not shown), suggesting that this is the consequence of the appearance and distribution of shearing layers due to the higher vertical modes.
The spatial distribution of the dissipation rate of the turbulent available potential energy  $\epsilon _\rho$ is similar to that of the turbulent dissipation rate, with an abrupt drop in the hypolimnion where
 $\langle N^2 \rangle\approx 0$.
The turbulent diffusivity of density  $K_\rho$ shows that, for the rectangular case (figure 17g), mixing predominantly occurs above the metalimnion, near the surface and the walls. In this case, high-frequency NLIWs are clearly visible in the isopycnals as short waves locally present throughout the isopycnals in the water column. As inclination angle decreases, additional mixing appears under the metalimnion, next to the wall by the side where the metalimnion widens (figure 17h). For the lowest angle, mixing is present near walls inside and under the metalimnion at both endwalls. Substantial mixing is present inside the contracted side of the metalimnion. Under the widened side, we observe a region with negative
 $\langle N^2 \rangle$, which indicates overturning events. The reduction of the number and amplitude of high-frequency NLIWs observable in the time series, together with increased mixing near the walls for the non-rectangular cases, indicate the occurrences of NLIWs and breaking events at the sloped walls. Based on the classification of breaking events (Aghsaee et al. Reference Aghsaee, Boegman and Lamb2010; Nakayama et al. Reference Nakayama, Sato, Shimizu and Boegman2019), the vast majority of the wave breaking events are surging breakers. Plunging breakers are possible only for the gentle slopes
 $\alpha \leq 45^\circ$ when the NLIW amplitude is larger than
 $0.1h_1$; such high-amplitude waves occur only at the wave cancellation event.
Similarly to Ulloa et al. (Reference Ulloa, Constantinescu, Chang, Horna-Munoz, Steiner, Bouffard and Wüest2019), we found that the highest  $K_\rho /\kappa$ is present in the epilimnion, where it ranges from
 $O(0.1)$ around the middle of the basin to
 $O(10^4)$ closer to the endwalls. In addition, we found some mixing
 $K_\rho /\kappa = O(10^2)$ at the bottom end of the metalimnion in a region close to the sloped walls, namely, the location where most of the mixing processes in the metalimnion occurs.
The substantial difference in the region where mixing occurs under variation of  $\alpha$ modifies the time evolution of the density field and produces differences in the interface heights, as observed in figure 16. Mixing in the upper layer is dominant for steep slopes, which pushes the metalimnion downwards. For moderate slopes, the effect of upper metalimnion mixing due to forcing is weaker, while mixing under the metalimnion caused by wave breaking and shear-induced mixing increases, which results in smaller variations of the interface height over time.
4.3. Non-resonant response and internal adjustment to resonance, $r_T=3$

As the forcing period becomes larger than the fundamental one, the role of the inclination angle of the endwalls becomes substantially more important. In the interface height time series of figure 18(a), on a non-nodal location A, we can observe that the initial response corresponds to a non-resonant fundamental seiche, as previously described for the rectangular case. The fundamental wave remains dominant until the third forcing period, during which its shape degenerates. Upon degeneration, high-frequency NLIWs become dominant for cases with the steep slopes ( $\alpha > 45^\circ$), while the system starts to adjust to the forcing as dominant wave response adjusts to forcing frequency for moderate slopes (
 $\alpha \leq 45^\circ$). For the lowest
 $\alpha$ we observe that a resonant response develops, characterized by resonant amplification of the wave amplitude. Upon degeneration, steep slopes (
 $\alpha \geq 75^\circ$) behave as described for the rectangular case: high-frequency waves are always present and the main response adjusts to non-resonant, nonlinear, second vertical mode V2H2. Besides this response, multiple fundamental waves form and cancel, thus energizing high-frequency NLIWs. For moderate slopes (
 $\alpha \leq 45^\circ$), the dominant wave response starts to adjust to forcing during the third forcing period and the amount of high-frequency waves decreases. For the lowest angle (
 $\alpha =30^\circ$) case, there is a significant amplification in the wave amplitude, indicating that a resonant response occurs. The interface for the slope angle
 $\alpha =60^\circ$ (green line) shows intermediate behaviour: it develops a V2H2 mode, which is substantially less energetic than that for steeper slopes. At the same time, the frequency of the response adjusts to forcing frequency, but less effectively compared to cases with lower angles.
(a,b) Time series of interface height for forcing  $r_T=3$ and different values of
 $\alpha$ at probes A and B, respectively. (c,d) Non-dimensional spectral energy of interface height (lines) and phase lag among isopycnals (crosses) at probes A and B, respectively. Vertical dotted lines represent non-dimensional forcing frequency and its
 $m$th superharmonics. (e,f) Wavelet spectra of interface height for
 $\alpha = 30^\circ$ sampled at probes A and B, respectively. Dashed white horizontal lines denoted with letters indicate:
 $w$, forcing frequency
 $f_w$; f, fundamental frequency
 $f_1$; and
 $s$, approximate frequency of high-frequency NLIWs
 $\approx f_s$. (g) Vertical profile of the final background density field
 $\rho _B/\rho _0$, where the dashed line represents the initial background density profile.
 $(h)$ Vertical profile of the total change of the background density field
 $\Delta \rho _B/\rho _0$. Colour code: black,
 $\alpha =90^\circ$; red,
 $\alpha =75^\circ$;green,
 $\alpha =60^\circ$; blue,
 $\alpha =45^\circ$; and brown,
 $\alpha =30^\circ$.

There is a significant deepening of the interface  $\rho _0$ over time, and this deepening is directly related to the slope angle
 $\alpha$, as it increases with steepening of the endwalls. This is related to different mixing mechanisms that change the background density over time. In figure 18(g,h), we show the final background density profiles and their variation throughout the simulation, respectively, calculated by sorting the density field. We first permutate the volumes (cells) while respecting the actual shape of the domain and then horizontally average the field. This procedure is equivalent to that of Peltier & Caulfield (Reference Peltier and Caulfield2003), where cells with sorted density are stacked vertically while their volumes are stretched over the domain width, with subsequent averaging of the volumes in order to retrieve the original number of cells in the vertical. In the epilimnion and metalimnion, the change of background density due to mixing is greatest for steep slopes. This is due to vigorous corner flow that erodes the metalimnion. In the bottom end of the metalimnion, mixing increases with the decrease of
 $\alpha$, as processes at the endwalls intensify.
The spectral energy of the interface height time series is shown in figure 18(c,d). On the non-nodal position (figure 18a), there are two dominant spikes, near forcing frequency  $f_w$ and near fundamental frequency
 $f_1$, respectively. The amount of energy near
 $f_w$ decreases with an increase of
 $\alpha$, showing a connection between the inclination of the endwalls and the efficiency of internal adjustment to forcing. The phase lag near the forcing frequency is high, revealing its vertical structure as a higher vertical mode, while near
 $f_1$ there is no phase lag, indicating the presence of V1H1 mode. On the nodal position for odd-mode quasi-linear waves (figure 18d), there are three dominant spikes near superharmonics of forcing
 $f_{w2}$,
 $f_{w4}$ and
 $f_{w6}$, where
 $f_{w6}\approx f_{2}$. High phase lag near
 $f_{w2}$ and
 $f_{w4}$ indicates higher vertical modes, while the lack of phase lag near the
 $f_{w6}$ spike indicates that the V1H2 mode is excited by nonlinear interactions with V1H1. Cases with steep slopes (
 $\alpha > 45^\circ$) have generally more energetic nonlinear modes, which confirms that their adjustment occurs essentially through nonlinearities.
The wavelet analysis of the interface height shown in figure 18(e) for the resonant case ( $\alpha = 30^\circ$) indicates that the fundamental and forcing frequencies were both energized at the beginning of the forcing. After three forcing periods, the energy contained in the fundamental frequency waves decreases, while the energy in waves with forcing frequency dramatically increases, indicating the occurrence of resonance. After the system adjusts and reaches resonance, the fundamental wave is not re-formed as in the case for the steep slopes. At the nodal location (figure 18f), the energy of superharmonics
 $f_{w2}$ and
 $f_{w4}$ increases later compared to the rectangular case. In fact, the occurrence of these waves is related to energizing of
 $f_w$ due to resonance, indicating that they originate by energy transfer. This is significantly different than for the rectangular and steep slopes, where the same frequency wave was excited directly by the forcing.
The vertical profiles of averaged velocity components (not shown) behave as for  $r_t=2$ for large inclination angles, whereas substantial differences are evident for small angles, where we have observed internal adjustment to forcing and resonance. Vertical velocity profiles show the second vertical mode as the most dominant, with fewer additional oscillations compared to the other forcing cases. Profiles of
 $\langle N^2\rangle$ show the same tendencies as in previous cases.
The spatial distribution of  $\langle S^2\rangle$ (not shown) is very similar to that for
 $r_T=2$ for steep slopes, while for the low ones we observe fewer additional shearing layers in the interior, indicating that V2 may be the highest vertical mode that appears.
The non-dimensional dissipation rate  $\epsilon /(u_*^4/\nu )$ is shown in figure 19(a–c). As
 $\alpha$ decreases, the region with high dissipation rates deepens. Unlike
 $r_T=2$, here we observe less spatial variation among cases with different
 $\alpha$. This similarity of the distribution for different inclinations is associated with the occurrence of a single vertical mode V2. For the resonant response (figure 19c), we observe substantially increased dissipation rates inside the contracted part of the metalimnion, where jet-like flow and high shear occur. A similar spatial distribution is observed for the non-dimensional dissipation rate of the turbulent available potential energy.
Fields of (a–c) non-dimensional turbulent dissipation rate  $\epsilon /(u_*^4/\nu )$, (d–f) dissipation rate of turbulent available potential energy
 $\epsilon _\rho /(u_*^2 N_{init})$ and (g–i) turbulent diffusivity of density
 $K_\rho /\kappa$ for
 $r_T=3$ at
 $\varphi =0.4{\rm \pi}$ for (a,d,g)
 $\alpha =90^\circ$, (b,e,h)
 $\alpha =60^\circ$ and (c,f,i)
 $\alpha =30^\circ$. White lines represent isopycnals. Closed yellow lines represent the unstable stratified regions with negative
 $\langle N^2 \rangle$.

The diffusivity of density  $K_\rho$ is shown in figure 19(g,h). We observe the general tendency of having more mixing near the endwalls and increased mixing with a decrease of
 $\alpha$, consistently with previous cases. The return jet that turns downwards near the endwall causes mixing and overturns in the upper layer. For the steep slopes, this jet causes substantial contraction of the metalimnion next to the wall. For the moderate slopes, the jet meets the metalimnion under a milder angle, and it does not directly cause contraction of the metalimnion. Besides the contraction of the metalimnion, for the rectangular case, contours of the density field depict NLIWs with second vertical mode, as described by Ulloa et al. (Reference Ulloa, Constantinescu, Chang, Horna-Munoz, Hames and Wüest2020).
4.4. Summary
In order to quantify globally turbulent quantities in terms of dissipation rate, we determine the spatially (volume-weighted) and temporally (using  $0.1{\rm \pi}$ spaced time windows) averaged dissipation rate
 $\langle \epsilon \rangle _{s,t}$ over the last forcing period, which is representative of the fully developed flow. The non-dimensional dissipation rate
 $\langle \epsilon \rangle _{s,t}$ is plotted in figure 20(a). There is a clear trend of decrease of total dissipation rate as the endwalls steepen. The dissipation rate is lowest for the resonant V1H1 response (
 $r_T=1$), when the transfer of energy from the surface input to waves is the most efficient and more energy goes to additional modes rather than to turbulence. The non-resonant V2H1 response (
 $r_T=2$) has non-dimensional dissipation rate higher than for
 $r_T=1$. The increase comes from the fact that the V2 mode response has two vertical reversals (Münnich et al. Reference Münnich, Wüest and Imboden1992), which increase shear. The relatively constant difference between
 $r_T=1$ and
 $r_T=2$ indicates that the mechanisms that lead to a decrease of dissipation rate for steeper slopes remain the same as the internal wave dynamics change from the first to the second vertical mode. The largest forcing period,
 $r_T=3$, deviates from the other two, which is mostly due to the dependence of the wave response on
 $\alpha$. For the resonant V2H1 response (
 $\alpha = 30^\circ$), we see a substantial increase of the dissipation rate; this can be related to increased dissipation rate in the interior due to the development of a narrow jet. For intermediate angles, the dissipation rate is very close to that for non-resonant V2H1 response (
 $r_T=2$), but it decreases faster as the endwalls steepen.
(a) Space–time averaged non-dimensional dissipation rate  $\langle \epsilon \rangle _{s,t}$ versus inclination angle of the endwalls
 $\alpha$. (b) Non-dimensional change of the background potential energy over the entire simulation
 $t=6T_w$. Colour code: black,
 $r_T=1$; red,
 $r_T=2$; and green,
 $r_T=3$.

In figure 20(b) we show the rate of change of the background potential energy over the duration of the simulations made non-dimensional with  $\rho _0 u^4_*/\nu$. In order to find the minimum background potential energy
 $P_B$, we calculate the background density
 $\rho _B(z)$ by sorting the density field according to Peltier & Caulfield (Reference Peltier and Caulfield2003) and average it horizontally. The rate of change of the background potential energy is due to two processes: the first one (
 $D$) is equivalent to molecular diffusion in a static fluid, while the second (
 $M$) is irreversible mixing enhanced by turbulent processes:
 \begin{equation} \frac{\mbox{d}P_B}{\mbox{d}t} = \frac{\langle g (\rho_{B,final} -\rho_{B,init}) z\rangle_{z}}{6T_w} = M + D. \end{equation}
For cases  $r_T = 1,2$ where the same wave response is dominant over the variation of
 $\alpha$, we observe that the highest amount of mixing is in cases with gentle slopes, which can be associated with turbulent activity at the sloped walls. For steep slopes, we observe a trend in the weak increase of mixing as slopes steepen, which can be associated with upper layer mixing due to the downward jet that causes vigorous corner flow. The scenario is different for
 $r_T = 3$. In this case, we observe that most mixing occurs for the steep slopes, characterized by nonlinear V2 response. Mixing decreases as this response gets weaker for the cases with lower
 $\alpha$ and increases again for
 $\alpha = 30^\circ$ when resonant V2 response occurs.
We observe that here the lowest amount of mixing occurs for the quasi-linear non-resonant V2 response  $r_T = 2$, while the longest forcing period
 $r_T = 3$ exhibits the highest amount of mixing for both resonant quasi-linear V2 response and nonlinear V2 response.
We can conclude that resonant responses introduce more mixing in the system, with V2 response being more effective on mixing than V1. This is because of the multilayer structure of the flows characterized by higher shear. We find that a large amount of mixing is related to nonlinear V2 response. We also highlight that the nonlinear V2 response is the dominant wave response and its period is different than the forcing one.
Overall, we can depict the following scenario, upon definition of the state of the periodically forced system as stable or unstable. If the system responds with a wave that absorbs most of the energy input, and this state persists for several forcing periods, the system is in a stable state. On the other hand, if energy input by forcing feeds two or more highly energetic waves that are in competition, and the state of the wave field changes from one forcing period to another, the system is in an unstable state. When the periodically forced system is close to a stable state, variations of the inclination from gentle to steep slopes do not play an important role in driving the kind of response. Namely, the system soon adjusts to the closest stable state and there it remains. In these cases (namely  $r_T=1,2$), the general response remains the same, while the amount of high-frequency NLIWs and near-boundary mixing vary with the variation of inclination. As time goes on, boundary mixing can have different effects on the wave field: among others, the deepening of the metalimnion, which is characteristic for basins with gentle angles. For
 $r_T=1$, this leads to escape from V1H1 resonance; while for
 $r_T=2$, it leads to increase of the amplitude of the V2H1 mode.
When a periodically forced system is far from a stable state, the variation of inclination plays a crucial role in the basin response. For  $r_T=3$ we saw how the transition from gentle to steep slopes moves the response from quasi-linear to nonlinear waves. We note that the nonlinear response that we obtain is unstable, as quasi-linear waves (in terms of fundamental V1H1) continue to form throughout the duration of numerical experiments. If periodic forcing ceases, these waves would remain present for a while, as there is no wave cancellation.
5. Concluding remarks
In the present paper, we investigated the response of a periodically forced stratified basin in terms of excitation of internal modes and mixing. We discuss energy transfer in the wave field starting from the initial phase of excitation and, specifically, the transfer of energy from the quasi-linear basin-scale waves to the nonlinear waves and their feedback on the dominant wave response of the basin. The analysis was carried out numerically, using LES, at a laboratory scale. The model was validated against two different laboratory experiments (see Appendix A). We set a three-layer stratification, typical of real-scale basins, and studied the system under variation of the forcing frequency (the frequency of the forcing wind stress) and variation of the inclination of the endwalls of the basin. We obtained different basin responses, classified in table 3 according to wave modes and the occurrence of resonance.
Dominant response with respect to  $r_T$ and
 $\alpha$.

Resonant V1H1 response. For a forcing period near the fundamental period, resonant V1H1 response occurs for all the endwall inclinations analysed. The resonant wave gradually energizes higher horizontal modes. There are slight differences among cases, related to the variation of the angle of the endwalls  $\alpha$. Generally, we found that decreasing the angles of the side leads to increased mixing near the sloped walls. This causes a more rapid transition from resonance and changes in the level of stratification in favour of excitation of higher vertical modes superimposed over the main wave response.
Non-resonant V2H1 response. For a forcing period with  $r_T = 2$, a particular situation develops. At the beginning, the fundamental response switches on, and after one forcing period, this response is out of phase with the forcing, causing cancellation of this wave. During that event, energy gets transferred from the fundamental mode into a nonlinear surge, which quickly steepens and energizes the high-frequency NLIWs. After the destruction of the fundamental V1H1 response, a non-resonant V2H1 response with forcing frequency develops. As the inclination angle decreases and the metalimnion widens, V2H1 becomes more energetic, but a resonant response does not occur.
Non-resonant nonlinear V2H2 response. The system responds to  $r_T=3$ forcing with a superposition of a fundamental wave response and waves with forcing frequency. For steep slopes, cancellation of the fundamental wave occurs several times. Each time, this wave forms again, as the system fails to adjust to the forcing. Instead, upon the first cancellation event, nonlinear wave V2H2 develops with twice the forcing frequency and remains the most energetic non-interrupted wave throughout the simulation. The nonlinear V2 wave response is specific for its own ability to produce V2 high-frequency NLIWs, as recently investigated and described by Ulloa et al. (Reference Ulloa, Constantinescu, Chang, Horna-Munoz, Hames and Wüest2020). Nevertheless, the system is not stable in this state, as a quasi-linear fundamental wave, with an amount of energy similar to that of the V2H2 wave, is continually formed and cancelled, unlike the situation observed with V2H1, where this wave does not reoccur once the system response adjusts to the forcing frequency.
The inclination of the endwalls also plays an important role. With the decrease of the angle of the endwalls, the spatial distribution of mixing and dissipation rate changes dramatically. As  $\alpha$ decreases, more mixing occurs at the intersection of the metalimnion and boundaries. This corresponds to the well-known behaviour of seiche interaction with the boundaries (Lorke et al. Reference Lorke, Peeters and Wüest2005) and wave breaking at the slopes (Michallet & Ivey Reference Michallet and Ivey1999). The mixed fluid is subsequently transported towards the interior, which leads to the thickening of the metalimnion (Wain & Rehmann Reference Wain and Rehmann2010). The thicker metalimnion enables the formation of the higher vertical modes, which enhances the transport of fluid away from the wall (Wain et al. Reference Wain, Kohn, Scanlon and Rehmann2013) and creates shearing layers in the interior that can produce shear instabilities in the regions where stratification is weak.
As the inclination angle decreases, the system gains the ability to adjust to the forcing. For  $\alpha =60^\circ$ the main response is still characterized by nonlinear V2H2, but V2H1 with the forcing frequency appears more energetic than for steeper slopes, yet its energy decreases with time. For even lower inclination angle
 $\alpha =45^\circ$, the system non-resonantly adjusts to the forcing frequency via V2H1, while the fundamental V1H1 is still present. For the lowest tested angle
 $\alpha =30^\circ$, the system develops a resonant V2H1 response and the fundamental wave is not re-energized. We conclude that, for a forcing period that is long enough compared to the fundamental one,
 $r_T=3$ in this case, the fundamental wave will occur as a response even when the system adjusts to forcing via higher vertical modes, except in the case of resonant adjustment.
We recognize that there are some differences between our laboratory set-up and the situation in lakes. Namely, due to the low Reynolds number and high Richardson number that are commonly used at laboratory scales, our work is likely to underestimate mixing in the interior and near the bottom boundary layer compared to the higher-Reynolds-number and lower-Richardson-number situations found in lakes. We also note that the Schmidt number used herein corresponds to the usage of salt as a stratifying agent, while in most stratified lakes stratification is caused by temperature differences. We acknowledge that the ratio of vertical to horizontal dimension is exaggerated compared to the lake dimensions and that the uniform density used in the hypolimnion and epilimnion is an approximation of a weak stratification commonly found in nature. Nevertheless, we may argue that the mechanisms that we have observed, such as internal adjustment, wave destruction, the influence of higher vertical mode on the spatial distribution of the turbulent fields, and the dependence of the obtained response on the domain shape, may be helpful for the analysis of field and laboratory data. We hope to motivate more laboratory and numerical research on the internal adjustment to forcing.
Acknowledgements
We acknowledge the CINECA award under the ISCRA initiative for the availability of high-performance computing resources and support. The simulations were carried out under the IsC69_TICB project.
Declaration of interest
The authors report no conflict of interest.
Appendix A. Validation – reproduction of experiments
In order to test the ability of our numerical model to properly predict the behaviour of a stratified basin forced by surface shear stress, we reproduce two significant laboratory experiments, one by Monismith (Reference Monismith1986) and the other by Boegman et al. (Reference Boegman, Ivey and Imberger2005b). We use the former to test the ability of the model to reproduce the response to the surface shear stress, whereas the latter is used to test the performance of the model to reproduce the internal wave field. In the tests, we use no-slip conditions at the solid walls of the tank, to mimic experimental conditions. The sizes of the domains correspond to the tank size used in each experiment.
A.1. Response to surface shear stress
Monismith (Reference Monismith1986) performed experiments by applying a moving belt at the bottom of a rectangular tank filled with stratified water. In the experiments, the author used salt concentration as a stratifying agent, and density has a roughly linear distribution over a finite thickness  $\Delta h$.
The experimental set-up herein reproduced is summarized in table 4. Here, we discuss the simulation relative to experiment 8 of Monismith (Reference Monismith1986). As a boundary condition for the moving belt, we use constant kinematic stress  $\tau =u_*^2$. Numerical simulations were set up using
 $(n_x\times n_y\times n_z)=(525\times 30\times 60)$ grid points and
 $(\Delta x^+, \Delta y^+, \Delta z^+) = (59.6,89.4,30)$.
Set-up of experiment 8 of Monismith (Reference Monismith1986) for two-layer stratification. Here  $h_2$ is the thickness of the lower (near-belt) layer,
 $U_B$ is the belt velocity,
 $T_0$ is the duration of the belt running and
 $T_1$ is the period of the fundamental internal seiche mode.

To suppress the vigorous flow that appears at the intersection of the running belt and the endwall of the tank, a sponge was installed next to the endwall in the experimental set-up (for details see the original paper by Monismith (Reference Monismith1986)). We modelled the diffusive effect of the sponge as a diffusive layer, which is set according to Farrow & Stevens (Reference Farrow and Stevens2003) by adding a linear drag term  $\lambda \boldsymbol {u}$ to the momentum equation, where
 $\lambda \neq 0$ only near the downwind wall. The magnitude of
 $\lambda$ is increased linearly from zero at the beginning of the end flow region
 $x=x_\lambda$ to
 $\lambda _{max}=2.9\ \textrm {s}^{-1}$ at the endwall
 $x=L$. The kinematic stress is constant, except in the diffuse layer, where it linearly goes from
 $u_*^2$ to 0 at the endwalls.
The numerical simulation reproduced well the characteristics of the flow, specifically the initial barotropic flow as well as the development of the jet-like flow at the interface for  $t>0.25T_1$. Differently from the physical diffuser used in the experiment, the numerical one causes the attenuation of the jet-like flow that forms at the interface. In the experiments, this flow was observed to plunge and to be incorporated into the mixed layer within 20–30 cm from the wall (see Monismith (Reference Monismith1986) for details); in the numerical simulation, this flow plunges faster and the jet-like behaviour disappears after only a few centimetres. The main effect of concentrated return flow was to sharpen the interface at the downwind end and to diffuse it at the upwind end (Monismith Reference Monismith1986); these effects are weaker in our simulation. Figure 21(a–h) shows good agreement among contours of the density field, with the difference in sharpening and diffusing near the endwalls that can be directly related to the attenuation of the return jet-like flow.
(a–h) The distribution of isopycnals at times (a,e)  $0.32T_1$, (b,f)
 $0.64T_1$, (c,g)
 $0.96T_1$ and (d,h)
 $8T_1$. Superposition of initial (solid) and final (dashed) density profiles is shown in (i,k) and net density difference due to mixing in (j,l). Panels (a–d) and (i,j) are from Monismith (Reference Monismith1986) and (e–h) and (k,l) are from our simulation. The density is expressed in units
 $\sigma _t = \rho - 1000\ \mbox {kg m}^{-3}$. Quantities are dimensional for comparison purposes.

The net effect of applied stress consists of a net change of the density profile that is indicative of time-averaged vertical buoyancy flux. In figure 21(i,k) we can see that the numerical profiles of vertical density are very similar to the experimental ones. The main difference can be observed in figure 21(j,l) as somewhat less net change in density at the interface and more in the bottom layer, which can be a consequence of attenuation of a jet-like flow.
We can conclude that our model reproduces reasonably well the initial seiche response to the wind action, in terms of both inclined isopycnals and the amount of mixing (indirectly estimated through the density profile). The differences may be mainly attributed to the intrinsic differences always present between a laboratory experiment and a numerical one: among other things, the already discussed corner flow issue, the small difference in the initial profile (nearly discontinuous transition versus smooth transition), differences in impulsively started motion in the experiments and numerical simulation, or the fact that the belt used in the experiment might have generated vibrations, which can alter the shear stress and produce vertical velocity fluctuations hardly reproducible in a numerical experiment.
A.2. Internal waves
Boegman et al. (Reference Boegman, Ivey and Imberger2005b) conducted experiments in a rectangular tank filled with a two-layer stratified fluid, characterized by the presence of a thin interface layer with a thickness of about 1–2 cm (for details see the original paper). Internal waves were initiated by tilting the tank with respect to the horizontal plane (to create an inclined pycnocline somewhat mimicking the wind-induced set-up) and subsequent rapid release to the horizontal position (which may be interpreted as relaxation of the wind conditions). They performed different experiments in a rectangular tank with dimensions  $(6\ \mbox {m} \times 0.3\ \mbox {m} \times 0.29\ \mbox {m})$, and we consider run 5 of Boegman et al. (Reference Boegman, Ivey and Imberger2005b) as reference for our simulation, summarized in table 5. The computational grid is composed of
 $(n_x\times n_y\times n_z)=(600\times 20\times 58)$ grid points.
Settings of run 5 of Reference Boegman, Ivey and ImbergerBoegman et al.'s (Reference Boegman, Ivey and Imberger2005b) experiment used herein as reference. Here  $\theta$ is the initial tilt angle and
 $h_1/H$ is upper layer to total height ratio.

Our simulation differs from the experiment in that we start from an initial ideal condition, which is a hydrostatic field in a horizontal tank with the interface inclined using the value of  $W^{-1}$ as in the experiment. As density profile, we use a two-layer distribution with a finite thickness of the interface resembling that of run 5 of Boegman et al. (Reference Boegman, Ivey and Imberger2005b), with density decreasing linearly with height. The density field was sampled along vertical lines matching the wave gauges B and C used in the experiments; therefore, we refer to the sampling positions likewise. Line B is placed near the middle of the channel, a nodal position for linear basin-scale internal waves, so that the wave signal comes from nonlinear internal waves. Spot C is placed approximately at three-quarters of the length of the channel, where the basin-scale linear-wave (H1 internal seiche) signal dominates.
The interface displacement time records obtained in the experiment and in the numerical simulation (not shown) are similar to each other, in spite of the intrinsic differences between the two set-ups. The comparisons between the two records are quite good, showing the presence of a fundamental mode and a decrease of the amplitude with time due to viscous effects. At wave gauge B, where the presence of nonlinear waves can be detected, the analytical solution for interface displacement gives zero amplitude. The comparison between our numerical results and experimental ones appears satisfactory. As expected, nonlinear wave amplitudes in both simulation and experiment increase as  $t\rightarrow T_s$ and decrease afterward.
To quantify better the information contained in the time signals, we perform the spectral analysis (discrete Fourier transformation) of the interface displacement time series and compare the results with those of the experiments and of the analytical solution. Figure 22(a,b) shows the time spectra of the signals at wave gauge C. The most energetic resonant mode of internal seiche H1 corresponds to the analytical solution and has a similar shape as in the experiments.
Spectra of interface displacement: (a,b) sampled at the wave gauge C; and (c,d) sampled at the wave gauge B. Panels (a,c) are from the experiments of Boegman et al. (Reference Boegman, Ivey and Imberger2005b) (lowest line marked with arrow represents run 5), while panels (b,d) are from numerical simulation. The dashes denote the frequencies of the first eight modes.

Higher modes are reproduced by our simulation, with a small shift in the frequency with respect to both experiments and analytical solutions. Although differences are expected between our simulation results and the analytical solution, differences with the experimental data are less intuitive. They may arise from the different set-ups (specifically initial condition) or they may even be attributed to some amount of artificial dissipation in the numerical model, although regridding tests (not shown) have proved that a numerically convergent solution has been obtained. We also note that frequency shifts in the spectra are sensitive to the changes of the length of the time series; therefore, they may be related to wave degeneration with time. For the spectra herein shown, we have chosen to use the same length series as that used in the original paper, that is, 800 s. The high-frequency modes are well present in our signal, showing the capability of the numerical model to reproduce the higher-frequency energy content.
Figure 22(c,d) shows the spectral analysis at the wave gauge B, where nonlinear effects are dominant. We point out that the initial conditions directly excite the linear (odd) modes only; the steepening of the linear modes due to nonlinear effects excites nonlinear (even) modes. Our simulation reproduced well these nonlinear effects and the consequent even modes. With respect to experimental results, we obtain similar energy distribution among even modes, with the same shift in frequencies as previously observed.
Although there is a small shift in frequencies of higher modes between theory, experiment and numerical simulation, our model seems to reproduce well both the linear and nonlinear aspects of the wave field. Differences may likely arise from the different laboratory set-up with respect to the numerical one. In particular, rapid rotation of the tank introduces Coriolis, Euler and centrifugal forces, not present in our experiments. We can conclude that our numerical model reproduces the internal wave field in a satisfactory way.
To summarize, comparison with data from laboratory experiments shows that our numerical model appears suited for the laboratory-scale analysis of a stratified basin forced by wind stress.
Appendix B. Validation tests
For each simulation set we test different grids to verify the accuracy of the results. In figure 23 we show horizontally averaged quantities obtained with four different grids for the case of oscillating surface shear stress ( $r_T = 1$) with sloped walls
 $\alpha = 30^\circ$ at the time
 $1.5T_w$.
Vertical profiles of horizontally averaged and non-dimensionalized streamwise velocity component and density obtained using different grids. Colour code: black, basic grid; blue, 50 % finer grid.

We express the grid resolution in wall units as  $\Delta x_i^+ = \Delta x_i u_*/\nu$. Table 6 reports the grid used in our tests with resolution expressed in wall units. The basic grid is that used in our simulations
 $(n_x\times n_x\times n_z) = (300 \times 25 \times 80)$; we test the sensitivity of the results to grid resolution by refining the grid 50 % in the
 $x$ and
 $z$ directions
 $(n_x\times n_x\times n_z) = (450 \times 25 \times 120)$.
Main parameters of the numerical experiment.

Based on the comparison of the vertical profiles, we conclude that we have reached grid convergence, apart from minor changes that do not contribute to the physics we are studying and that, on the other hand, would increase the computational cost also in view of the large number of simulations carried out in the paper.



