





Food security (FS) is a fundamental determinant of human health and well-being, particularly among vulnerable populations such as children under 5 years of age(Reference Simonovich, Pineros-Leano and Ali1). According to the Food and Agriculture Organization (FAO), FA exists ‘when all people, at all times, have physical, social and economic access to sufficient, safe and nutritious food to meet their dietary needs and food preferences for an active and healthy life’(Reference Stanberry and Fletcher-Paul2). This concept encompasses four interrelated dimensions – availability, access, utilisation and stability – whose disruption has direct and lasting consequences on child health and development.
The impact of food insecurity (FI) on the health of children under 5 is multidimensional and encompasses nutritional, cognitive and developmental consequences. Children in households with severe FI have a 60 % lower likelihood of achieving the minimum dietary diversity and are 2·48 times more likely not to consume fruits or vegetables(Reference de Castro Mello, Schincaglia and Oliveira3,Reference Gallegos4) . During the first 1000 d of life, it is associated with intrauterine growth restriction, low birth weight, cognitive delays and a higher risk of non-communicable diseases in adulthood, a phenomenon known as ‘perinatal programming’(Reference de Castro Mello, Schincaglia and Oliveira3,Reference Gallegos4) . Globally, the prevalence of FI has increased over the past decade, driven by economic crises, conflicts, climate change and, more recently, the COVID-19 pandemic(Reference Paudel, Neupane and Sigdel5). In 2024, an estimated 2·3 billion people in the world experienced moderate or severe FI, disproportionately affecting children, women and rural communities(6). Ecuador reflects this regional pattern, in which structural socio-economic inequalities, dependence on imported foods and food price volatility exacerbate household vulnerability(Reference Weigel, Armijos and Racines7).
FI during childhood is associated with a wide range of adverse health outcomes. Biologically, inadequate dietary intake is closely linked to undernutrition, including stunting, wasting and micronutrient deficiencies(Reference Moradi, Mirzababaei and Mohammadi8). In Ecuador, stunting has historically exceeded 20 % among children under five, although recent data suggest a gradual decline(Reference Hajri, Angamarca-Armijos and Caceres9). More recent national estimates from the National Survey on Child Malnutrition (ENDI) 2023–2024 reported a prevalence of 17·5 %(10). Anaemia, largely attributable to Fe deficiency, remains highly prevalent among children under five in Latin America, with prevalence estimates approaching 40 % in some countries(11). Similarly, the ENDI 2023–2024 survey reported an anaemia prevalence of 36·9 % among Ecuadorian children aged 6–23 months(10). Beyond physical health, early-life FI has been associated with impaired neurodevelopment, poorer educational outcomes and long-term socio-economic disadvantage(Reference Gallegos, Eivers and Sondergeld12). These findings support the social determinants of health framework, suggesting that FI results from the interaction of economic, territorial, ethnic and demographic vulnerabilities rather than from income deprivation alone.
Accurate measurement of FI is essential for understanding its magnitude and implications. While traditional indicators such as anthropometry and dietary intake surveys provide valuable information on nutritional status, they do not capture the lived experiences of food access constraints and hunger. Experience-based measures, such as the Food Insecurity Experiences Scale (FIES), address this gap by assessing perceived food access and the severity of food-related hardship.
Evidence consistently shows a strong association between household FI and adverse nutritional outcomes in children, including higher risks of anaemia and stunting(Reference Moosavian, Ghodsi and Farzanehnejad13–Reference Patriota, Abrantes and Figueiredo15). These relationships are mediated by broader social determinants, including poverty, maternal education, employment and geographic context. In Ecuador, where poverty disproportionately affects rural and indigenous populations, these pathways are particularly pronounced(Reference Andrade and Gil16).
The COVID-19 pandemic further intensified FI in Ecuador through income loss, labour market disruptions and rising food prices, disproportionately affecting households with young children(Reference Gavilanes Llango, Llerena Morales and Lucero Álvarez17,Reference Lee, Cevallos and Andrade18) . Although some indicators have shown modest improvements since 2021, persistent structural inequalities continue to place a substantial proportion of children at risk(Reference Gavilanes Llango, Llerena Morales and Lucero Álvarez17).
Against this background, this study aimed to estimate the national prevalence and distribution of FI among households with children under 5 years of age in Ecuador, using two national cross-sectional population surveys conducted in 2022–2023(19) and 2023–2024(10), respectively, known as the National Survey on Child Malnutrition (ENDI) and to evaluate the psychometric properties (validity and reliability) of the FIES through Rasch analysis. We compared FI prevalence and FIES item responses between survey rounds and described disparities across key socio-demographic and child health characteristics. In addition, using data from the 2023–2024 round, we examined factors associated with FI and its severity using multivariable regression models. These results provide nationally representative evidence to inform integrated policies that address FS and early childhood well-being in contexts marked by persistent territorial and social inequalities and to inform policies aimed at advancing Sustainable Development Goal 2: Zero Hunger(20).
Method
Study design and participants
This cross-sectional study utilised secondary data from two consecutive rounds of the National Survey on Child Malnutrition (ENDI), conducted in 2022–2023(19) and 2023–2024(10). Implemented by the National Institute of Statistics and Census (INEC), the ENDI is a nationally representative, probabilistic, repeated cross-sectional survey designed to monitor child stunting and evaluate national public policies. The survey exclusively targets households with at least one child under 5 years of age across all twenty-four provinces of Ecuador.
The ENDI employs a stratified, multistage sampling design that ensures statistical representativeness at the national, regional and provincial levels, as well as for urban and rural areas. In the first stage, primary sampling units (PSU) were selected with probability proportional to size (PPS); in the second stage, eight households were randomly selected within each PSU. To ensure longitudinal comparability while maintaining cross-sectional precision, the sampling framework implemented a partial sample rotation at the PSU level. Specifically, approximately two-thirds of the PSUs from the 2022–2023 round were retained, while one-third were newly selected for the 2023–2024 round(21,22) . Within each PSU, a new household listing and random selection were performed. Consequently, while the rounds share a common sampling framework and standardised field protocols, comparisons represent population-level estimates rather than a longitudinal follow-up of the same households.
The final sample comprised 19 187 households (22 260 children under five) in the 2022–2023(19) round and 20 186 households (23 187 children under five) in the 2023–2024(10) round. Sample sizes were calculated based on a relative error of 0·15, a 95 % confidence level (z = 1·96) and an expected non-response rate of 20 %(21). Data collection was conducted using electronic devices, following standardised anthropometric and biochemical protocols across both periods.
Household questionnaires were used to collect socio-demographic, socio-economic, health and FS information. Anthropometric indicators (stunting, wasting and underweight) were derived by INEC following the WHO Child Growth Standards (2006). Weight and length/height were each measured twice; a third measurement was taken when the difference between the first two readings exceeded 0·5 kg (weight) or 0·5 cm (length/height) and the final value corresponded to the mean of the two closest measurements. Recumbent length was used for children younger than 24 months and standing height for children aged 24 months and older. Age- and sex-standardised z-scores were computed for length/height-for-age, weight-for-length/height and weight-for-age. Stunting was defined as length/height-for-age < –2 sd (plausible range –6·0 to +6·0 sd), wasting as weight-for-length/height < –2 sd (plausible range –5·0 to +5·0 sd) and underweight as weight-for-age < –2 sd (plausible range –6·0 to +5·0 sd); children with z-scores outside these plausible ranges were excluded(23,24) .
Hb concentration was measured from capillary blood samples using portable HemoCue® hemoglobinometers following standardised protocols, in children aged 6–59 months. Measured Hb values were adjusted for altitude of residence using standard correction factors. Anaemia was classified according to the national guidelines(25) as: severe anaemia (Hb < 7·0 g/dL), moderate anaemia (Hb 7·0–9·9 g/dL), mild anaemia (Hb 10·0–10·9 g/dL) and no anaemia (Hb ≥ 11·0 g/dL)(22).
Household income was categorised into quintiles using the classification available in the official ENDI database, with Quintile 1 = lowest household income; Quintile 5 = highest household income(22). The variable of prioritised areas corresponds to the territorial classification defined by the National Strategy Ecuador Grows Without Child Malnutrition (ENECSDI). This classification is based on a multidimensional index constructed for each parish, composed of three components: demand due to vulnerability (weight 0·35), demand due to concentration of the target population (weight 0·40) and supply of services from the prioritised package (weight 0·25). The cantonal categorisation, obtained through cut-off points by percentiles (P80, P60, P40), was used as input for the parish classification, which combines the percentile of each parish’s index with the level of priority of its canton. For this study, areas were classified as prioritised or not prioritised(26). Poverty was assessed using the unmet basic needs index (NBI), which classifies a household as poor if it presents at least one deficit among five dimensions: housing materials, water/sanitation access, economic dependency, school-age children’s attendance and overcrowding (>3 persons/bedroom)(27). This study followed the STROBE-nut reporting guidelines(Reference Lachat, Hawwash and Ocké28).
Data availability statement
Complete documentation for both survey rounds, including microdata files, the sampling design manual, data collection protocols, quality control manuals, the interviewer’s manual, preliminary results reports and indicator-specific methodological fact sheets, is publicly available at https://www.ecuadorencifras.gob.ec/encuesta_nacional_desnutricion_infantil/
Measurement of food insecurity
Household FI was measured using the Food Insecurity Experience Scale (FIES), an eight-item experience-based scale with dichotomous (yes/no) responses developed by the FAO. The FIES captures self-reported experiences related to anxiety about food access, compromised food quality and reduced food quantity, enabling international comparability beyond measures of caloric adequacy(29). This methodology has been widely validated and incorporated into national surveys across diverse contexts, including Ecuador(Reference Onori, Viviani, Brutti, Brentari, Chiodi and Wit30,Reference Moreno, Serrano, Serrano, Villacreses and Viteri31) .
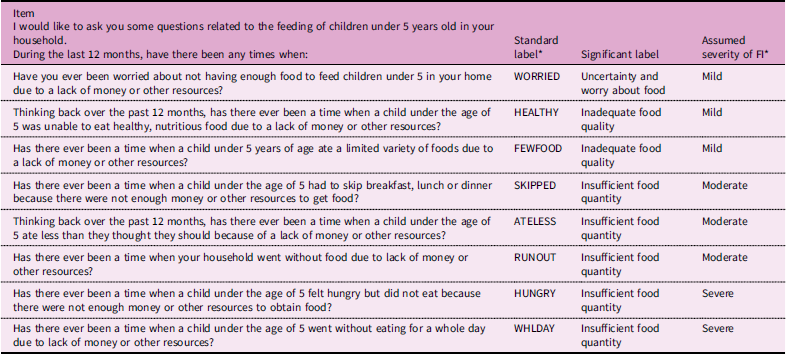
The FIES questions were included in the household questionnaire following housing-related questions. Prior to administration, the interview provided standardised instructions clarifying that references to ‘lack of money or other resources’ referred exclusively to economic constraints and excluded reasons related to weight-loss diets, health conditions or religious practices. The reference period for the FIES was the 12 months preceding the interview, and questions related to the feeding of children under 5 years of age were administered in accordance with FAO FIES guidelines, including the ‘don’t know’ response option (Table 1).
Items of the food insecurity experience scale

Table 1. Long description
A table with 8 rows and 4 columns detailing questions related to the feeding of children under 5 years old in a household. The columns are labeled ‘Item’, ‘Standard label’, ‘Significant label’, and ‘Assumed severity of FI’. Row 1: Item, I would like to ask you some questions related to the feeding of children under 5 years old in your household. During the last 12 months, have there been any times when:, Standard label, WORRIED, Significant label, Uncertainty and worry about food, Assumed severity of FI, Mild. Row 2: Item, Have you ever been worried about not having enough food to feed children under 5 in your home due to a lack of money or other resources?, Standard label, HEALTHY, Significant label, Inadequate food quality, Assumed severity of FI, Mild. Row 3: Item, Thinking back over the past 12 months has there ever been a time when a child under the age of 5 was unable to eat healthy, nutritious food due to a lack of money or other resources?, Standard label, FEWFOOD, Significant label, Inadequate food quality, Assumed severity of FI, Mild. Row 4: Item, Has there ever been a time when a child under 5 years of age ate a limited variety of foods due to a lack of money or other resources?, Standard label, SKIPPED, Significant label, Insufficient food quantity, Assumed severity of FI, Moderate. Row 5: Item, Has there ever been a time when a child under the age of 5 had to skip breakfast, lunch or dinner because there were not enough money or other resources to get food?, Standard label, ATELESS, Significant label, Insufficient food quantity, Assumed severity of FI, Moderate. Row 6: Item, Thinking back over the past 12 months, was there ever a time when a child under the age of 5 ate less than they thought they should because of a lack of money or other resources?, Standard label, RUNOUT, Significant label, Insufficient food quantity, Assumed severity of FI, Moderate. Row 7: Item, Has there ever been a time when a child under the age of 5 felt hungry but did not eat because there were not enough money or other resources to obtain food?, Standard label, HUNGRY, Significant label, Insufficient food quantity, Assumed severity of FI, Severe. Row 8: Item, Has there ever been a time when a child under the age of 5 went without eating for a whole day due to lack of money or other resources?, Standard label, WHLDDAY, Significant label, Insufficient food quantity, Assumed severity of FI, Severe.
* Standard label: abbreviation used by FAO for each FIES item. Assumed severity of FI: theoretical severity level assigned to each item under the FIES global standard.
Validation of the Rasch model
To evaluate the psychometric properties of the FIES, the Rasch model (one-parameter logistic model) was applied to assess the validity and reliability of the scale by estimating item severity and household parameters. The following core psychometric assumptions of item response theory were assessed: (1) one-dimensionality, ensuring the measurement of a single latent trait (food insecurity); (2) equal discrimination across items (homogeneity) and (3) conditional local independence of item responses, evaluated via the residual correlation matrix. All statistical analyses for the Rasch model were performed using survey design weights to ensure national representativeness.
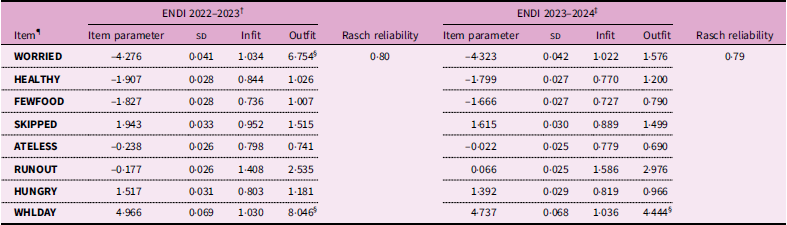
Model fit was assessed using infit and outfit statistics to evaluate the deterministic and stochastic components of the scale, in accordance with FAO global standards(Reference Ballard, Kepple and Cafiero32). Acceptable infit values were defined as 0·7 to 1·3, indicating adequate internal consistency and that the items were well-targeted to the population’s underlying severity. For outfit statistics, values below 2 were considered acceptable, as higher values may reflect atypical or isolated response patterns without necessarily compromising overall scale performance. Item redundancy and local independence were evaluated using the residual correlation matrix, considering acceptable residual correlation values between –0·4 and 0·4. No significant residual correlations greater than 0·4 were observed between items; only the Healthy–Fewfood pair exceeded this value (0·42) in the 2023–2024 round(33), these did not affect the overall validity of the scale.
Overall Rasch reliability coefficient indicated good measurement reliability in both survey rounds (0·80 in 2022–2023 and 0·79 in 2023–2024). Item-level parameters and fit statistics for each survey round are presented in Table 2. Although some items showed elevated outfit values, these did not affect the overall validity of the scale; therefore, no items were excluded from the analysis
Statistical validations and item parameters

Table 2. Long description
A table comparing item parameters and reliability across two survey rounds, ENDI 2022-2023 and ENDI 2023-2024. The table has 8 rows and 10 columns. Column headers are Item, Item parameter, SD, Infit, Outfit, Rasch reliability for ENDI 2022-2023, and Item parameter, SD, Infit, Outfit, Rasch reliability for ENDI 2023-2024. Row labels include WORRIED, HEALTHY, FEWFOOD, SKIPPED, ATELESS, RUNOUT, HUNGRY, WHLDAY. Row 1: WORRIED, -4.276, 0.041, 1.034, 6.754, 0.80, -4.323, 0.042, 1.022, 1.576, 0.79. Row 2: HEALTHY, -1.907, 0.028, 0.844, 1.026,, -1.799, 0.027, 0.770, 1.200, . Row 3: FEWFOOD, -1.827, 0.028, 0.736, 1.007,, -1.666, 0.027, 0.727, 0.790, . Row 4: SKIPPED, 1.943, 0.033, 0.952, 1.515,, 1.615, 0.030, 0.889, 1.499, . Row 5: ATELESS, -0.238, 0.026, 0.798, 0.741,, -0.022, 0.025, 0.779, 0.690, . Row 6: RUNOUT, -0.177, 0.026, 1.408, 2.535,, 0.066, 0.025, 1.586, 2.976, . Row 7: HUNGRY, 1.517, 0.031, 0.803, 1.181,, 1.392, 0.029, 0.819, 0.966, . Row 8: WHLDAY, 4.966, 0.069, 1.030, 8.046,, 4.737, 0.068, 1.036, 4.444, .
† Number of complete non-extreme cases in ENDI 2022–2023: n 13 650.
‡ Number of complete non-extreme cases in ENDI 2023–2024: n 13 943.
§ Elevated outfit values reflect atypical response patterns.
¶ Item labels as defined in Table 1.
Statistical analysis
Descriptive statistics were used to characterise the study population, obtaining frequencies and percentages. Differences in FI prevalence between survey rounds were assessed using χ 2 tests.
The survey design was declared using the primary sampling units (id_upm), stratum (estrato) and normalised expansion factor (fexp) variables, following the ENDI sampling design documentation (147 strata, 2,820 PSU).
The Tobit regression models were used to analyse factors associated with the severity of FI, measured using the continuous raw FIES score (range 0–8), accounting for the lower (0) and upper (8) bounds. Reference categories for all categorical covariates in the Tobit model correspond to the first category as coded in the official ENDI database. No additional sensitivity analyses were performed beyond the corrected survey-design specification reported above. For statistical analyses, the FIES analytical application (available online at: https://fies.shinyapps.io/ExtendedApp/) and STATA v17 were used. All analyses were adjusted using sampling weights to account for the complex survey design of the ENDI.
Ethical considerations
The ENDI was conducted by INEC in accordance with national ethical standards. The survey protocol received ethical approval. This study used anonymised data and did not involve direct interaction with participants.
Results
A total of 19 187 households (22 260 children under 5 years of age) were included in the 2022–2023 round and 20 186 households (23 187 children under five) in the 2023–2024 round. The socio-demographic and health profile of surveyed households changed significantly between rounds, including a lower proportion of respondents self-identifying as White, higher proportions identifying as Indigenous and Montubio, a greater share of children aged <6 months, a lower prevalence of poverty, a 6·62 percentage-point (p.p) decrease in anaemia, a reduction in acute malnutrition and an increase in global malnutrition. These changes between surveys were statistically significant (Table Supplementary 1).
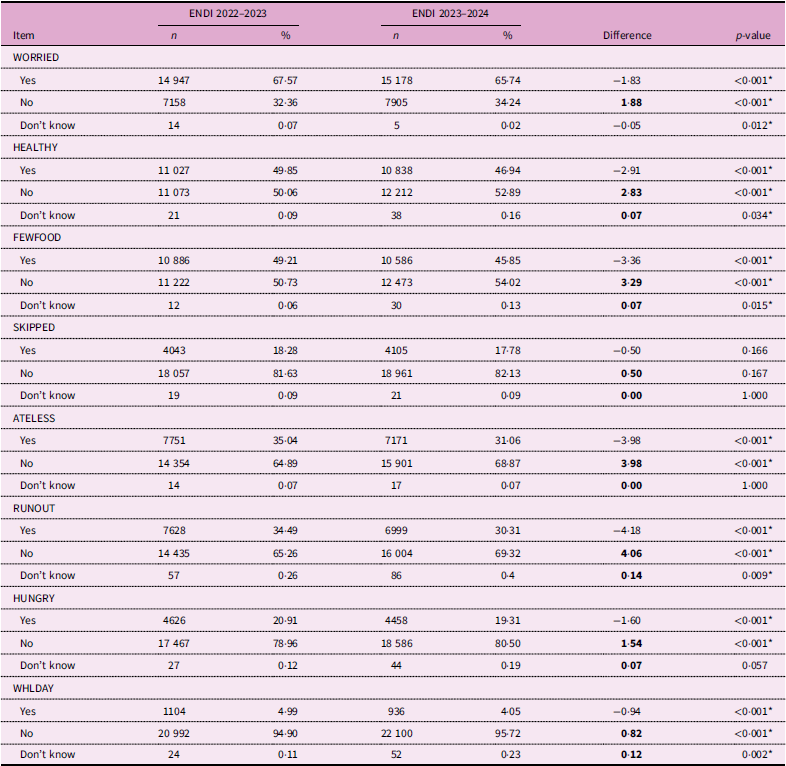
At the item level, the FIES showed statistically significant reductions in seven of the eight items between rounds (Table 3). In both surveys, food access constraints were common: over 60 % of caregivers reported worrying about not having enough food due to lack of resources (WORRIED), more than 40 % reported that children were unable to consume healthy and nutritious foods due to a lack of resources (HEALTHY) and more than 15 % reported skipping meals because of insufficient resources (SKIPPED) (Table 3).
Food Insecurity Experience Scale items for children under 5 years of age, answered by the household head or caregiver. During the past 12 months. National Survey on Child Malnutrition (ENDI), Ecuador, first round 2022–2023 and second round 2023–2024

Table 3. Long description
The table compares responses to the Food Insecurity Experience Scale items for children under 5 years of age between the first round (2022-2023) and the second round (2023-2024) of the National Survey on Child Malnutrition in Ecuador. The table has 8 rows and 7 columns. Column headers are: Item, ENDI 2022-2023 n, ENDI 2022-2023 %, ENDI 2023-2024 n, ENDI 2023-2024 %, Difference, and p-value. Row labels are: WORRIED, HEALTHY, FEWFOOD, SKIPPED, ATELESS, RUNOUT, HUNGRY, and WHLDAY. Each row provides the number of responses (n), percentage (%), difference between the two rounds, and p-value for statistical significance. Notable trends include significant reductions in the percentage of caregivers reporting worries about food, inability to consume healthy foods, and skipping meals between the two rounds.
Significant for WORRIED – Uncertainty and worry about food; HEALTHY – Inadequate food quality; FEWFOOD – Inadequate food quality; SKIPPED – Insufficient food quantity; ATELESS – Insufficient food quantity; RUNOUT – Insufficient food quantity; HUNGRY – Insufficient food quantity; WHLDAY – Insufficient food quantity.
Values in bold represent categories with a prevalence increase between the first round 2022–2023 and the second round 2023–2024.
*p-value statistically significant difference.
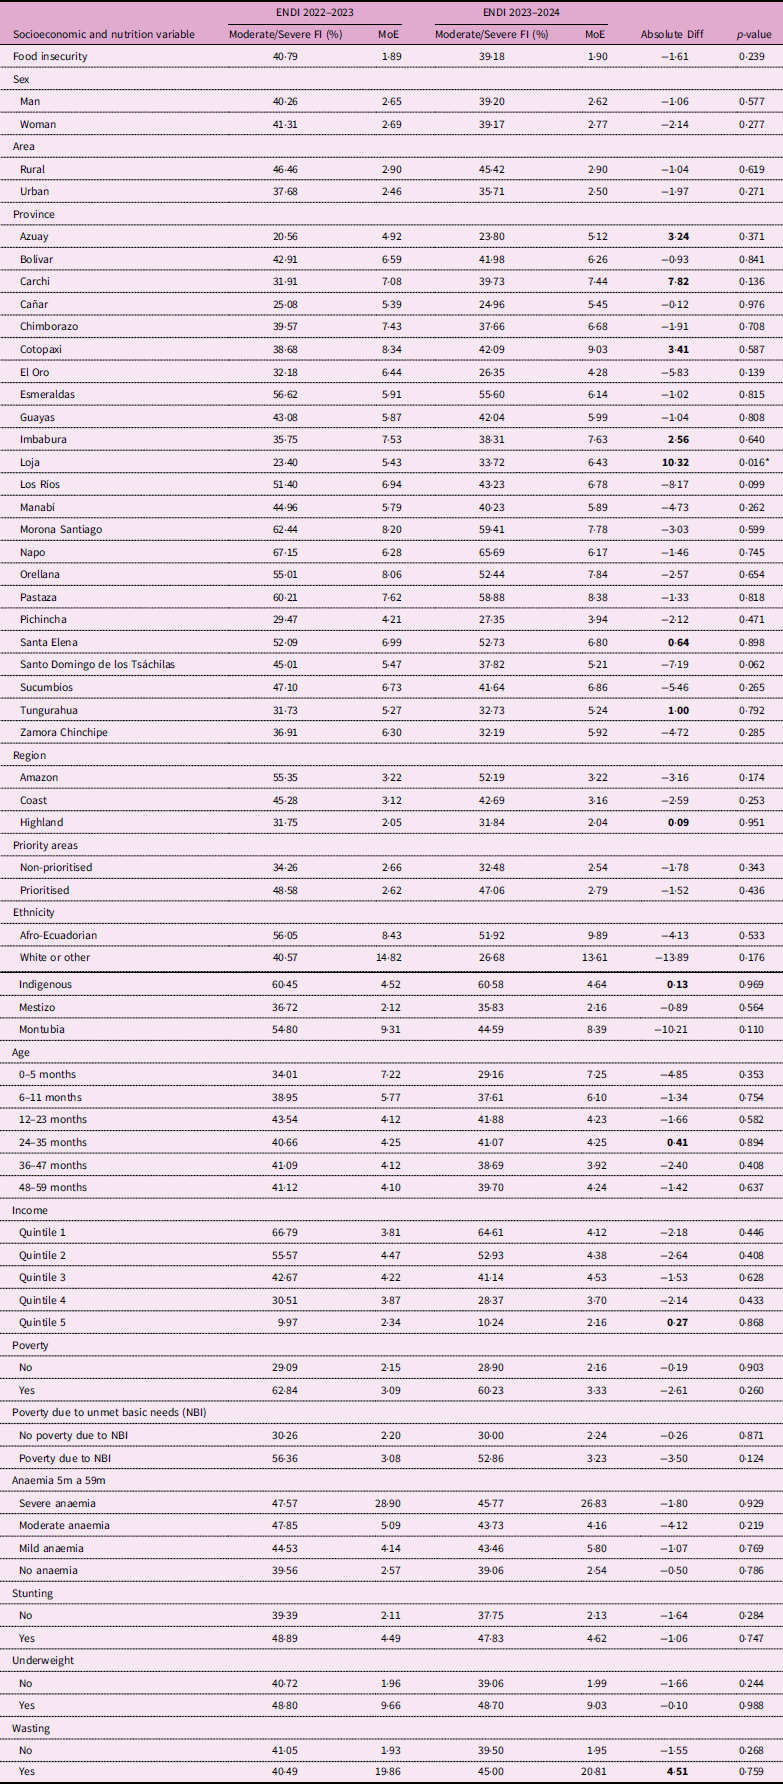
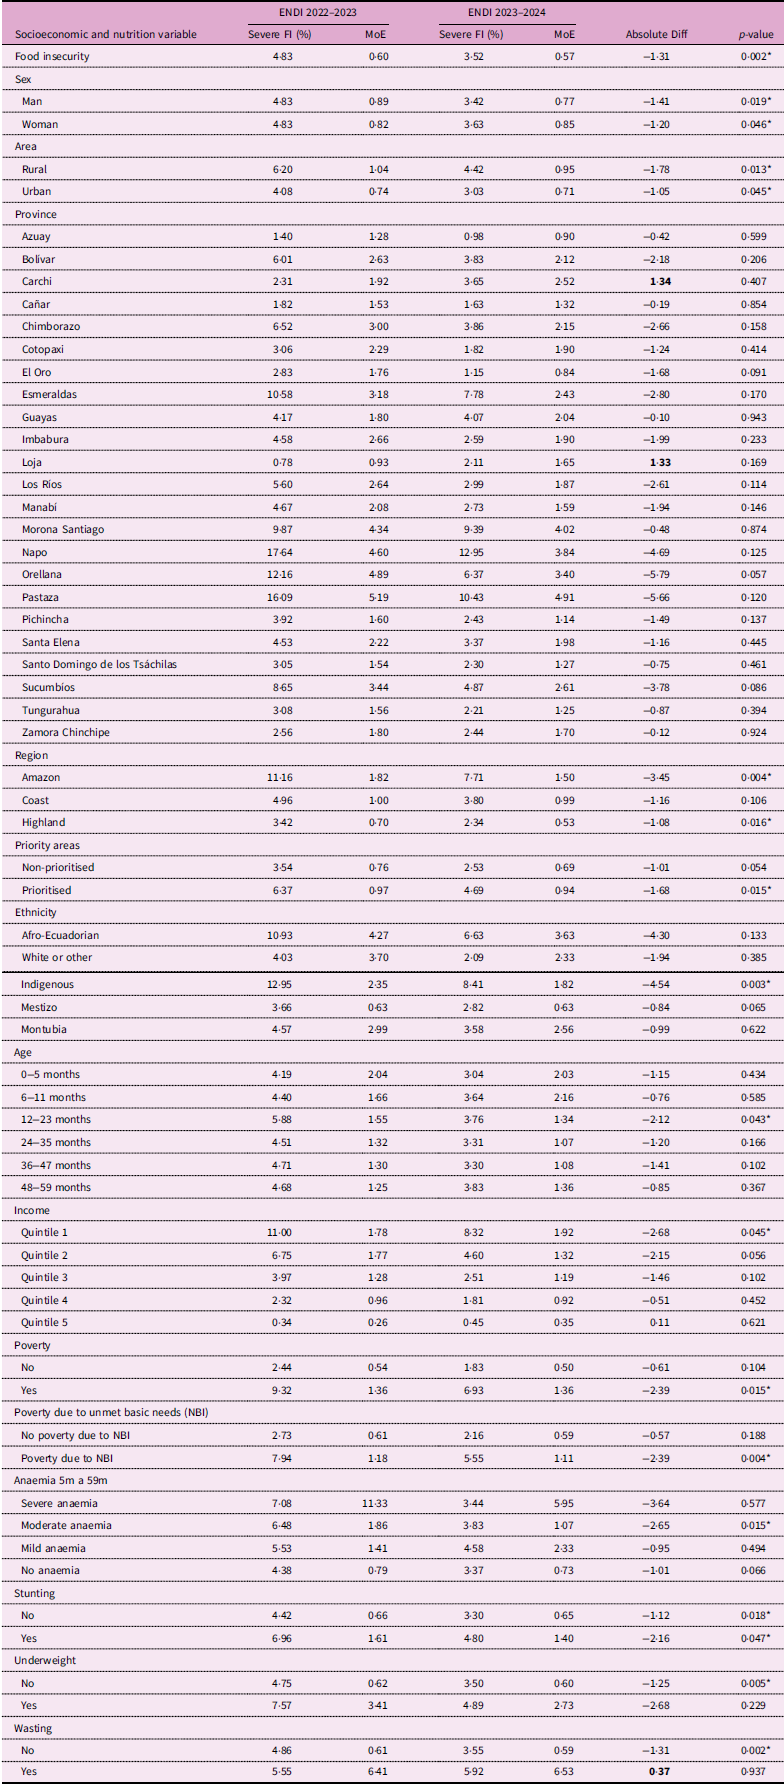
Overall, the prevalence of moderate or severe FI among households with children under five was 40·79 % (MoE 1·89) in 2022–2023 and 39·18 % (MoE 1·90) in 2023–2024, representing a 1·61 p.p. decline that was not statistically significant (p = 0·239) (Table 4). In contrast, severe FI declined from 4·83 % to 3·52 % (–1·31 p.p.; p = 0·002) (Table 5).
Geographic disparities persisted across rounds. In 2022–2023, moderate-to-severe FI ranged from 67·15 % in Napo to 20·56 % in Azuay, with broadly similar patterns in 2023–2024 (Table 4). Notably, Loja showed a significant increase of 10·32 p.p. between rounds (p = 0·016) (Table 4).
Socioeconomic conditions and moderate-severe food insecurity in households with children under 5 years of age. National survey on child malnutrition (ENDI), Ecuador, first round 2022–2023 and second round 2023–2024

Table 4. Long description
The table presents data on socioeconomic conditions and moderate-severe food insecurity in households with children under 5 years of age in Ecuador for the periods 2022-2023 and 2023-2024. It includes columns for the socioeconomic and nutrition variable, percentages for both periods, the margin of error (MoE), absolute difference, and p-value. The table is divided into sections such as sex, area, region, ethnicity, age, income, poverty, and health conditions. Each row provides specific data points for these categories. Notable trends include changes in food insecurity percentages across different demographic groups and regions.
MoE, margin of error; NBI, unmet basic needs; household income quintiles: Quintile 1 = lowest household income and Quintile 5 = highest household income; anaemia: severe anaemia (Hb < 7.0 g/dL), moderate anaemia (Hb 7.0–9.9 g/dL), mild anaemia (Hb 10.0–10.9 g/dL) and no anaemia (Hb ≥ 11.0 g/dL).
Values in bold represent categories with a prevalence increase between the first round 2022–2023 and the second round 2023–2024.
*p-value statistically significant difference.
Socioeconomic conditions and severe food insecurity in households with children under 5 years of age. National survey on child malnutrition (ENDI), Ecuador, first round 2022–2023 and second round 2023–2024

Table 5. Long description
The table presents data on socioeconomic and nutrition variables for households with children under five in Ecuador, comparing two periods: 2022-2023 and 2023-2024. It includes columns for the variable name, percentage of severe food insecurity (FI) for both periods, margin of error (MoE), absolute difference, and p-value. The table is divided into several sections: sex, area, province, region, priority area, ethnicity, age, income, poverty, poverty due to unmet basic needs (NBI), anaemia, stunting, underweight, and wasting. Each section lists specific categories and their corresponding data. For example, under the sex category, the prevalence of severe FI for males and females is compared across the two periods. The table also includes data on rural and urban areas, various provinces, and different ethnic groups. Notable trends include changes in the prevalence of severe FI, anaemia, stunting, underweight, and wasting across different categories and periods.
Income: represent Quintile 1 = lowest household income; Quintile 5 = highest household income; anaemia: severe anaemia (Hb < 7.0 g/dL), moderate anaemia (Hb 7.0−9.9 g/dL), mild anaemia (Hb 10.0−10.9 g/dL) and no anaemia (Hb ≥ 11.0 g/dL).
Values in bold represent categories with a prevalence increase between the first round 2022−2023 and the second round 2023–2024.
*p-value statistically significant difference.
Across both surveys, higher-than-average prevalence of moderate-to-severe FI was observed among households in rural areas, the Amazon region, priority areas and among Indigenous and Afro-descendant populations, as well as among poor households and children with adverse nutritional conditions, including severe anaemia, chronic or acute malnutrition and low weight for age (Table 4).
For severe FI, significant reductions between rounds were observed for several subgroups, including households in rural and urban areas, the Amazon region, priority areas, Indigenous ethnicity, children aged 12–23 months, households in poverty and children with moderate anaemia (Table 5).
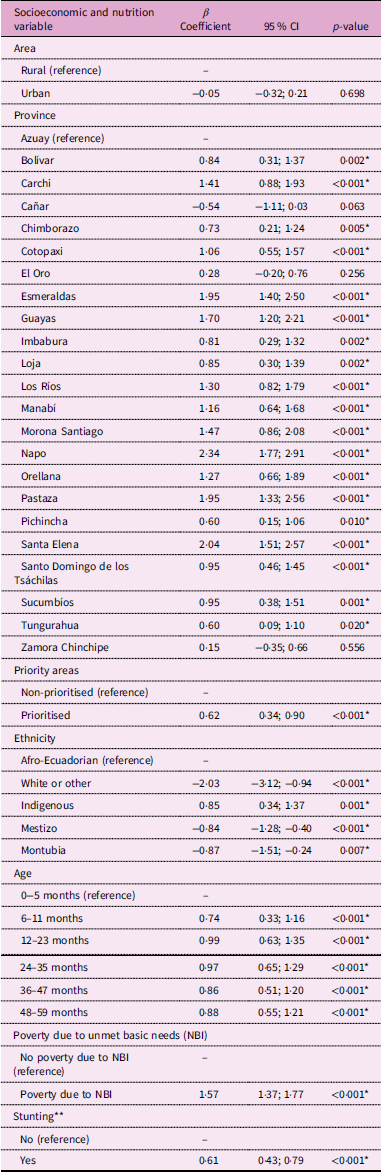
Of the 23 187 children surveyed, 856 (3·7 %) were excluded due to missing stunting data (Table Supplementary 1), leaving 22 331 children (19 498 households) for the Tobit model. Of these, 7,961 (35·7 %) scored 0 (left-censored) and 721 (3·2 %) scored 8 (right-censored) on the FIES, supporting the Tobit approach over ordinary least squares. In the multivariable Tobit model (Table 6), FI severity varied substantially by province, with the highest coefficients observed in Napo, Santa Elena and Esmeraldas. Severity was significantly higher among households in prioritised territories (β = 0·62, 95 % CI 0·34; 0·90), among Indigenous households relative to Afro-Ecuadorian households (β = 0·85, 95 % CI 0·34; 1·37) and among households experiencing poverty due to unmet basic needs (β = 1·57, 95 % CI 1·37; 1·77). Severity also increased with child age, being higher among children older than 6 months compared with those aged 0–5 months, and among children with stunting (β = 0·61, 95 %CI 0·43–0·79). Area of residence was not significantly associated with FI severity (p = 0·698).
Factors associated with FI in households with children under 5 years of age using Tobit regression. National survey on child malnutrition (ENDI), Ecuador, second round 2023–2024 (N 22 331; 19 498 households)

Table 6. Long description
A table with 20 rows and 4 columns. The columns are labeled Socioeconomic and nutrition variable, Beta Coefficient, 95% CI, and p-value. The table presents data on the association of various factors with food insecurity (FI) in households with children under 5 years of age. The factors include area (rural or urban), province, priority areas, ethnicity, age, poverty due to unmet basic needs (NBI), and stunting. Each row lists a specific factor, its beta coefficient, the 95% confidence interval (CI), and the p-value. Notable trends include higher FI severity in certain provinces like Napo, Santa Elena, and Esmeraldas, among households in prioritized territories, Indigenous households, and those experiencing poverty due to unmet basic needs. FI severity also increases with child age and is higher among children with stunting. Area of residence is not significantly associated with FI severity.
NBI, unmet basic needs index; FI, food insecurity.
* p-value statistically significant difference.
** Missing data: 856 households (3·7 %).
Discussion
This study provides updated evidence on the magnitude and distribution of FI among households with at least one child under 5 years of age in Ecuador, based on data from the ENDI 2022–2023 and ENDI 2023–2024. The findings indicate a high prevalence of moderate and severe FI, affecting close to 40 % of households with young children. Although a modest reduction was observed across survey rounds, FI remains widespread, underscoring the persistence of structural inequalities that disproportionately affect vulnerable populations. An important finding is that improvements were concentrated in the most severe forms of FI, whereas moderate-to-severe FI remained largely unchanged. This pattern may indicate that recent social protection policies have been effective in preventing the most extreme manifestations of food deprivation but have been insufficient to address broader challenges related to food affordability, dietary quality and economic vulnerability. Similar patterns have been reported in several Latin American countries following the COVID-19 pandemic, where emergency assistance reduced severe hunger but did not substantially improve overall FS(Reference Contreras Peralta and Cortés Piedra34,Reference Vasconcelos-Neto, Jacob and Tregidgo35) .
According to FAO, approximately 2,287·9 million people worldwide experienced moderate or severe FI during the period 2022–2024(6). In Latin America, FI has increased over the last decade, driven by economic shocks, the COVID-19 pandemic and volatility in food prices(36). Within this context, Ecuador follows a similar pattern, in which recent improvements in selected nutritional indicators coexist with sustained levels of FI among households with young children. These findings position Ecuador among the Latin American countries where FI remains substantially higher than the global average, particularly among households with young children, emphasising the need for sustained monitoring through nationally representative surveys(Reference Hernández-Vásquez, Visconti-Lopez and Vargas-Fernández37).
The reduction in FI observed between rounds (2022–2023 and 2023–2024), although limited, may be consistent with the expansion of post-pandemic social protection measures, including cash transfers and targeted assistance to low-income households. However, the magnitude of the change (1·61 p.p, NS) suggests that these improvements have been partial and uneven across population groups and territories. Higher levels of FI persisted among rural households, Indigenous populations, residents of the Amazon region and households experiencing poverty, highlighting the role of structural and territorial determinants. These results are consistent with regional evidence indicating that ethnicity, geographic location and poverty are key drivers of FI in Latin America(Reference Carpio Arias, Guijarro-Garvi and Morejón-Terán38,Reference Novoa-Sanzana, Moya-Osorio and Morejón Terán39) .
The persistence of FI among Indigenous households deserves particular attention. Indigenous communities frequently experience cumulative social disadvantages, including lower income, reduced educational opportunities, geographic isolation and limited access to social protection programs. Similar disparities have been reported throughout Latin America, where Indigenous populations consistently exhibit higher levels of FI than non-Indigenous groups(Reference Davis and Sieder40). These findings suggest that FI in Ecuador is not only an economic phenomenon but also reflects historical and structural inequities affecting ethnic minorities.
The consistently higher prevalence of FI observed in the Amazon region likely reflects a combination of structural geographic and socio-economic disadvantages(Reference Torres-Vitolas, Harvey and Cruz-Garcia41). Despite its biodiversity and agricultural potential, Amazonian territories are characterised by greater geographic isolation, reduced access to markets and health services, higher transportation costs and persistent multidimensional poverty(Reference Aquino, Fernandes da Silva and Aguiar42). These structural barriers may limit both physical and economic access to nutritious foods, helping explain why provinces such as Napo, Pastaza and Orellana consistently exhibited the highest prevalence levels across survey rounds.
FI in this study was strongly associated with adverse socio-economic and nutritional conditions, including poverty due to unmet basic needs and childhood anaemia. International evidence has consistently shown that children living in food-insecure households tend to experience higher prevalence of stunting, anaemia and micronutrient deficiencies, as well as poorer health outcomes(Reference Pasricha, Drakesmith and Black43,Reference Cook, Frank and Levenson44) . Although Ecuador experienced a notable reduction in anaemia between survey rounds, its prevalence remains high, potentially limiting the broader nutritional gains associated with improved food access. The independent association between household FI and child stunting reinforces evidence suggesting that chronic limitations in food access contribute not only to short-term nutritional deficiencies but also to long-term growth impairment. Although the cross-sectional design prevents causal inference, the findings are consistent with recent meta-analyses reporting significantly higher odds of stunting among children living in food-insecure households(Reference Moradi, Mirzababaei and Mohammadi8).
Severe FI, reported by 3·5 % of households in the 2023–2024 round of ENDI, reflects extreme situations in which children skip meals or experience prolonged periods without food. While this prevalence is lower than that reported in some lower-middle-income countries, its implications are particularly concerning given the well-documented associations between early-life hunger, impaired neurodevelopment, poorer educational outcomes and long-term socio-economic disadvantages(Reference Cohn-Schwartz and Weinstein45,Reference Emerson, Savage and Llewellyn46) . These findings highlight the need for targeted interventions aimed at households facing extreme deprivation, particularly those identified through high FI prevalence. Consequently, reducing severe FI should remain a priority within national child development and poverty-reduction strategies.
In Ecuador, early childhood interventions are currently framed within the National Strategy ‘Ecuador Crece sin Desnutrición Infantil,’ which has strengthened institutional coordination and monitoring mechanisms to address chronic child undernutrition. Although the strategy has prioritised actions in health, nutrition and care services, explicit interventions to improve household FS, particularly access to adequate and diverse diets for families with young children, have been limited in implementation. The recent inclusion of the Ministry of Agriculture offers an opportunity to strengthen linkages between child nutrition policies and food systems, especially in priority territories. Furthermore, reducing anaemia requires additional interventions such as Fe supplementation and dietary diversification strategies, particularly in rural and indigenous areas, as well as ensuring compliance with the fortification of wheat flour with iron, folic acid, thiamine (vitamin B1) and riboflavin (vitamin B2)(47–49). The increasing odds of FI observed among households with older infants and toddlers likely reflect the transition from exclusive breast-feeding to complementary feeding, a period characterised by higher food costs, greater dietary diversity requirements and increased vulnerability to economic shocks.
From a policy perspective, the persistence of FI among households with young children represents a major challenge for achieving Sustainable Development Goal 2 (Zero Hunger) and Sustainable Development Goal 10 (Reduced Inequalities). Strengthening linkages between nutrition policies, social protection programs, agricultural development and food systems interventions will be essential to accelerate progress among the most vulnerable populations.
The strengths of our study include the large sample size of surveys representative of families with children under 5 years old in Ecuador, and the use of recent data compared with previous studies conducted at the local level and with adult population groups. Notably, the use of socio-economic variables and robust statistical analysis allows us to quantify FI in households and its evolution over two assessed periods, as well as the protocols implemented for the application of the instruments and the taking of anthropometric measurements. Our study also has some limitations. First, disaggregation by province could mask high heterogeneity within subunits such as cantons. However, this is the level that enables local decision-makers to gain knowledge. Another specific limitation is due to the use of secondary data and the fact that other variables related to FS were not considered. Another limitation is that the two survey rounds represent independent nationally representative cross-sectional samples rather than repeated observations of the same households. Consequently, differences observed between rounds should be interpreted as population-level changes rather than longitudinal changes within households; another limitation is that the 12-month recall period of the FIES may be subject to recall bias, and households responding ‘don’t know’ were treated as missing rather than imputed.
In conclusion, FI remains a major public health challenge among households with children under 5 years of age in Ecuador. Despite modest improvements observed in the second round 2023–2024, substantial inequalities related to poverty, ethnicity and geographic region persist. These findings underscore the urgency of strengthening comprehensive integrated policies that address both FS and child nutrition, with a particular focus on the most vulnerable populations. Given the nationally representative, probabilistic design of the ENDI, these findings can be generalised to Ecuadorian households with children under 5 years of age at the national, provincial and urban/rural levels.
Supplementary material
For supplementary material accompanying this paper visit https://doi.org/10.1017/S1368980026103541
Author contributions
Y.A.M.T, S.D.A, G.R.M: Conceptualisation, methodology, formal analysis, writing – original draft; Y.A.M.T, G.R.M, I.R: methodology, formal analysis, writing – review and editing – original draft. Y.A.M.T, S.D.A, G.R.M, I.R, S.A.M: writing – review and editing.
Financial support
This research received no specific grant from any funding agency, commercial or not-for-profit sectors.
Competing interests
There are no conflicts of interest.
Ethical standards
This study used secondary data. The National Survey on Child Malnutrition (ENDI) was conducted by INEC in accordance with national ethical standards. The survey protocol received ethical approval, and informed consent was obtained from all participating households prior to data collection. This study used anonymised data and did not involve direct interaction with participants.


 Open access

