Introduction
Globally, lake sediments record changing climate and land-use conditions over the past two centuries, with accelerated sedimentation beginning around 1950 CE during “The Great Acceleration” (e.g., Baud et al., Reference Baud, Jenny, Francus and Gregory-Eaves2021; Head et al., Reference Head, Steffen, Fagerlind, Waters, Poirier, Syvitski and Zalasiewicz2022). This trend is widely attributed to population growth, land-use intensification, and anthropogenic warming. Increases in sediment transport and deposition are particularly pronounced where climate change, hydrologic variability, and human disturbance intersect (Jenny et al., Reference Jenny, Koirala, Gregory-Eaves, Francus, Niemann, Ahrens and Brovkin2019; Chraïbi and Fritz, Reference Chraïbi and Fritz2020; Dethier et al., Reference Dethier, Renshaw and Magilligan2022; Syvitski et al., Reference Syvitski, Ángel, Saito, Overeem, Vörösmarty, Wang and Olago2022). Lake sediment mass accumulation rate (MAR) during the twentieth century increased roughly threefold on a global scale, largely reflecting enhanced watershed erosion associated with agriculture and urbanization (Baud et al., Reference Baud, Jenny, Francus and Gregory-Eaves2021). However, even remote lakes show evidence of accelerated sedimentation (Wolfe et al., Reference Wolfe, Hobbs, Birks, Briner, Holmgren, Ingólfsson and Kaushal2013), underscoring the pervasive reach of environmental change. It is unsurprising, then, that high elevation alpine lakes occasionally record twentieth-century increases in MAR and shifts in organic composition – even in systems with relatively limited drainage disturbance from humans (e.g., Engstrom et al., Reference Engstrom, Whitlock, Fritz and Wright1991; Chraïbi and Fritz, Reference Chraïbi and Fritz2020; Baud et al., Reference Baud, Jenny, Francus and Gregory-Eaves2021).
In alpine and proglacial settings, identifying the dominant drivers of sedimentation is particularly challenging because glacier retreat itself can elevate sediment yields. Proglacial sedimentation rates typically increase during periods of ice retreat as glacier sliding, meltwater flux, slope instability, and sediment delivery intensify (Leonard, Reference Leonard1997; Koppes and Hallet, Reference Koppes and Hallet2002; Koppes et al., Reference Koppes, Hallet, Rignot, Mouginot, Wellner and Boldt2015; Zhang et al., Reference Zhang, Li, East, Walling, Lane, Overeem, Beylich, Koppes and Lu2022). Even modest warming can alter precipitation phase (snow versus rain), glacier mass balance, and runoff seasonality (Cannone et al., Reference Cannone, Diolaiuti, Guglielmin and Smiraglia2008; Bliss et al., Reference Bliss, Hock and Radić2014; Gobiet et al., Reference Gobiet, Kotlarski, Beniston, Heinrich, Rajczak and Stoffel2014; Hock et al., Reference Hock, Roberts, Masson-Delmotte, Zhai, Tignor, Pol, Tignor, Pol, Pörtner, Roberts, Masson-Delmotte, Zhai, Tignor, Poloczanska and Mintenbeck2022; Rumpf et al., Reference Rumpf, Gravey, Brönnimann, Luoto, Cianfrani, Mariethoz and Guisan2022), all of which strongly influence sediment transport to downstream lakes. Disentangling the relative roles of glacier retreat, climatic forcing, and land use therefore remains essential for interpreting twentieth- and twenty-first-century increases in sedimentation in alpine lake systems.
In addition to sedimentation rates, bulk organic geochemical proxies such as carbon-to-nitrogen (C:N) ratios and stable carbon isotopic composition (δ13C) provide powerful insights into environmental and ecosystem changes in proglacial lakes as glaciers retreat and catchments evolve. In these systems, C:N ratios help distinguish between autochthonous organic matter produced within the lake and allochthonous inputs derived from glacial or terrestrial sources. High C:N values typically indicate dominance of terrestrial detritus, while lower ratios reflect enhanced algal productivity as ice cover declines and summer melt seasons lengthen (Meyers and Teranes, Reference Meyers, Teranes, Last and Smol2001; Oleksy et al., Reference Oleksy, Baron, Leavitt and Spaulding2020). Changes in δ13C complement this signal by recording shifts in primary productivity and overall carbon cycling that accompany waning glacial influence and increasing biological activity (Hofmann et al., Reference Hofmann, Kuefner, Mayr, Dubois, Geist and Raeder2021; Meyers and Horie, Reference Meyers and Horie1993).
The stable nitrogen isotopic composition (δ15N) of sedimentary organic matter provides another tool for reconstructing biogeochemical and ecological change in proglacial lakes. δ15N values are sensitive to nitrogen sources and cycling, including atmospheric deposition, soil development, microbial processing, and aquatic productivity (e.g., Talbot, Reference Talbot, Last and Smol2001; Wolfe et al., Reference Wolfe, Van Gorp and Baron2003; Burpee and Saros, Reference Burpee and Saros2020). In newly deglaciated catchments, low (depleted) δ15N values often reflect limited biological nitrogen cycling and dominance of inorganic or glacially derived N, whereas progressive soil formation, vegetation establishment, and anthropogenic nutrient inputs can lead to isotopic enrichment (e.g., Talbot, Reference Talbot, Last and Smol2001; Hobbs et al., Reference Hobbs, Vinebrooke and Wolfe2011). Yet in some alpine and proglacial lake sediments, δ15N values have declined over the past century, reflecting isotopically light nitrogen inputs from synthetic fertilizers and fossil fuel–derived NOx (e.g., Wolfe et al., Reference Wolfe, Van Gorp and Baron2003; Holtgrieve et al., Reference Holtgrieve, Schindler, Hobbs, Leavitt, Ward, Bunting and Chen2011; Gąsiorowski and Sienkiewicz, Reference Gąsiorowski and Sienkiewicz2013; Hofmann et al., Reference Hofmann, Kuefner, Mayr, Dubois, Geist and Raeder2021). In proglacial systems, the spatial pattern of δ15N can further reveal gradients in terrestrial influence and aquatic productivity along sedimentary transects from glacier-proximal to distal basins (Slemmons et al., Reference Slemmons, Rodgers, Stone and Saros2017; Oleksy et al., Reference Oleksy, Baron, Leavitt and Spaulding2020). Warming-driven increases in primary productivity and more efficient internal nitrogen recycling may further contribute to these downward δ15N trends (Wolfe et al., Reference Wolfe, Van Gorp and Baron2003). Collectively, MAR, δ13C, C:N, and δ15N records form a multiproxy framework for assessing the impacts of climate change, ecosystem succession, and human activity during the last century of rapid cryospheric change.
Glacier National Park (GNP) in northwestern Montana (USA) offers a well-documented setting for evaluating the linkages between climate-induced glacier retreat, biogeochemical change, and human activity. The Park’s glaciers have receded steadily since the late nineteenth century (Fagre et al., Reference Fagre, McKeon, Dick and Fountain2017; Martin-Mikle and Fagre, Reference Martin-Mikle and Fagre2019; O’Neel et al., Reference O’Neel, McNeil, Sass, Florentine, Baker, Peitzsch, McGrath, Fountain and Fagre2019), coincident with regional warming and subsequent shifting vegetation patterns (e.g., Carrara, Reference Carrara1989; Apple, Reference Apple2012; Potter, Reference Potter2016; Lambert et al., Reference Lambert, Resler, Shao and Butler2020). Land-use histories further complicate this trajectory. Following the Park’s establishment in 1910 CE and the displacement of the Blackfeet Nation from much of the eastern range (Spence, Reference Spence1996; Craig et al., Reference Craig, Yung and Borrie2012; Farr, Reference Farr2012), Euro-American development expanded rapidly through construction of roads, lodges, and recreational infrastructure (Robinson, Reference Robinson1960; Buchholtz, Reference Buchholtz1976; Architectural Research Consultants, 2002; Glaser and Britton, Reference Glaser and Britton2020). Park visitation has nearly doubled since 2000 (National Park Service, 2025), paralleling increases across other US national parks. The convergence of intensified human activity and climatic change in GNP’s mixed alpine–subalpine terrain has likely amplified impacts on glacier retreat, vegetation succession, runoff, lake temperature, and sedimentation (e.g., Yoccoz et al., Reference Yoccoz, Delestrade and Loison2010; Gobiet et al., Reference Gobiet, Kotlarski, Beniston, Heinrich, Rajczak and Stoffel2014; Borrelli et al., Reference Borrelli, Robinson, Fleischer, Lugato, Ballabio, Alewell and Meusburger2017; Carlson et al., Reference Carlson, Corona, Dentant, Bonet, Thuiller and Choler2017; Kemp et al., Reference Kemp, Sadler and Vanacker2020; Fritts, Reference Fritts2021; Hugonnet et al., Reference Hugonnet, McNabb, Berthier, Menounos, Nuth, Girod and Farinotti2021; Losapio et al., Reference Losapio, Cerabolini, Maffioletti, Tampucci, Gobbi and Caccianiga2021; Pepin et al., Reference Pepin, Arnone, Gobiet, Haslinger, Kotlarski, Notarnicola and Palazzi2022; Rumpf et al., Reference Rumpf, Gravey, Brönnimann, Luoto, Cianfrani, Mariethoz and Guisan2022). The Grinnell and Swiftcurrent valleys of northeastern GNP provide an opportunity to begin to disentangle the effects of glacier retreat, climate-driven environmental change, and human activity on sedimentary and biogeochemical records. Our findings highlight that even protected landscapes are not immune to the cumulative impacts of anthropogenic and climatic changes, while providing an important baseline for assessing future transformations in alpine ecosystems.
Field setting
Glacier National Park in northwestern Montana, USA, is designated as 4660 km2 of federally protected land in the northern US Rocky Mountains. In the 36 km2 Grinnell Valley, just east of the Continental Divide, Grinnell Glacier is in well-documented retreat (Florentine, Reference Florentine2019) with a surface area reduction of 48% between the end of the Little Ice Age (LIA) and 1966 CE, and a 45% change from 1966 and 2015 CE for a total decrease in surface area of 71% between the LIA and 2015 CE (Fagre et al., Reference Fagre, McKeon, Dick and Fountain2017; Martin-Mikle and Fagre, Reference Martin-Mikle and Fagre2019). Downvalley of Grinnell Glacier is a chain of four 15–60-m-deep lakes (Fig. 1): Upper Grinnell, Grinnell, Josephine, and Swiftcurrent lakes, in order downvalley. Grinnell Lake (Site 1) is accessible by hiking trails at one location, but has no motorized boat activity and is closed-in on two sides by steep valley walls and fed by a waterfall from Upper Grinnell Lake and Grinnell Glacier runoff. Lake Josephine (Site 2) and the upstream subbasin of Swiftcurrent Lake (Site 3) are upvalley of the heaviest development in the valley, but have trails, boat launches, and a few structures on their shores. A bathymetric high separates Swiftcurrent Lake into two subbasins with distinct depositional settings (MacGregor et al., Reference MacGregor, Riihimaki, Myrbo, Shapley and Jankowski2011); the downstream subbasin (Site 4) also captures the 44 km2 Swiftcurrent Valley drainage. Swiftcurrent Valley is the hub of human activity in this part of the Park, including the Swiftcurrent Motor Inn and cabins, the Many Glacier Hotel, Many Glacier campground, and National Park Service infrastructure and housing. Site 4 integrates flow from the entire Swiftcurrent Valley in addition to Grinnell Valley, more than doubling the contributing drainage area of Site 3.
The Many Glacier region of Glacier National Park (GNP), Montana, USA. Lake and stream location data from GIS Coordinator GNP Program (1990). Coring sites (with water depth) shown in yellow, green arrows show direction of water flow. Lake surface elevations decrease in downvalley direction (white labels). General locations of major infrastructure (such as hotels, campgrounds, parking lots, roads, and buildings) visible on images and lighter colored (non-vegetated) surfaces; Swiftcurrent Motor Inn, Many Glacier Campground, parking lots, and NPS Ranger Station and NPS housing shown east of Fishercap Lake (in Swiftcurrent Valley), and the Many Glacier Hotel and associated roads and parking lots shown east of Swiftcurrent Lake. Note the limited number of cleared trails near the southern subbasin of Swiftcurrent Lake, Lake Josephine and Grinnell Lake (all within the Grinnell Valley watershed).

Historical land-use changes around the lakes are tied to GNP and visitor infrastructure. Following the forced sale of 800,000 acres by the Blackfeet Nation in 1895 CE with an agreement to continue traditional use of the property, the Blackfeet were effectively barred from eastern GNP except as visitors in the decades following the Park establishment in 1910 CE (Spence, Reference Spence1996; Craig et al., Reference Craig, Yung and Borrie2012). Notable land-use changes in the Many Glacier region began soon after, with initial construction of the Many Glacier Hotel along the northeastern shore of Swiftcurrent Lake taking place between ∼1911 and 1917 CE with major rehabilitation projects during the 1950s and from 2000 to 2017 CE (Robinson, Reference Robinson1960; Architectural Research Consultants, 2002; Glaser and Britton, Reference Glaser and Britton2020). In the decades following Many Glacier Hotel construction, boat launches were installed in Swiftcurrent Lake and Lake Josephine, trails were built around each lake, and various structures including the Swiftcurrent Motor Inn, campgrounds, Ranger Station buildings, and associated septic systems were constructed in the Swiftcurrent Valley (Fig. 1; Architectural Research Consultants, 2002). Although major construction in the Many Glacier area was completed by 1960 CE, visitation and use of Many Glacier facilities has increased steadily since the Park’s establishment. Annual GNP recreational visitation has been well over one million since 1969 CE and has hovered around three million since 2017 CE; car counts at the Many Glacier entrance have steadily increased since the 1990s CE, although it is one of the lower trafficked regions of the Park overall (National Park Service, 2025).
Both Grinnell and Swiftcurrent valleys are underlain by Middle Proterozoic Belt Group rocks, composed primarily of argillites. Carbonate is present primarily as the stromatolitic dolomite of the Helena and Snowslip Formations, with local outcrops underlying the Grinnell Glacier cirque and making up the highest elevations at the head of the valleys (Whipple, Reference Whipple1992). The remainder of the valley walls and floor at lower elevations consists of metasedimentary rock units and sparse diorite intrusive sills and dikes (Whipple, Reference Whipple1992).
Summer stream gaging station data have been collected at the Swiftcurrent Lake outlet since 1911 CE (US Geological Survey, 2025), just after establishment of the Park (USGS gage 05014500), as well as sporadic summer water discharge data near Grinnell Creek outlet from Upper Grinnell Lake (USGS gage site 05013900). High annual flows measured at this location are typically a result of spring snowmelt events, although a few peak annual flows occurred in late autumn (USGS gauge 05014500).
Methods
Four sediment cores were retrieved from deep segments of Grinnell Lake (Site 1; 20.5 m depth), Lake Josephine (Site 2; 15.6 m depth), and Swiftcurrent Lake (sites 3 (6.8 m depth) and 4 (10.7 m depth)) in 2010 using a Bolivia-type piston corer with a polycarbonate barrel; the entire retrieved core at each site was subsampled in the field at 0.5 cm intervals (see Table SI for site-specific information). Samples were used for 210Pb dating, loss-on-ignition (Heiri et al., Reference Heiri, Lotter and Lemcke2001), and organic carbon/nitrogen content and isotopic analyses. Select smear slides were described (Schnurrenberger et al., Reference Schnurrenberger, Russell and Kelts2003) to identify mineral type/presence, and grain size/shape. X-ray diffraction (XRD) was conducted on several bulk samples (spanning 3–5 cm depth) from cores collected within ∼1 m at sites 1 and 3 to determine bulk mineral composition.
Sediment was analyzed for C:N ratios, δ13C, and δ15N values (Meyers, Reference Meyers1994; Meyers and Lallier-Vergés, Reference Meyers and Lallier-Vergés1999; Meyers and Teranes, Reference Meyers, Teranes, Last and Smol2001). Modern vegetation samples were collected to constrain current organic sources in and around the lakes and to provide support for biogeochemical interpretation of sedimentary results. Modern organic carbon was collected from three aquatic and nine terrestrial sites around the three lakes in summer 2012. Filtrate from five-liter samples of lake water each from Grinnell Lake, Lake Josephine, and the upstream subbasin of Swiftcurrent Lake was also analyzed for δ13C, δ15N, and C:N. For C:N analysis, 12–15 mg freeze-dried sediment or 3 mg freeze-dried vegetation samples were crushed, acidified to remove carbonate, and analyzed using a Thermo Electron Flash Elemental Analyzer (EA) 1112 (sites 1–3) and a Costech ECS 4010 Elemental Combustion Analyzer (Site 4). For δ13C and δ15N samples, vegetation and sediment samples were crushed, acidified to remove any carbonate material, and analyzed on a Finnigan MAT252 mass spectrometer at the University of Minnesota (sites 1–3) and at the Stable Isotope Laboratory, University of New Hampshire (Site 4).
Carbon isotopic values were corrected for the Suess effect (Keeling, Reference Keeling1979; Keeling et al., Reference Keeling, Graven, Welp, Resplandy, Bi, Piper, Sun, Bollenbacher and Meijer2017) to pre-Industrial values using three different models appropriate for small North American lakes (Schelske and Hodell, Reference Schelske and Hodell1995; Verburg, Reference Verburg2007; Dombrosky, Reference Dombrosky2020). We show only corrected values of δ13C for lake sediment and modern vegetation from the most recent model (Dombrosky, Reference Dombrosky2020), which is based on northern hemisphere ice core CO2 values. The Dombrosky (Reference Dombrosky2020) model values are arguably the most relevant for non-marine systems in North America, and provide the most conservative correction (smallest positive adjustment) of δ13C values compared to corrections provided by other models (Schelske and Hodell, Reference Schelske and Hodell1995; Verburg, Reference Verburg2007).
Percent total carbon (%TC) and total inorganic carbon (%TIC) of sediment were measured at all four sites with elemental analyzers; coulometer model UIC CM150 (at sites 1 and 3), UIC Model 5014 (at Site 2), and Costech EA (at Site 4). At sites 1 and 2, total organic carbon (%TOC) was determined by %TOC = %TC − %TIC. Smear slides from sites 3 and 4 showed no carbonate grains (see below) and previous work near Site 3 showed only occasional carbonate presence in a nearby core spanning 12,900 years (MacGregor et al., Reference MacGregor, Riihimaki, Myrbo, Shapley and Jankowski2011); we assume coulometric %TC = %TOC at both sites.
Age controls
The chronology of all four cores is based on 210Pb, a naturally occurring radioisotope with a half-life of 22.3 years, measured at the St. Croix Watershed Research Station. Dry MAR were calculated by the lab, following the constant rate of supply model (CRS; Appleby and Oldfield, Reference Appleby and Oldfield1978). The CRS model assumes a constant fallout of 210Pb from the atmosphere, causing a constant rate of supply of unsupported 210Pb to the sediment surface. Confidence intervals were calculated by first-order error analysis of counting uncertainty (Appleby, Reference Appleby, Last and Smol2001) and without correction for sediment focusing.
Results
Core sediment
Smear slide analysis shows that core sediment is similar at all four sites; primarily silt and clay-sized particles composed of quartz and clays with diatoms and some organic matter. Subrounded carbonate (identified in XRD as dolomite) is present (estimated at < 5% in smear slides) at sites 1 and 2, but carbonate minerals were not observed in smear slide analysis at sites 3 or 4. Smear slides show Site 1 sediment is massive light to dark gray silty clay, and contain diatoms and limited visible organic material. XRD at Site 1 shows inorganic sediments are primarily quartz, chlorite, and illite with the occasional carbonate grain (pink birefringence). Site 2 contains gray to greenish clayey silt; smear slides show quartz, subrounded carbonate minerals, small silt and clay-sized clastic particles with indeterminate mineralogy, and some organic matter along with diatoms. Site 3 smear slides contain massive dark gray clayey silt, with abundant diatoms and some visible organic material. XRD at Site 3 shows the presence of quartz, illite, and chlorite, also measured at another nearby core (MacGregor et al., Reference MacGregor, Riihimaki, Myrbo, Shapley and Jankowski2011). Site 4 smear slides show gray to brown clayey silt with abundant diatoms and occasional coarse (visible with the naked eye) organic material.
Age modeling
Figure 2 shows results from 210Pb analyses at all four sites, with unsupported 210Pb sample activity as a function of depth (column A), age of sample interval using the CRS model (column B), and MAR as a function of depth (column C). Uncertainty in sample age increases with depth, with larger error bars on deeper/older sediment (Fig. 2, column B). Figure 2 (column C) shows variability in MAR with depth at each of the four sites; Site 1 had an oldest age of ∼1847 CE at 20.5 cm depth, Site 2 had a basal age of ∼1853 CE at 7.5 cm depth, Site 3 had an oldest age of ∼1818 CE at 22.5 cm depth, and Site 4 had oldest age of ∼1800 CE at 26.0 cm depth. Variability in average linear sedimentation rate, determined by core length divided by basal age, was 1.3 mm/yr (Site 1), 0.48 mm/yr (Site 2) and 1.2 mm/yr (sites 3 and 4).
Results from 210Pb analysis and CRS modeling. Column A shows unsupported 210Pb as a function of depth, column B shows age (in calendar years) as a function of depth, and column C shows mass accumulation rate (MAR, g/cm2 yr) as a function of depth for Site 1 (blue squares), Site 2 (black circles), Site 3 (red diamonds), and Site 4 (light blue triangles). Note the uncertainties in unsupported 210Pb translate into uncertainties in age and MAR, and increase with depth.

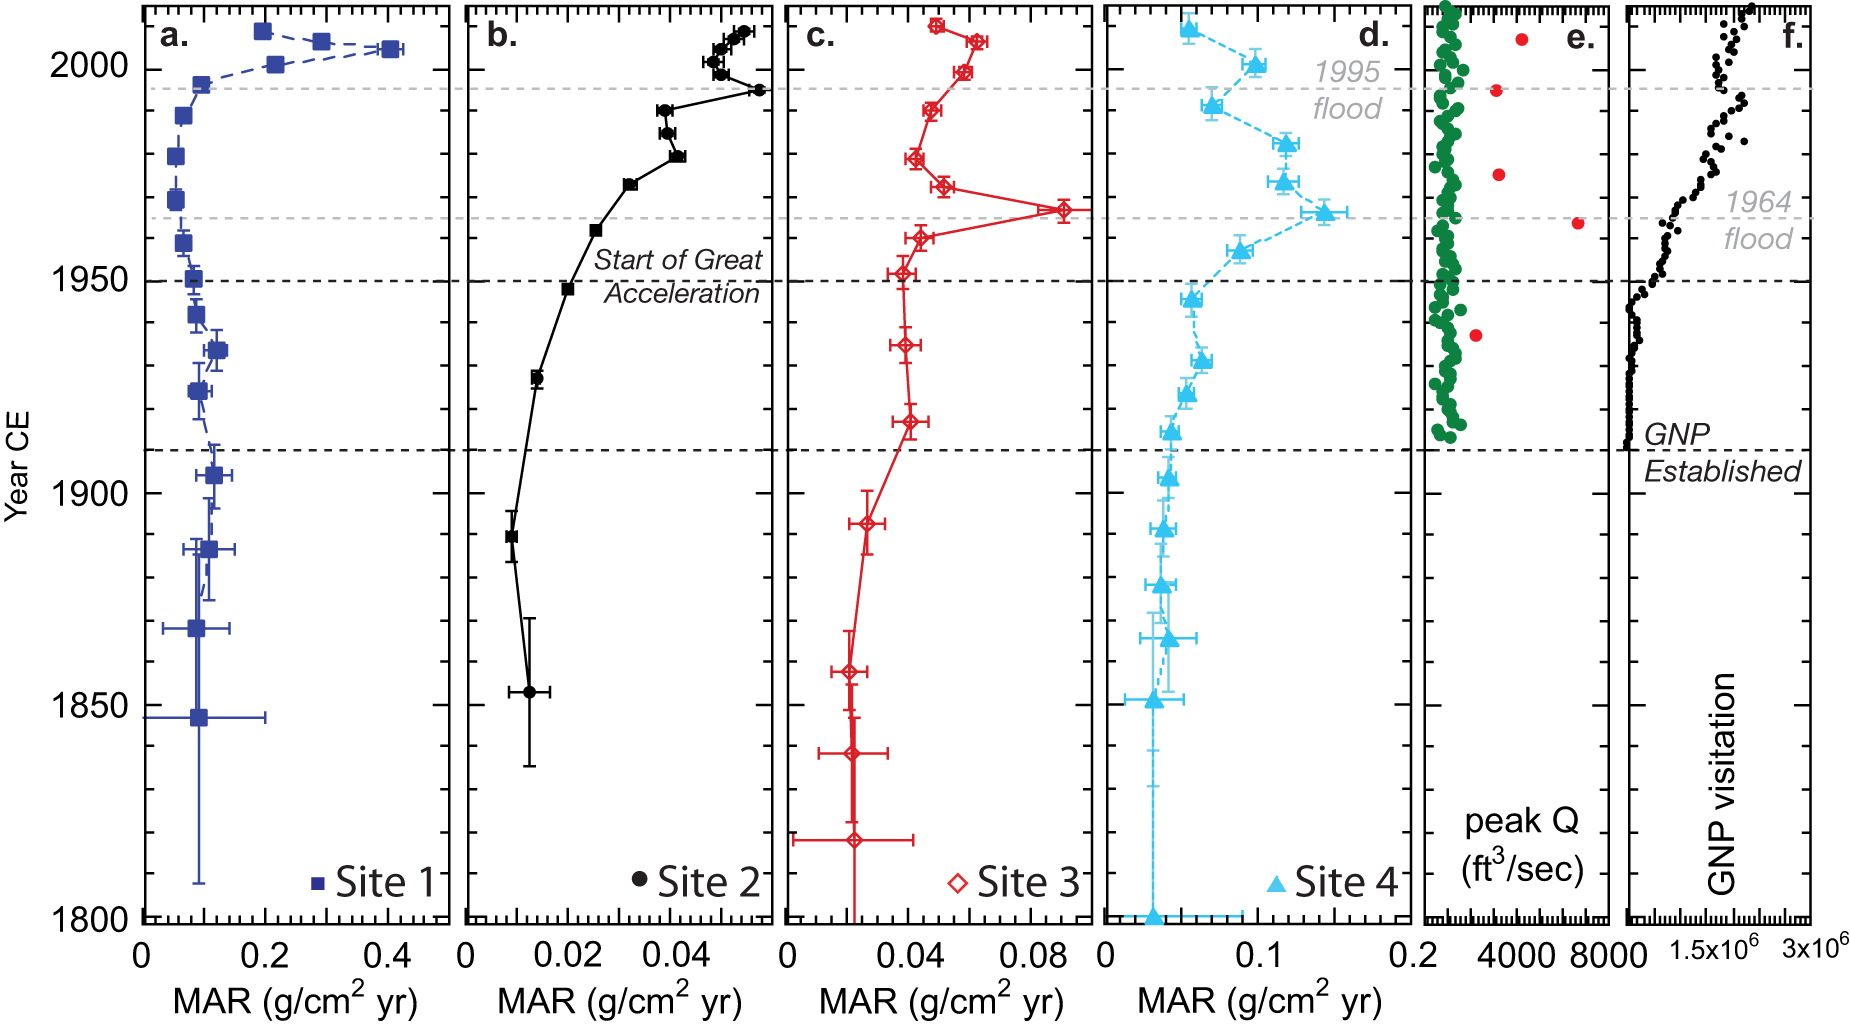
MAR values as a function of age (date CE) are shown in Figure 3. MAR at Site 1 is ∼0.10 g/cm2 yr for much of the nineteenth and early twentieth century, and decreases slightly between ∼1930 and 1980 CE. The highest recorded MAR value (0.41 g/cm2 yr) at Site 1 occurs ∼2005 CE (Fig. 3a), a four-fold increase from the preceding 150 years. The Site 2 MAR steadily increased from 0.01 (a 10-fold lower MAR than at Site 1) to 0.048 g/cm2 yr between the mid-1800s and 2010 CE, and the Site 3 MAR increased from 0.025 g/cm2 yr beginning around 1900 CE to 0.065 g/cm2 yr in ∼2005 CE (with a maximum of 0.095 g/cm2 yr in ∼1966 CE). Increases in MAR at Site 4 began ∼1900 CE (Fig. 3d), from ∼0.03 to 0.18 g/cm2 yr. With the exception of high overall MAR at Site 1, overall MAR increases further downvalley (note Fig. 3 x-axis labels). While MAR at Site 1 is stable or slightly decreasing from the mid-1800s to 1990 CE, the other sites show increased MAR after ∼1900 CE. Only Site 4 has significantly decreased MAR after the 1960s CE, although values never drop to pre-1900 CE values. All four sites showed around a three–five-fold increase in MAR between the mid-1800s CE and the late twentieth century.
(a–d) Historical change in mass accumulation rate (MAR) at all four sites (labeled in downvalley direction) from ∼1800–2015 CE. Note increasing MAR at all four sites over the period of record; MAR is highest overall at Site 1 (a), and increases in magnitude from Site 2 to Site 4 (b–d). (e) Record of peak annual water discharge for each water year (1911–2015 CE) at Swiftcurrent Creek (USGS gauge 05014500; green dots), with the five highest annual water discharge values (red dots). High water discharge (flood events) occurred in 1937, 1964, 1975, 1995, and 2006 CE. Gray dashed lines show where flood events correspond with MAR peaks (1964 and 1995 CE). (f) Glacier National Park, Montana annual visitation numbers from 1911 to 2015 CE (National Park Service, 2025).

The peak annual water discharge at the outlet of Swiftcurrent Lake is shown in Figure 3e. The largest recorded flood event in Grinnell and Swiftcurrent valleys occurred in 1964 CE with a peak discharge of 6700 ft3/s at the Swiftcurrent Lake outlet near Site 4 (Fig. 3e). This corresponds within age uncertainties (+/− 5 years) to peaks in MAR at sites 3 and 4 (Figure 3, gray dashed line). Other floods (red dots, Fig. 3e) are not correlated with spikes in MAR at any of the four sites, with the possible exception of the 1995 CE flood (3150 ft3/s) at Site 2.
Annual visitation in GNP is shown beginning in 1911 CE (National Park Service, 2025); visitation began to increase dramatically in the late 1940s CE and reached 2.5 million by 2015 CE (Fig. 3f).
Carbon and nitrogen
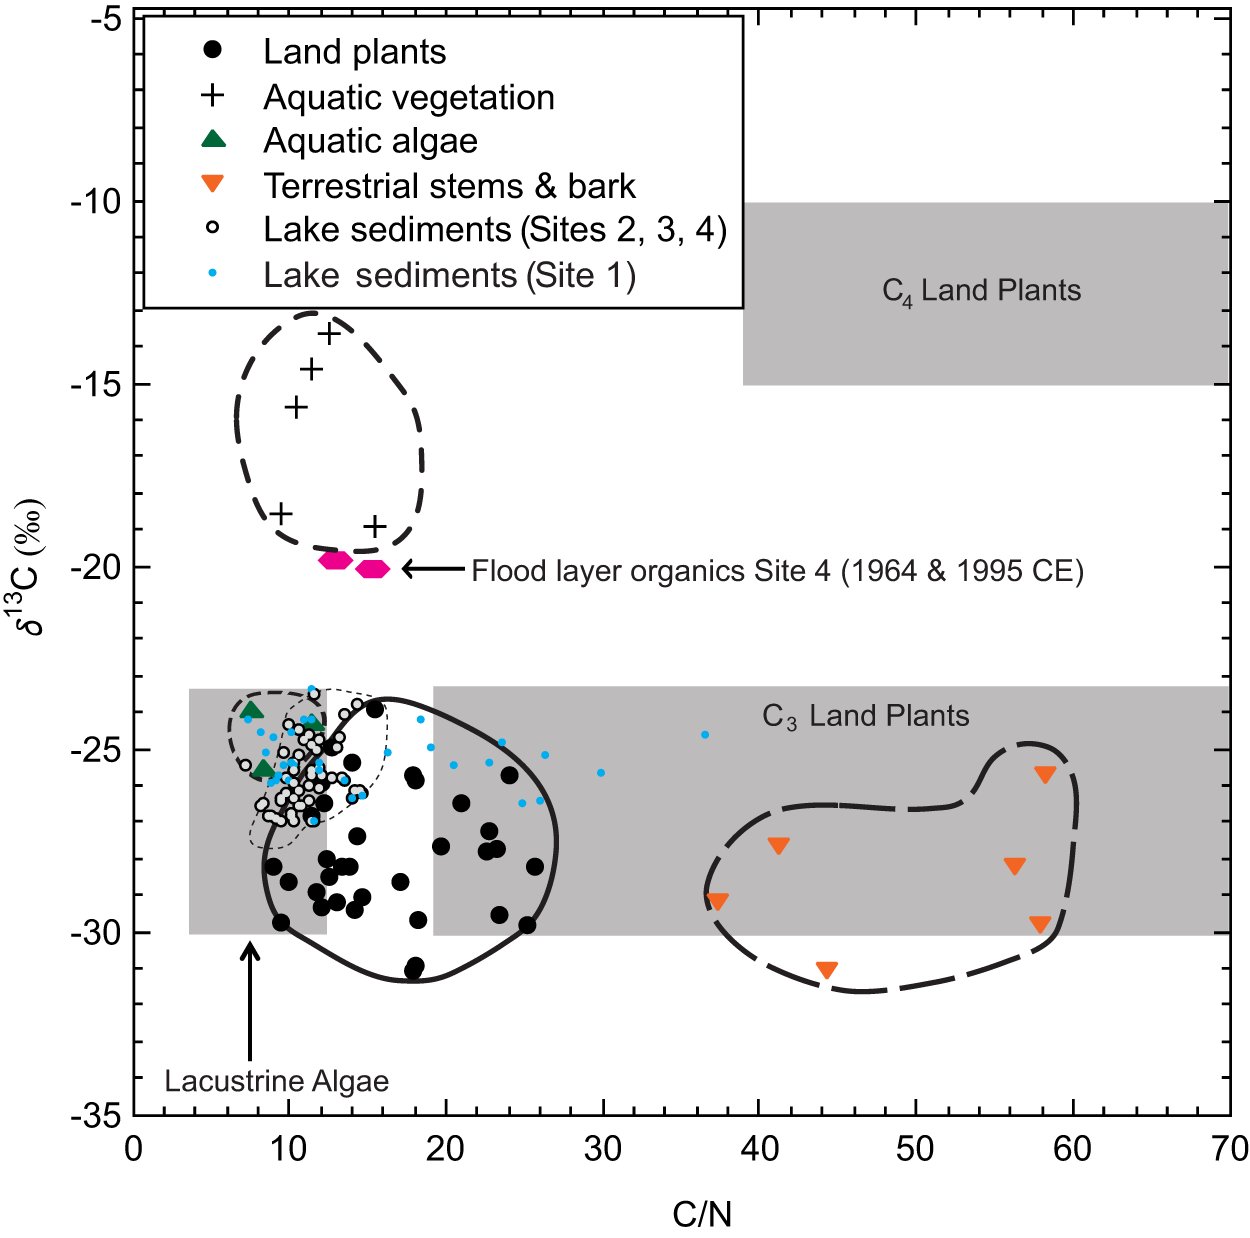
Values of C:N and δ13C for modern terrestrial and aquatic plants and lake algae are shown in Figure 4. Land plants (black circles), terrestrial stems/bark (inverted orange triangles), and algae (green triangles) cluster in clear regions of the plot, with higher C:N values for woody terrestrial material (36–60) and lower values for lake algae (6–12) on a mass basis. Lake algae δ13C values range from −26‰ to −24‰, and sit within the expected window (e.g., Meyers and Lallier-Vergés, Reference Meyers and Lallier-Vergés1999). Aquatic plants (black crosses) are distinguished by lower C:N values (8–17) and very high (heavier) δ13C values (between −19‰ and −13‰). Most of the organic matter (with the exception of rooted aquatic plants and organic-rich lake sediment layers) have δ13C values less than −24‰ (isotopically light). GNP modern plant C:N and δ13C values correspond to expected ranges in published literature (e.g., Meyers and Lallier-Vergés, Reference Meyers and Lallier-Vergés1999).
Organic carbon: total nitrogen mass ratio (C:N) vs. δ13C of modern organic matter. Gray boxes indicate a general distribution of organic matter sources by composition, adapted from Meyers (Reference Meyers1994; figure 1). Symbols show C:N and δ13C values for vegetation collected in the Swiftcurrent Valley within ∼50 m of the lakes in summer 2012. The stems of woody plants (inverted orange triangles) cluster at the highest C:N values. Lake sediments (outlined circles) cluster near aquatic algae (green triangles), with some contribution of terrestrial land plants (black dots). Site 1 (blue dots) has much higher C:N values than the other sites, and rooted aquatic plants (plus symbols) have the highest (isotopically enriched) δ13C values. Flood layers from Site 4 (pink hexagons) are enriched in aquatic rooted plant materials.

Lake sediment samples from sites 2, 3, and 4 (black circles, Fig. 4) cluster in the region between terrestrial plants and algae (−26‰ to −24‰ (δ13C) and 7–18 (C:N)), whereas Site 1 lake sediments (blue dots) have a much greater C:N range (14–39). Two samples derived from visible organic material at Site 4 (pink hexagons) have higher (heavier) δ13C (greater than −20‰) and lower C:N (less than 16) values, closer to known values of rooted aquatic plants in the study area. They were sampled from Site 4 sediment with 210Pb ages of 1996 CE and 1967 CE, within age uncertainties (+/− 5 years) of the 1995 and 1964 CE flood events.
Figure 5 shows organic carbon and nitrogen data at all four sites from ∼1800 CE to the present. Average %TOC values during this temporal window are generally higher with distance downvalley (Fig. 5a), with the lowest %TOC values at Site 1 (∼1.8%) and higher average %TOC at sites 2 (∼3.1%), 3 (∼3.6%), and 4 (∼3.5%). Beginning ∼1970 CE, %TOC is more variable at sites 2–4 than the 100+ years prior. Average %TOC increases at all four sites after ∼1970 CE, with maximum or near-maximum %TOC values after 2000 CE.
Historical change in (a) %TOC, (b) C:N at sites 2, 3 and 4, (c) C:N at site 1, (d) δ13C, (e) %TIC at sites 1 and 2, and (f) δ15N. Site 1 (blue squares) is farthest upvalley in the center of Grinnell Lake, Site 2 (black circles) is near the outlet of Lake Josephine, Site 3 (red open diamonds) is the most downvalley core in Grinnell Valley in the southern subbasin of Swiftcurrent Lake, and Site 4 (light blue triangles) is closest to Park development and infrastructure near the Swiftcurrent outlet where the Grinnell and Swiftcurrent valleys meet. Black hexagons show Site 4 peaks in both C:N and δ13C corresponding with flood events in 1964 and 1995 CE. C:N and δ15N values decrease at all four sites over the period of record, and δ13C increases at all sites compared to nineteenth-century values.

Like %TOC, average C:N values are generally higher at sites downvalley, with higher C:N values at Site 4 compared to sites 3 and 2 (Fig. 5b). Values of C:N at sites 2–4 range from 8 to 19, within the range of modern terrestrial plant, aquatic plant, and aquatic algae found in the area (Fig. 4). The exception is Site 1 (Fig. 5c, note x-axis scaling), which has C:N values averaging two to four times greater than those at other sites prior to ∼1940 CE (Fig. 5c), and spans C:N values up to modern terrestrial stems/bark (Fig. 4). All four sites show an overall decrease in C:N beginning between 1910 and 1970 CE, and reach minimum values after 2000 CE (Fig. 5b,c). Site 1 shows a step-like decrease in C:N values around 1940 CE (Fig. 5c). Values of C:N decline at sites 3 and 4 from ∼1820 to ∼2010 CE, although higher sampling resolution at Site 4 demonstrates greater variability in C:N after ∼1950 CE. C:N values coincident with the 1964 and 1995 CE floods are highlighted (hexagons, Fig. 5b) as exceptions to the trend of decreasing C:N values at Site 4.
Organic carbon isotopic values (Fig. 5d) range from −27‰ to −24‰ at all four sites prior to 1950 CE (Fig. 5d), within the range of all modern vegetation (Fig. 4) except aquatic plants, which have much higher δ13C values. At sites 1–3, carbon isotopic values either remain stable or slightly decrease (become isotopically lighter) after 1910 CE, with modest enrichment at all three sites starting between ∼1970 and ∼1990 CE and continuing to 2010 CE. At downstream Site 4, δ13C values are increasingly enriched beginning ∼1910 CE (the earliest of all the sites), with highly variable δ13C values between ∼1950 and ∼2010 CE. The highest (heaviest) carbon isotopic values at Site 4 (Fig. 5d, hexagons) are coincident (within age uncertainties) with the 1964 and 1995 CE flood events (Fig. 3e); peaks in C:N (Fig. 5b) are correlated with the enriched δ13C values. Even in the absence of these δ13C outliers (which have values close to modern aquatic vegetation, Fig. 4), δ13C is generally higher (more enriched) at Site 4 than at the other sites after ∼1950 CE. Even using the most conservative positive Suess correction (Dombrosky, Reference Dombrosky2020), carbon isotopic values increase (become enriched) at most sites; the increase begins earliest at Site 4 (∼1910 CE when GNP was established), and decades later at the other three sites.
Percent TIC at sites 1 and 2 is shown in Figure 5e; at Site 1 (blue squares) %TIC is zero with the exception of sporadic pulses of ∼2% TIC from 1840 to 1950 CE, and an increase beginning 2000 CE. At Site 2 (black circles), %TIC is between 0.5% and 1.0%, and increases very slightly ∼1960 CE with a rapid rise ∼2000 CE.
Nitrogen isotope values also show clear spatial and temporal patterns (Fig. 5f). At the glacier-proximal Site 1, δ15N ranged from 1.9‰ to 6.3‰, with elevated values (more enriched) during the nineteenth and early twentieth centuries followed by a gradual decline (increasingly lighter) after ∼1900 CE. Site 2 values were generally lower (0.4–4.6‰) and exhibited a smooth downward trend (increasingly depleted) through the last two centuries. Site 3 displayed the strongest depletion, decreasing from 2-3.5‰ in the nineteenth century to near-zero or slightly negative values after 1990 CE. In contrast, Site 4 remained relatively stable, fluctuating between 1‰ and 3‰ with a modest decrease (depletion) ∼1980 CE. Collectively, δ15N values become isotopically lighter both downvalley and over time.
Discussion
Mass accumulation rates
The CRS model used to determine MAR assumes that unsupported 210Pb of the initial activity (at depth) will be inversely proportional to the MAR (Appleby, Reference Appleby2008; Baud et al., Reference Baud, Jenny, Francus and Gregory-Eaves2021). Unsupported 210Pb activity in a CRS model with steady sedimentation would appear as an exponential decay in 210Pb with depth; excursions from this model imply changing deposition rate over time, extensive bioturbation, or erosion of sediment from the lake bed (Appleby and Oldfield, Reference Appleby and Oldfield1978; Appleby, Reference Appleby, Last and Smol2001). Notably the unsupported activity at all four sites (Fig. 2a,d,g,j) shows deviation from a smooth exponential curve. At Site 1, there is a significant deviation from this exponential curve (Fig. 2a), but the variability between individual samples is smooth. There was no coarse sediment (sand) identified in the core, although samples taken from an adjacent longer core showed extensive sandy units and dropstones in lower (older) sections. The sedimentological evidence, coupled with the water depth and smoothly varying 210Pb curve make it likely that MAR variability is due to geomorphic and/or hydrologic variability in sediment delivery to the site. Unsupported 210Pb at Site 2 is almost a straight line (2d) with variability from 3–5 cm (∼1970–1995 CE; Fig. 2e), with the youngest excursion correlated with a high flow event in the valley. Sites 3 and 4 have unsupported 210Pb curves that are relatively close to exponential decay with notable excursions near ∼10 cm at Site 3 (Fig. 2g) and ∼5 cm at Site 4 (Fig. 2j). Single sample decreases (excursions) in unsupported 210Pb could result from either minor erosion events or an increase in sedimentation rate; while it is possible that high flow events caused erosion (or non-deposition) at the lake bed, the relatively deep sampling sites suggests the excursions are related to increased sedimentation. We argue that variability in MAR at all four sites is related to variability in sediment delivery to, and deposition in, the lakes.
The highest overall MAR values occurred at Site 1, closest to Grinnell Glacier; MAR was quite stable until a rapid increase at the end of the twentieth century. At sites 2–4, MAR increased dramatically over pre-1850s values, beginning ∼1900 CE. Although the Site 4 drainage basin area is twice that of Site 3, since it includes runoff from Swiftcurrent Valley, the average MAR values at Site 4 are only ∼20–50% greater. Site 4 also shows a notable increase in MAR ∼1950 CE, coincident with an abrupt rise in GNP visitation (Fig. 3f) as well as the The Great Acceleration (Steffen et al., Reference Steffen, Broadgate, Deutch, Gaffney and Ludwig2015). Despite the fact that the catchments are alpine/subalpine and have had national park land use protections for more than a century, the overall increase in MAR in eastern GNP is consistent with other observations of increasing MAR in lakes globally. Dearing and Jones (Reference Dearing and Jones2003) found that in the twentieth century, land-use impacts exerted a stronger control on lake sedimentation globally than climate impacts for small catchments (< 103 km2) and that the magnitude of sedimentation increase was typically 5–10 times higher than pre-disturbance rates. Schiefer et al. (Reference Schiefer, Petticrew, Immell, Hassan and Sonderegger2013) observed that increases in lake sedimentation rates in western Canada in the last century were primarily associated with greater land-use intensities (particularly road density in watersheds), and secondarily tied to catchment warming. In GNP, development in the upvalley portion of Grinnell Valley (e.g., sites 1 and 2) is limited to trails and simple wooden structures like docks and sheltered benches, with more extensive infrastructure in Swiftcurrent Valley near sites 3 and 4 (trails, paved and unpaved roads and parking lots, automobile-accessible boat launch, hotels, waste treatment). The relative decrease in new Park development after 1960 CE (Architectural Research Consultants, 2002) is correlated with a trend in decreasing MAR at Site 4 after ∼1964 CE; despite this, modern MAR values are higher at all four sites than they were for the previous century. Our observations suggest that even in alpine and subalpine watersheds in national parks with limited infrastructure and only seasonal visitation, sedimentation rates can still be up to five times higher than those prior to Euro-American activity, likely a result of both human activity and climate change.
Grinnell Glacier retreat
Grinnell Glacier has been in retreat (lost just over 70% of its surface area) since its LIA maximum extent between ∼1850 and ∼2015 CE (Fagre et al., Reference Fagre, McKeon, Dick and Fountain2017; Martin-Mikle and Fagre, Reference Martin-Mikle and Fagre2019). Subglacial sediment discharge generally increases as glaciers retreat (e.g., Koppes and Hallet, Reference Koppes and Hallet2002; Delaney and Adhikari, Reference Delaney and Adhikari2020), while studies of meltwater flux during glacier retreat are mixed, in some cases increasing due to melting ice and decreasing in cases with diminished snow cover (e.g., Frenierre and Mark, Reference Frenierre and Mark2014). Given the drainage patterns that include multiple lakes downstream from Grinnell Glacier, the recorded patterns of glacial retreat in the studied cores are complex.
Site 1 has the greatest overall MAR values in Grinnell Valley (∼0.1 g/cm2 yr from ∼1850 to ∼2000 CE), almost certainly a result of proximity to Grinnell Glacier sediment sourcing via an outlet stream and the steep valley walls surrounding much of the lake. However, MAR at Site 1 decreased slightly in the early twentieth century, tied to the appearance and growth of the proglacial Upper Grinnell Lake, which first appeared as a small pond in the mid-1920s (Johnson, Reference Johnson1980). Upper Grinnell Lake grew from 3.4 acres in 1934 CE, to 14.8 acres (1948 CE), to 20.8 acres (1950 CE) to 31.3 acres (1967 CE), increasing in surface area 10-fold in ∼30 years (Johnson, Reference Johnson1980). Drainage patterns from the lake also changed, most notably with historical observations that showed “a sudden 8-foot drop of [Upper Grinnell] lake level occurred in August 1957, when some undetermined change in configuration of the glacier’s underside shifted the direction of major melt-water drainage. After the sudden drop in lake level, there was no longer any direct drainage from the lake; major runoff of melt water bypassed the lake and followed the Grinnell Creek….” (Johnson, Reference Johnson1980). This observation suggests that the combination of growth of Upper Grinnell Lake (acting as a sediment sink between Grinnell Glacier and Site 1) and a shifting glacier meltwater drainage was responsible for the slight MAR decline at Site 1 during the mid-twentieth century. In contrast, the rapid increase in MAR observed at Site 1 after ∼1990 CE cannot be attributed to a reduction in Upper Grinnell Lake, and there is no record of a shifting glacial outlet stream site. Increased hydrologic energy, human impacts from increased visitor foot-traffic, and/or enhanced glacial sediment production may be responsible for the peak in MAR during this time.
Sediment trapping by Upper Grinnell Lake until the mid-1900s CE and subsequent increases in sediment and/or water flux after ∼1990s CE is supported by the %TIC record at Site 1 (Fig. 5e). Carbonate rocks are found almost exclusively at the head of Grinnell and Swiftcurrent Valleys at an elevation of ∼1600 m and above (Whipple, Reference Whipple1992), making it likely that glacial processes are the primary driver of detrital carbonate in the lake cores. Percent TIC shows sporadic carbonate presence at Site 1 between ∼1850 and ∼1940 CE (Fig. 5e), during the period when Grinnell Glacier filled all or most of its cirque basin and had direct proglacial fluvial connection to Grinnell Lake. Once Upper Grinnell Lake increased in size, %TIC decreased to zero until an increase ∼2000 CE (Fig. 5e). Models of meltwater production and sediment transport through the proglacial lake and stream system could shed light on the inferred response of MAR and %TIC at sites 1 and 2 to Grinnell Glacier retreat during the nineteenth and twentieth century.
None of the sites clearly record the expected increase in MAR as a result of Grinnell Glacier retreat post LIA (∼1850 CE); any slug of sediment produced during ice retreat would likely cause increased sedimentation rates at the upvalley sites first, and move downvalley over time (even with the appearance of Upper Grinnell Lake). This is in direct contrast to our observations of MAR increases occurring at the downvalley lakes (sites 2–4) first (Fig. 3). Although it is possible that MAR in the lakes responded to Grinnell Glacier retreat from its last glacial maximum (LGM) position – previous work from a longer core near Site 3 suggests %TIC is tied to glacier proximity during the LGM retreat and Younger Dryas (Schachtman et al., Reference Schachtman, MacGregor, Myrbo, Hencir, Riihimaki, Thole and Bradtmiller2015) and another study in GNP shows a link between glacier position and carbonate presence in sediment cores (Munroe et al., Reference Munroe, Crocker, Giesche, Rahlson, Duran, Bigl and Laabs2012) – in this study, the presence of upvalley lakes confounds sediment transport and deposition from a retreating glacier. Wolfe et al. (Reference Wolfe, Hobbs, Birks, Briner, Holmgren, Ingólfsson and Kaushal2013) showed that in remote alpine and arctic lakes in the northern hemisphere, the retreat of glaciers commonly leads to lake sedimentation moving from proglacial clastic sedimentation to non-glacial organic deposition. This is similar to our observations in all three lakes, although complicated by the appearance and growth of Upper Grinnell Lake during this time.
Twentieth-century change and impacts of The Great Acceleration
A notable increase in MAR magnitude ∼1900 CE at sites 2–4 are correlated with the establishment of GNP, and slightly earlier than global observations of The Great Acceleration (e.g., Brothers et al., Reference Brothers, Vermaire and Gregory-Eaves2008; Osleger et al., Reference Osleger, Zierenberg, Suchanek, Stoner, Morgan and Adam2008; Bookman et al., Reference Bookman, Driscoll, Effler and Engstrom2010; Steffen et al., Reference Steffen, Broadgate, Deutch, Gaffney and Ludwig2015; Baud et al., Reference Baud, Jenny, Francus and Gregory-Eaves2021). Another signature of changing environmental conditions in GNP is the trend of decreasing C:N, depleted δ15N and enriched δ13C values in sediment from all lakes in Grinnell Valley during the mid-twentieth century. Based on analysis of modern terrestrial vegetation and aquatic rooted plants and algae (Fig. 4), the only scenario consistent with available organic matter sources is proportionally more algal organic carbon sourcing in all lakes toward the present. Only Site 3 shows isotopically lighter δ13C values since GNP was established, and those changes are slight and values have increased (become enriched) over the last few decades (Fig. 5d).
Visitation data for GNP broadly show a dramatic increase in visitors at the start of The Great Acceleration, increasing from ∼480,000/year in 1950 CE to ∼3.2 million in 2024 CE; car traffic for the Many Glacier area shows a four-fold increase between 1998 and 2024 CE (National Park Service, 2025). Increased turbidity due to road and trail use/maintenance or tour boat traffic, and nutrient-driven increases in algal density may have inhibited rooted macrophyte growth, leading to a further increase in nutrient availability due to macrophyte senescence and reduced coverage, and a further shift toward algal dominance (“alternative stable states” of Blindow et al., Reference Blindow, Andersson, Hargeby and Johansson1993). Increased visitation and more intensive land use can also bring nutrients into the watershed (e.g., Engstrom et al., Reference Engstrom, Balogh and Swain2007; Myrbo, Reference Myrbo2008). Algal populations may be altered as a result of rising glacial meltwater inputs (Slemmons et al., Reference Slemmons, Saros, Stone, McGowan, Hess and Cahl2015), impacting C:N and δ13C values. Finally, rising water temperatures in the lakes due to increased summer and/or annual average air temperatures could also increase algal biomass (Butterwick et al., Reference Butterwick, Heaney and Talling2005; Salmaso et al., Reference Salmaso, Buzzi, Garibaldi, Morabito and Simona2012; Kuefner et al., Reference Kuefner, Hofmann, Geist, Dubois and Raeder2021). It is difficult to discern a clear spatial trend in the timing of shifting carbon sources across the valley, with decreasing C:N, enriched δ13C, and increasing %TOC values beginning anywhere from 1910 to the 1980s CE (Fig. 5). This suggests a combination of climate change and land use/human activity are responsible for the trend of increasing algal contributions (and increased proportion of organic carbon) to the lakes in eastern GNP. We note that Site 4, closest to and downstream of the most intensive Park infrastructure, shows a trend of decreasing C:N and enriched δ13C beginning ∼1910 CE when GNP was established. Importantly, all sites remain on a trajectory of increasing algal organic carbon deposition. Concerted management efforts may be required to control further degradation or even to return lakes to their “baseline” or earlier states; previous studies (e.g., Hausmann et al., Reference Hausmann, Lotter, Van Leeuwen, Ohlendorf, Lemcke, Grönlund and Sturm2002; Ekdahl et al., Reference Ekdahl, Teranes, Wittkop, Stoermer, Reavie and Smol2007) show that such remediation is slow.
The trend of decreasing (depleted) δ15N values in lakes progressively downvalley from glacial melt is not unexpected; glacier-proximal sediments typically exhibit heavier δ15N values due to the dominance of mineral and soil-derived nitrogen from recently deglaciated terrain, while downstream or distal basins often record more depleted δ15N values reflecting increased in-lake primary production and uptake of isotopically light atmospheric nitrogen (Engstrom et al., Reference Engstrom, Fritz, Almendinger and Juggins2000; Wolfe et al., Reference Wolfe, Baron and Cornett2001; Slemmons and Saros, Reference Slemmons and Saros2012; Slemmons et al., Reference Slemmons, Saros and Simon2013). In addition, glacier melt can enrich runoff with dissolved inorganic nitrogen (Baron et al., Reference Baron, Schmidt and Hartman2009; Saros et al., Reference Saros, Rose, Clow, Stephens, Nurse, Arnett, Stone, Williamson and Wolfe2010; Fegel et al., Reference Fegel, Baron, Fountain, Johnson and Hall2016), providing a nitrogen subsidy (e.g., Slemmons and Saros, Reference Slemmons and Saros2012; Slemmons et al., Reference Slemmons, Rodgers, Stone and Saros2017), likely impacting δ15N. We suggest the observed spatial gradient in δ15N is related to both increasing dilution of ice-derived runoff downvalley, as well as increased primary productivity (observed in the δ13C records) downvalley.
The temporal trend of decreasing (depleted) δ15N toward the present aligns with global records, and could be a result of atmospheric reactive nitrogen deposition, increasing land disturbance and changing organic carbon sourcing in the twentieth century (e.g., Wolfe et al., Reference Wolfe, Van Gorp and Baron2003; Holtgrieve et al., Reference Holtgrieve, Schindler, Hobbs, Leavitt, Ward, Bunting and Chen2011; Gąsiorowski and Sienkiewicz, Reference Gąsiorowski and Sienkiewicz2013; North, Reference North2013; Zhou et al., Reference Zhou, Wei, Sheng, Liu, Yu and Lan2024), as well as regional climate warming increasing glacially produced runoff and in-lake productivity (Burpee and Saros, Reference Burpee and Saros2020). Similar depletion of δ15N has been documented in alpine and arctic lakes where warming lengthens the ice-free season and promotes stronger internal nitrogen cycling (Lehmann et al., Reference Lehmann, Bernasconi, McKenzie, Barbieri, Simona and Veronesi2004; Wurtsbaugh et al., Reference Wurtsbaugh, Paerl and Dodds2019). The nitrogen isotopic record in these lakes supports our interpretation of a biogeochemical system impacted by myriad local to global drivers of environmental change.
Together, the MAR, %TOC, C:N, δ13C, and δ15N data in GNP document a coherent shift from a system dominated by clastic terrestrial inputs to a more biologically productive, internally cycled organic carbon system in the twentieth century. The timing of these changes (increasing MAR, isotopically lighter δ15N) is broadly aligned with the establishment of GNP in 1910 CE, with some changes (i.e., C:N and δ13C) tied more closely to The Great Acceleration ∼1950 CE. These patterns underscore the sensitivity of proglacial lake biogeochemistry to glacier retreat, climate-driven changes in productivity and nutrient dynamics, and local patterns of human activity.
Flooding
The 1964 and 1995 CE floods produced a MAR peak at sites 3 and 4 (Fig. 3c,d), and an influx of high C:N/heavy δ13C organic carbon material at Site 4 (Fig. 5b,d, hexagons). Spikes in both δ13C and C:N during high discharge events demonstrate flooding brings a different source of organic matter into Swiftcurrent Lake; analysis of modern algal and terrestrial plant tissue in the drainage (Fig. 4) indicate that the source of the heavy-δ13C, high-C:N organic matter spikes are a combination of terrestrial plant material (relatively high C:N; e.g., Meyers and Lallier-Vergés, Reference Meyers and Lallier-Vergés1999) and an increase in the contribution of aquatic rooted plants (since all other modern organic sources of δ13C peak at −24‰). There is no single organic carbon source in the basin with both of these characteristics, but a mixing line between the components provides organic matter with the appropriate values (δ13C = −22‰, C:N = 16, Fig. 4). Both of these organic matter types would be expected in organic debris mobilized by a floodwater pulse in shallow segments of the lake and redeposited. Coincident small dips in %TOC during the flood events are likely the result of its dilution by larger fluxes of local siliciclastic material (Fig. 5a). Site 3 has a MAR peak coincident with the 1964 CE flood event, but shows no changes in organic carbon sourcing; this suggests the organic carbon source at Site 4 flooding originates in Swiftcurrent Valley rather than Grinnell Valley. The Swiftcurrent Valley’s chain of smaller (and in many cases, shallower) lakes may be ineffective as sediment sinks compared to the deeper lakes in Grinnell Valley; the effects of development in the lower Swiftcurrent Valley around Site 4 (gravel and paved roads, impervious roofs, parking lots, trails, etc.) may increase the transport of sediment and organic matter during spring snowmelt flood events. It is unclear why not all high discharge events (Fig. 3e, red dots) produce MAR or high C:N/heavy δ13C peaks, but could be related to the flow and sediment entrainment dynamics of input streams as well as lake hydrodynamics. Close correlation of at least two high discharge events and organic carbon sourcing at Site 4 demonstrates that flood events after 1950 CE have an impact on Swiftcurrent Lake sedimentation.
Conclusions
Our multi-proxy analysis of lake sediment cores from the Grinnell and Swiftcurrent valleys of Glacier National Park demonstrates that alpine lake systems are highly sensitive to the combined effects of glacier retreat, climate change, and human activity. Across all sites, we observe a three- to five-fold increase in mass accumulation rates over the past ∼150 years, with increases generally most pronounced downvalley, near areas of greater human infrastructure and visitation. Organic geochemical proxies indicate a gradual shift from terrestrially dominated organic matter to greater contributions from algal and aquatic plant sources, reflected in decreasing C:N ratios and increasing (isotopically enriched) δ13C values. Concurrent depletion in δ15N suggests enhanced in-lake nitrogen cycling, increased influence of isotopically light atmospheric deposition, and/or greater aquatic productivity, particularly at sites farther from the glacier. Notably, sedimentary records do not show a simple increasing MAR response to Grinnell Glacier retreat post-LIA (∼1850 CE; Martin-Mikle and Fagre, Reference Martin-Mikle and Fagre2019), likely due to sediment trapping in upstream lakes and the complex routing of meltwater, highlighting the role of intermediate lakes in modulating downstream sedimentation. Flood events, such as those in 1964 and 1995 CE, leave signatures in MAR, C:N, and δ13C at downvalley Swiftcurrent Lake, illustrating how episodic hydrologic disturbances can shape sediment delivery and organic matter composition. The timing of observed MAR and biogeochemical shifts – beginning around the establishment of the Park (∼1910 CE) and enhanced at the start of The Great Acceleration ∼1950 CE – underscores the cumulative impacts of even modest local land use in combination with global environmental drivers. Collectively these findings emphasize that proglacial lake sediments provide a sensitive archive of both natural and anthropogenic change, capturing the evolving connectivity between glaciers, catchments, lakes, and human activity. Understanding these patterns not only informs the management and preservation of Glacier National Park’s subalpine ecosystems but also provides a broader template for interpreting sedimentary and biogeochemical responses to climate and land-use change in other remote mountain landscapes worldwide.
Supplementary material
The supplementary material for this article can be found at https://doi.org/10.1017/qua.2026.10072.
Acknowledgments
The authors thank the Keck Geology Consortium (NSF EAR Grants 0949962, 1659322, 2050697), Macalester College, and Franklin & Marshall College for funding. Field work conducted with the support of K. Brady and the Continental Scientific Drilling facility (CSD), as well as Dr. L. Bradmiller, Dr. K. Lawrence, H. Bourne, J. Griffith, J. Kutvirt, E. Locatelli, S. Matteson, C. Simcoe, (2010) and L. Andrews, N. Hencir, and N. Schachtman (2012). We appreciate the analytical support and guidance provided by Dr. L. Bradtmiller (Macalester College), Dr. A. Haveles (University of Minnesota) and Dr. K. Theissen (University of St. Thomas). We also thank S. Matteson and K. Dennis for their coulometric analytical assistance. Cores processed and archived at the CSD, University of Minnesota, including extensive assistance provided by facility staff. We are grateful to the Glacier National Park staff for their assistance and support with research permitting (including T. Carolin), and the Many Glacier Rangers and Interpretive staff (particularly D. Sine) for their interest in, enthusiasm for, and support of ongoing scientific research and sharing our work with the public. We thank the anonymous reviewers for insightful comments that greatly improved the manuscript. Data used in the writing of this manuscript are located on the Neotoma Explorer Database (https://apps.neotomadb.org/explorer/).