


Introduction
Obesity, which arises from an irregular balance between caloric intake and energy expenditure, constitutes a global socioeconomic health burden that has reached epidemic proportions worldwide.Reference Li, Hu, Zhang, Wang, Ji and Manza1, Reference Matiashova, Hoogkamer and Timper2 It is a significant risk factor for chronic non-communicable diseases such as cardiovascular diseases, type II diabetes, fatty liver disease and cancer, contributing to increased disease burden, mortality rates and healthcare costs.Reference Li, Hu, Zhang, Wang, Ji and Manza1–Reference Blüher3
Obesity is often linked to psychological issues and social challenges, with affected individuals frequently facing discrimination and stigma in various environments, both of which can negatively impact mental well-being.Reference Ma, Ajnakina, Steptoe and Cadar4–Reference Anstey, Cherbuin, Budge and Young6 Despite extensive research into underlying mechanisms and potential treatments, the rates of overweight and obesity – defined by a body mass index (BMI) of 25–29.9 kg/m2 and over 30 kg/m2, respectively – have nearly tripled over the past four decades. Current estimates indicate that 39 per cent of the population are overweight, while 13 per cent would be classified as obeseReference Timper and Brüning7.
Neural responses to food-related taste and smell differ between individuals with obesity and those of normal weight. In comparison with lean participants, when exposed to a glucose/fructose/milkshake versus a tasteless solution, obese participants exhibited stronger activation in the pre-motor regions, ‘superior parietal lobule (SPL)’ and ‘visual cortex’ within the dorsal attention network, as well as in the ‘medial pre-frontal cortex (MPFC), supplementary motor area (SMA), precuneus/PCC, middle temporal gyrus (MTG), striatum, gustatory area (anterior insula and frontal operculum) and somatosensory cortex comprising the mouth area’, along with a heightened ‘amygdala–ventromedial pre-frontal cortex (AMY–VMPFC) connectivity’. Conversely, reduced activation was observed in the AMY, hippocampus (HIPP) and hypothalamus, which are involved with feeding regulation, and in the VMPFC and ventrolateral pre-frontal cortex (VLPFC)’.Reference Bohon8–Reference Jastreboff, Sinha, Arora, Giannini, Kubat and Malik14
The role of the sense of smell extends beyond mere sensory perception and is deeply intertwined with hypothalamic function. Hunger enhances olfactory acuity, whereas satiety reduces it, indicating a reciprocal relationship between food intake and olfactory sensitivity.Reference Li, Hu, Zhang, Wang, Ji and Manza1–Reference Blüher3 This study aimed to determine the effects of being overweight and obese on central and peripheral olfactory pathways using MRI.
This study is novel in that it simultaneously evaluates both peripheral and central olfactory structures using MRI and investigates their relationship with BMI across three distinct groups.
Materials and Methods
This retrospective study was conducted at the Department of Radiology, Faculty of Medicine, Gaziantep University and Kırıkkale University, Medical Faculty, Department of Otolaryngology. Approval was obtained from the Gaziantep University Clinical Research Ethics Committee (Decision No: 2025/165, Date: 18 June 2025), and the study was carried out in accordance with the Declaration of Helsinki principles.
Patient selection
The cranial MRI images of 80 patients aged between 18 and 65 years old, who were either overweight (40 patients) or obese (40 patients) according to the body mass indices (BMI)Reference Flegal, Kit and Graubard15 scores, were retrieved from the hospital Picture Archiving and Communication System (PACS) of Gaziantep University, Medical Faculty, Radiology Department between 30 June 2025 and 1 January 2024. Cranial MRI was performed for headache evaluation.
The control group consisted of cranial MRI images of 40 healthy adults aged between 18 and 65 years old who had a normal BMI score and normal cranial MRI results. The age-matched control participants were selected from a PACS system screening from 30 June 2025 to 1 January 2024. The reason for performing MRI in the control group was mainly the investigation of headaches. Inclusion criteria were: (1) availability of high-quality cranial MRI, including coronal T2-weighted and axial T1-weighted sequences, suitable for olfactory system assessment; and (2) normal cranial MRI findings in the radiology report. Exclusion criteria were: (1) known central nervous system disease; (2) history of cranial trauma or neurosurgery; (3) presence of sinonasal polyps or tumours; (4) significant nasal septal deviation or facial deformity; (5) demyelinating or degenerative brain disorders; (6) cerebrovascular or cardiovascular disease; and (7) congenital or structural brain anomalies affecting measurement regions.
Demographic data and BMI values were obtained from hospital records. Power analysis was performed using GPower 3.1 software to detect a moderate effect size (Cohen’s d = 0.5) between groups, with a statistical power of 80 per cent (1− β = 0.80) and a significance level of α = 0.05. The minimum required sample size was calculated as 37 participants per group. In total, 74 patients were included.
Body mass index classification
Body mass index was calculated using the formula: weight (kg)/height2 (m2). Based on the World Health Organization criteria, participants were categorised asReference Flegal, Kit and Graubard15: (1) normal weight: 18.5–24.9 kg/m2; (2) overweight: 25–29.9 kg/m2; or (3) obese: ≥ 30 kg/m2.
Study design
For the purposes of this study, three groups were formed: normal weight (Group 1), overweight (Group 2) and obese (Group 3). Each group included 40 individuals.
MRI protocol
All MRI examinations were performed using a cranial coil on a 3.0 Tesla (T) MRI system (Ingenia, Philips Healthcare, Best, the Netherlands). Standard cranial MRI sequences were obtained and additional high-resolution coronal and axial images were used for evaluation of the olfactory pathways.
Axial T1-FFE (Fast Field Echo): TR/TE: 330/20 milliseconds, flip angle: 80°, FOV: 230 × 130 mm, matrix: 256 × 139, slice thickness: 4 mm and intersection gap: 0.5 mm. In total, 30–32 contiguous axial and sagittal sections were obtained. These sequences were used for insular gyrus and corpus amygdala area measurements.
Coronal T2-TSE (Turbo Spin Echo): TR/TE: 4040/80 milliseconds, echo train length: 15, FOV: 200 × 152 mm, matrix: 288 × 163, slice thickness: 4 mm and intersection gap: 0.5 mm. In total, 34 contiguous coronal sections were acquired. These sequences were used for olfactory bulb (OB) volume and olfactory sulcus (OS) depth measurements.
Measurement techniques
Measurements were performed by a single radiologist (M.H.Ş.) blinded to BMI status.
Peripheral olfactory structures
Olfactory bulb volume
Volume was measured on coronal T2-weighted images from anterior to posterior. The cross-sectional surface area (mm2) was manually traced and volume (mm3) was calculated by multiplying the sum of slice thickness and intersection gap by the measured areaReference Kandemir, Muluk, Melikoglu, Dag, Inal and Sarin16–Reference Hastings, Parsey, Oquendo, Arango and Mann20 (Figure 1).
Measurement of olfactory bulb volume on coronal T2-weighted MRI. The olfactory bulb is manually outlined, and volume is calculated from sequential slices.

Olfactory sulcus depth
Depth was measured on coronal T2-weighted images, a virtual tangent line was drawn from the inferior orbital gyrus to the gyrus rectus, posterior to the orbital roof. A perpendicular line from this tangent to the deepest point of the OS was measured in millimetresReference Kandemir, Muluk, Melikoglu, Dag, Inal and Sarin16–Reference Hastings, Parsey, Oquendo, Arango and Mann20 (Figure 2).
Measurement of olfactory sulcus depth on coronal T2-weighted MRI. Yellow arrow indicates the perpendicular line drawn from the orbital gyrus tangent to the deepest point of the sulcus.

Central olfactory structures
Insular gyrus area
Area was measured on axial T1-weighted images at the level at which both the head of the caudate nucleus and the putamen were visible, selecting the section showing maximal insular dimensionsReference Kandemir, Muluk, Melikoglu, Dag, Inal and Sarin16, Reference Şencan, Bayar Muluk and Şahan17, Reference Hastings, Parsey, Oquendo, Arango and Mann20 (Figure 3).
Measurement of insular gyrus area on axial T1-weighted MRI at the level showing maximal dimensions, in which the head of the caudate nucleus and putamen are visible.

Corpus amygdala area
Area was measured on axial T1-weighted images at the section showing the maximal areaReference Kandemir, Muluk, Melikoglu, Dag, Inal and Sarin16, Reference Şencan, Bayar Muluk and Şahan17, Reference Hastings, Parsey, Oquendo, Arango and Mann20 (Figure 4).
Measurement of corpus amygdala area on axial T1-weighted MRI at the section showing the maximal cross-sectional area.

Statistical analysis
Power analyses were performed using the Gpower3.1 program. Version 21.0 of the Statistical Package for the Social Sciences (SPSS) (SPSS Inc., IBM, Chicago, Illinois) software was used for the analysis. A chi-square test, one-way ANOVA, paired samples t-test, Pearson correlation test and Spearman’s correlation rho efficient test were used.
For pairwise comparisons, the Tukey test with Bonferroni adjustment was used. A p-value < 0.05 was considered statistically significant. An a djusted value < 0.0175 was considered statistically significant.
Results
There were 21 men (52.5 per cent) and 19 women (47.5 per cent) in Group 1, 20 men (50.0 per cent) and 20 women (50.0 per cent) in Group 2, and 19 men (47.5 per cent) and 21 women (52.5 per cent) in Group 3 (p = 0.905, χ2: 0.200). There were no significant differences between the ages of the groups (p > 0.05) (Table 1).
Measurement results for the peripheric and central smell regions in Groups 1–3

Table 1 Long description
Three groups of 40 participants each are compared using mean, median, and standard deviation for age, body mass index, and measurements in peripheric and central smell regions, with p star values and a pairwise comparisons column. Age is similar across groups, with means 39.43 in Group 1, 39.48 in Group 2, and 40.98 in Group 3, with p star 0.821 and no pairwise comparisons listed. Body mass index increases from Group 1 mean 21.87 to Group 2 mean 26.84 to Group 3 mean 31.62, with p star 0.000 and pairwise comparisons listed as 1:2, 1:3, and 2:3. For olfactory bulb volume in cubic millimeters, right side means are 37.57 in Group 1, 35.34 in Group 2, and 33.65 in Group 3, with p star 0.000 and pairwise comparisons 1:2 and 1:3; left side means are 37.52, 35.64, and 33.75, with p star 0.000 and pairwise comparison 1:3. For olfactory sulcus depth in millimeters, right side means are 6.90, 6.83, and 6.37 with p star 0.026 and no pairwise comparisons listed, and left side means are 6.85, 6.52, and 6.31 with p star 0.048 and no pairwise comparisons listed. For insular gyrus area in square millimeters, right side means are 382.50, 377.99, and 362.37 with p star 0.012 and pairwise comparison 1:3, and left side means are 380.49, 374.60, and 359.93 with p star 0.004 and pairwise comparison 1:3. For corpus amygdala area in square millimeters, right side means are 113.26, 106.77, and 105.52 with p star 0.004 and pairwise comparison 1:3, and left side means are 113.23, 109.50, and 106.68 with p star 0.025 and no pairwise comparisons listed.
* p-value shows the results of the one-way ANOVA.
** p-value shows the results of the Tukey test with Bonferroni correction. p adjusted values < 0.0175 were statistically significant and statistically significant values were presented here.
*** p-value shows the results of the paired samples t-test.
The means and ranges of the BMI values for the groups were 21.87 ± 1.92 kg/m2 in Group 1 (Control), 26.84 ± 1.32 kg/m2 in Group 2 (Overweight group), and 31.62 ± 1.48 kg/m2 in Group 3 (Obese group) (Table 1). Measurement results for the peripheral and central smell regions for all groups are shown in Table 1.
Olfactory bulb volume
On the right side, the mean OB volumes of the overweight group and the obese group were significantly lower than that in the control group (p adjusted < 0.0175). On the left side, the mean OB volume of the obese group was significantly lower than that in the control group (p adjusted < 0.0175) (Table 1). OB volumes were 37.57 ± 3.36 mm3 and 37.52 ± 3.27 mm3 (Control group), 35.34 ± 3.24 mm3 and 35.64 ± 3.83 mm3 (Overweight group), and 33.65 ± 2.33 mm3 and 33.75 ± 2.85 mm3 (Obese group) on the right and left sides, respectively.
Olfactory sulcus depth
The difference between the OS depth of the groups was found to be statistically significant for both sides (p < 0.05). However, pairwise comparisons showed no significant difference between groups (p adjusted > 0.0175) (Table 1). OS depths were 6.90 ± 1.11 mm and 6.85 ± 1.05 mm (Control group), 6.83 ± 0.89 mm and 6.52 ± 0.92 mm (Overweight group), and 6.37 ± 0.78 mm and 6.31 ± 0.91 mm (Obese group) on the right and left sides, respectively.
Insular gyrus area
On both sides, the mean insular gyrus area of the obese group was significantly lower than that in the control group (p adjusted < 0.0175) (Table 1). Insular gyrus areas were 382.50 ± 32.66 mm2 and 380.49 ± 28.20 mm2 (Control group), 377.99 ± 31.31 mm2 and 374.60 ± 31.11 mm2 (Overweight group), and 362.37 ± 29.76 mm2 and 359.93 ± 24.06 mm2 (Obese group) on the right and left sides, respectively.
Corpus amygdala area
On the right side, the mean corpus amygdala area of the obese group was significantly lower than that in the control group (p adjusted < 0.0175) (Table 1). Corpus amygdala areas were 113.26 ± 10.68 mm2 and 113.23 ± 9.21 mm2 (Control group), 106.77 ± 11.78 mm2 and 109.50 ± 12.00 mm2 (Overweight group), and 105.52 ± 10.21 mm2 and 106.68 ± 10.47 mm2 (Obese group) on the right and left sides, respectively.
Correlation test results
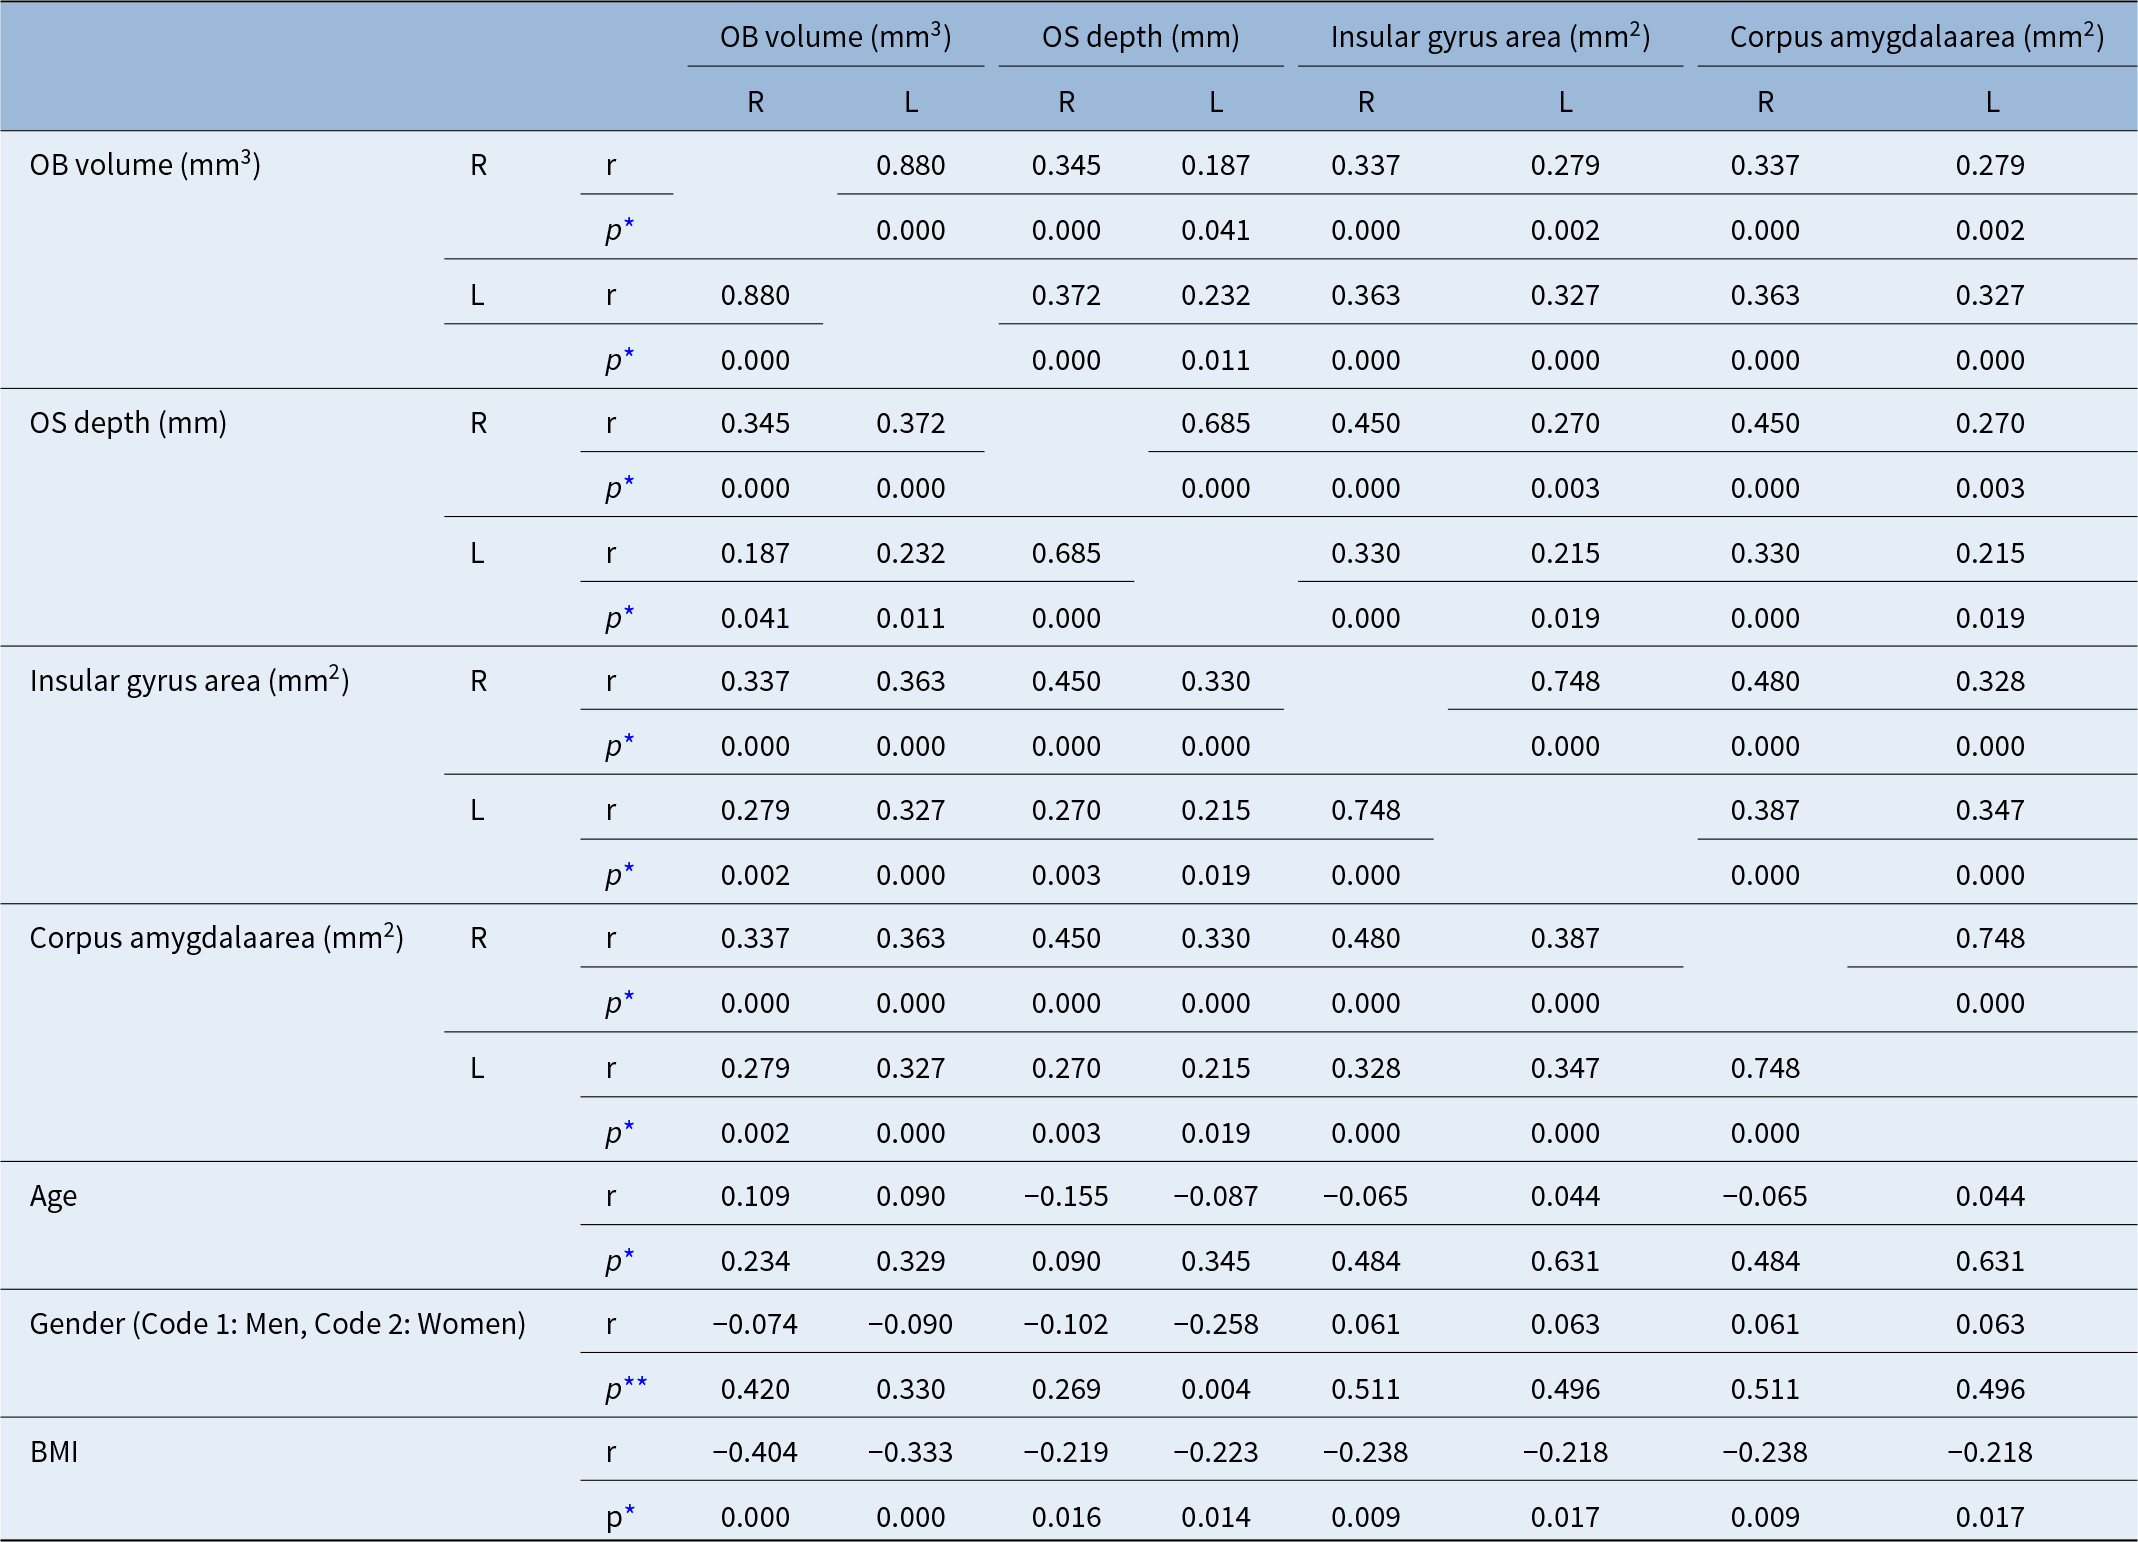
Table 2 presents the correlation test results in all groups. There were positive correlations between OB volumes, OS depths, insular gyrus areas and corpus amygdala areas bilaterally (p < 0.05) (Table 2). In women, OS depths were significantly lower than those in the men (p < 0.05) (Table 2). As BMI increased, OB volumes, OS depths, insular gyrus areas and corpus amygdala areas decreased bilaterally (p < 0.05) (Table 2). No significant correlations were found between age and the measurement values of the central and peripheral smell regions (p > 0.05) (Table 2).
Correlation test results in all Groups 1–3

Table 2 Long description
Correlation coefficients r and p values are listed for OB volume in cubic millimeters, OS depth in millimeters, insular gyrus area in square millimeters, and corpus amygdala area in square millimeters, each split into right and left. OB volume right with OS depth right has r 0.345 and p 0.000, and with OS depth left has r 0.187 and p 0.041; OB volume left with OS depth right has r 0.372 and p 0.000, and with OS depth left has r 0.232 and p 0.011. OS depth right with OS depth left has r 0.685 and p 0.000. Insular gyrus area right with insular gyrus area left has r 0.748 and p 0.000, and corpus amygdala area right with corpus amygdala area left has r 0.748 and p 0.000. Insular gyrus area right with corpus amygdala area right has r 0.480 and p 0.000, and insular gyrus area left with corpus amygdala area left has r 0.347 and p 0.000. Age correlations are listed for OB volume, OS depth, insular gyrus area, and corpus amygdala area, with r values from minus 0.155 to 0.109 and p values from 0.090 to 0.631. Gender coded 1 for men and 2 for women has r values from minus 0.258 to 0.063, with p values including 0.004 for OS depth left and 0.269 to 0.511 for the other entries. BMI has negative r values for all listed measures, from minus 0.404 to minus 0.218, with p values 0.000 to 0.017.
* p-value shows the results of the Pearson’s correlation test.
** p-value shows the results of the Spearman’s correlation rho efficient test.
OB = Olfactory bulb; OS = Olfactory sulcus.
Discussion
Obesity impacts individuals across all age groups and demographic categoriesReference Ralston, Brinsden, Buse, Candeias, Caterson and Hassell21 and elevates the likelihood of developing various conditions such as type II diabetes, cardiovascular diseases and certain cancers. It is also recognised as a contributing factor to dementias, including Alzheimer’s disease.Reference Ma, Ajnakina, Steptoe and Cadar4–Reference Anstey, Cherbuin, Budge and Young6
Disturbances in metabolic processes can influence olfactory performance while, conversely, the sense of smell can affect energy regulation and body mass.Reference Palouzier-Paulignan, Lacroix, Aimé, Baly, Caillol and Congar22 The olfactory system plays a crucial role in guiding food selection, significantly influencing nutrient intake and regulating portion size.Reference Gaillet-Torrent, Sulmont-Rossé, Issanchou, Chabanet and Chambaron23–Reference Stroebele and De Castro25
Orthonasal smell perception, in which scents reach the olfactory epithelium through the nose before food enters the mouth, can specifically enhance the desire for foods associated with that aroma.Reference Yin, Hewson, Linforth, Taylor and Fisk26 In contrast, once the food is in the mouth, retronasal olfactory signals tend to reduce the appetite for that food and potentially for others as well.Reference Velluzzi, Deledda, Onida, Loviselli, Crnjar and Sollai27
In the present study, we investigated the effects of being overweight and obese on central and peripheral olfactory pathways using MRI. On the right side, the mean olfactory bulb volumes of the overweight group and the obese group, and on the left side, the mean OB volume of the obese group were significantly lower than that of the control group. For both sides, the mean insular gyrus area of the obese group was significantly lower than those for the control group. On the right side, the mean corpus amygdala area of the obese group was significantly lower than that of the control group.
Correlation tests showed that there were positive correlations between OB volumes, OS depths, insular gyrus areas and corpus amygdala areas bilaterally. In women, OS depths were significantly lower than those in men. As BMI increased, OB volumes, OS depths, insular gyrus areas and corpus amygdala areas decreased bilaterally. No significant correlations were found between age and the measurement values of the central and peripheral smell regions.
An increasing number of studies have indicated that the sense of smell is affected in individuals with obesity. In particular, olfactory abilities appear to decline progressively as BMI rises.Reference Richardson, Vander Woude, Sudan, Thompson and Leopold28 A meta-analysis found that higher BMI was associated with a poorer odour threshold, whereas odour discrimination and overall sensitivity remained unaffected.Reference Peng, Coutts, Wang and Cakmak29–Reference Skrandies and Zschieschang37 Our results were different from those of this study: as BMI increased, peripheral and central odour region measurement values decreased.
Velluzzi et al.Reference Velluzzi, Deledda, Onida, Loviselli, Crnjar and Sollai27 assessed the olfactory threshold, discrimination and identification (TDI) scores in 70 patients from the Obesity Center (OC) of the University Hospital and compared these results with those from 65 healthy, normal weight controls (HC). Individuals in the OC group exhibited significantly poorer overall olfactory function than HC participants, including a reduced ability to discriminate and identify odours, with this difference persisting when men and women were analysed separately. Among OC patients, BMI showed a negative correlation with each subject’s olfactory scores, both within gender groups and in the combined analysis. Additionally, normosmic OC patients had notably lower BMIs compared with those with hyposmia. Impaired olfactory function may play a role in obesity by influencing cephalic phase responses, potentially delaying satiety and promoting excessive consumption of energy-dense foods and beverages.Reference Velluzzi, Deledda, Onida, Loviselli, Crnjar and Sollai27 Similar to this study, in our study, there was a negative correlation between BMI and the measurement results of the olfactory regions in the cranial MRI.
Research in adult men has shown a positive link between greater subcutaneous fat and reduced odour perception.Reference Hubert, Fabsitz, Feinleib and Brown38 According to Simchen et al.,Reference Simchen, Koebnick, Hoyer, Issanchou and Zunft32 the connection between obesity and olfactory performance varies with age: in adults younger than 65, lower BMIs tended to correspond with better olfactory function whereas, in those older than 65, the reverse trend was observed. People who are obese have also been found to score significantly lower in odour TDI tests.Reference Peng, Coutts, Wang and Cakmak29, Reference Fernández-Aranda, Agüera, Fernández-García, Garrido-Sanchez, Alcaide-Torres and Tinahones30
The hypothalamus is widely regarded as the central regulator of this processing and growing evidence links hypothalamic dysfunction to the development of obesityReference Timper and Brüning7. Hedonic processing is largely mediated by frontal–mesolimbic brain regions, such as the frontal cortex [dorsal lateral pre-frontal cortex (DLPFC), anterior cingulate cortex (ACC), orbitofrontal cortex (OFC)],Reference Carnell, Benson, Chang, Wang, Huo and Geliebter39, Reference Masterson, Bermudez, Austen, Lundquist, Pearce and Bruce40 striatum [nucleus accumbens (NAc), caudate, putamen],Reference Belfort-DeAguiar, Seo, Lacadie, Naik, Schmidt and Lam41–Reference Wiemerslage, Nilsson, Solstrand Dahlberg, Ence-Eriksson, Castillo and Larsen44 limbic regions [insula, amygdala (AMY), hippocampus (HIPP)] and thalamus’.Reference Carnell, Benson, Chang, Wang, Huo and Geliebter39, Reference Dodd, Long, Hou, Kahathuduwa and O’Boyle45 Both homeostatic and hedonic systems are integral to appetite regulation and control of food intake, with substantial cross-communication between them.Reference Rossi and Stuber46 Disruption or imbalance in these systems can contribute to the onset of eating disorders.Reference Bohon8
External and social influences – such as cultural traditions, food accessibility and eating environments – significantly shape dietary behaviour and metabolic outcomes, often interacting with olfactory processing.Reference Rolls47 Moreover, genetic and epigenetic differences can alter odour perception, thereby influencing both eating patterns and metabolism.Reference López, Fernández-Real and Tomarev48 Expanding research into the gut–brain axis and the role of gut microbiota adds another layer of complexity to understanding these mechanisms in metabolic control.Reference Matiashova, Hoogkamer and Timper2, Reference González-García, Freire-Agulleiro, Nakaya, Ortega, Garrido-Gil and Liñares-Pose49
In obesity, certain peptides appear to play an important role. Firstly, individuals with obesity tend to have elevated circulating leptin and insulin levels,Reference Palouzier-Paulignan, Lacroix, Aimé, Baly, Caillol and Congar22 which bind to their abundant receptors in olfactory structures, exerting an inhibitory effect mainly on the mitral cells of the OB, the initial site of olfactory signal processing responsible for representing odour identity and intensity.Reference Gschwend, Beroud, Vincis, Rodriguez and Carleton50–Reference Uchida, Poo and Haddad53 Secondly, obesity is also associated with reduced circulating ghrelin, leading to diminished olfactory function due to the hormone’s weakened effect.Reference Tschöp, Weyer, Tataranni, Devanarayan, Ravussin and Heiman54 These opposing influences may account for the lower olfactory performance in obese patients compared with normal weight individuals, as reported in Velluzzi et al.’s study.Reference Velluzzi, Deledda, Onida, Loviselli, Crnjar and Sollai27
Abnormal neural activity in obese individuals has also been observed in response to gustatory and olfactory cues, particularly within brain regions responsible for decision-making, inhibitory control, reward processing, olfactory integration and memory, patterns that may contribute to overeating and subsequent weight gain.Reference Li, Hu, Zhang, Wang, Ji and Manza1
This study has several limitations. Firstly, it is a retrospective design. Secondly, the sample size was relatively small, which may limit the generalizability of the results. Thirdly, measurements were performed by a single radiologist, so inter-observer and intra-observer variability was not assessed. The absence of an inter-observer variability assessment represents a significant limitation, particularly for manual MRI measurements; future studies should include multiple independent radiologists to improve reproducibility. Fourthly, although exclusion criteria aimed to minimise confounding factors, subclinical or undetected sinonasal or neurological conditions affecting olfactory pathways may still have been present. Fifthly, the study did not evaluate functional olfactory performance tests in parallel with anatomical measurements, which could have strengthened the correlation between structure and function. Finally, the volumetric measurements of the OB and cortical areas were based on manual tracing rather than fully automated segmentation methods, which may be more susceptible to operator-dependent variability.
Conclusion
In overweight and obese patients, OB volumes decreased. Insular gyrus and corpus amygdala areas had also decreased in obese patients. Higher BMI values were related to a decrease in the measurements of the peripheral and central olfactory regions. We recommend taking into account the effects of obesity on the olfactory system in weight control and in the fight against obesity.
SummaryWhat is already known on the subject
• Obesity is a growing global health epidemic driven by caloric imbalance, significantly increasing the risk of chronic diseases and psychological burdens.
• Obese individuals exhibit altered brain responses to food cues, showing heightened activation in reward centers and reduced activity in feeding-regulation areas.
• The sense of smell is deeply connected to feeding behavior and hypothalamic function, as olfactory sensitivity increases with hunger and decreases with satiety.
What this paper adds to our understanding
• In overweight and obese patients, olfactory bulb (OB) volumes decreased.
• Insular gyrus and corpus amygdala areas also decreased in obese patients.
• As body mass index (BMI) increased, OB volumes, olfactory sulcus depths, insular gyrus areas and corpus amygdala areas decreased bilaterally.
• Higher BMI values were related to a decrease in the measurements of peripheral and central olfactory regions.
• The effects of obesity on the olfactory system should be kept in mind for weight control and the fight against obesity.
Acknowledgements
None
Author contributions
Mehmet Hamdi Şahan: Planning, designing, data collection, literature survey, active intellectual support, writing. Nuray Bayar Muluk: Planning, designing, literature survey, statistical analysis, interpretation of the results, active intellectual support, writing, submission.
Funding
There are no funds for this article.
Financial disclosures
There are no financial disclosures of the authors.
Competing interests
Mehmet Hamdi Şahan and Nuray Bayar Muluk declares that they have no conflicts of interest.
Ethical standards
This study is retrospective. Ethics committee approval was obtained from Gaziantep University Clinical Research Ethics Committee (Decision Number: 2025/165; date: 18 June 2025). There was no need to obtain informed consent because the data were evaluated retrospectively.
Availability of data and materials
Data sharing was not applicable to this article as no datasets were generated or analysed during the current study.
Consent for publication
All authors give consent for publication.



 Open access

