Introduction
Depression is known to have a measurable genetic component, with heritability estimated at 30–40% (Sullivan et al. Reference Sullivan, Neale and Kendler2000). But specific genes or variants that confer risk for depression have proven difficult to identify and/or replicate, despite multiple attempts using genome-wide association studies (GWAS) with large sample sizes and different characterizations of the phenotype (Sullivan et al. Reference Sullivan, de Geus, Willemsen, James, Smit, Zandbelt, Arolt, Baune, Blackwood, Cichon, Coventry, Domschke, Farmer, Fava, Gordon, He, Heath, Heutink, Holsboer, Hoogendijk, Hottenga, Hu, Kohli, Lin, Lucae, Macintyre, Maier, McGhee, McGuffin, Montgomery, Muir, Nolen, Nöthen, Perlis, Pirlo, Posthuma, Rietschel, Rizzu, Schosser, Smit, Smoller, Tzeng, van Dyck, Verhage, Zitman, Martin, Wray, Boomsma and Penninx2009; Muglia et al. Reference Muglia, Tozzi, Galwey, Francks, Upmanyu, Kong, Antoniades, Domenici, Perry, Rothen, Vandeleur, Mooser, Waeber, Vollenweider, Preisig, Lucae, Müller-Myhsok, Holsboer, Middleton and Roses2010; Rietschel et al. Reference Rietschel, Mattheisen, Frank, Treutlein, Degenhardt, Breuer, Steffens, Mier, Esslinger, Walter, Kirsch, Erk, Schnell, Herms, Wichmann, Schreiber, Jöckel, Strohmaier, Roeske, Haenisch, Gross, Hoefels, Lucae, Binder, Wienker, Schulze, Schmäl, Zimmer, Juraeva, Brors, Bettecken, Meyer-Lindenberg, Müller-Myhsok, Maier, Nöthen and Cichon2010; Terracciano et al. Reference Terracciano, Tanaka, Sutin, Sanna, Deiana, Lai, Uda, Schlessinger, Abecasis, Ferrucci and Costa2010; Bosker et al. Reference Bosker, Hartman, Nolte, Prins, Terpstra, Posthuma, van Veen, Willemsen, DeRijk, de Geus, Hoogendijk, Sullivan, Penninx, Boomsma, Snieder and Nolen2011; Shi et al. Reference Shi, Potash, Knowles, Weissman, Coryell, Scheftner, Lawson, DePaulo, Gejman, Sanders, Johnson, Adams, Chaudhury, Jancic, Evgrafov, Zvinyatskovskiy, Ertman, Gladis, Neimanas, Goodell, Hale, Ney, Verma, Mirel, Holmans and Levinson2011; Shyn et al. Reference Shyn, Shi, Kraft, Potash, Knowles, Weissman, Garriock, Yokoyama, McGrath, Peters, Scheftner, Coryell, Lawson, Jancic, Gejman, Sanders, Holmans, Slager, Levinson and Hamilton2011; Wray et al. Reference Wray, Pergadia, Blackwood, Penninx, Gordon, Nyholt, Ripke, MacIntyre, McGhee, Maclean, Smit, Hottenga, Willemsen, Middeldorp, de Geus, Lewis, McGuffin, Hickie, van den Oord, Liu, Macgregor, McEvoy, Byrne, Medland, Statham, Henders, Heath, Montgomery, Martin, Boomsma, Madden and Sullivan2012; Hek et al. Reference Hek, Demirkan, Lahti, Terracciano, Teumer, Cornelis, Amin, Bakshis, Baumert, Ding, Liu, Marciante, Meirelles, Nalls, Sun, Vogelzangs, Yu, Bandinelli, Benjamin, Bennett, Boomsma, Cannas, Coker, de Geus, De Jager, Diez-Roux, Purcell, Hu, Rimm, Hunter, Jensen, Curhan, Rice, Penman, Rotter, Sotoodehnia, Emeny, Eriksson, Evans, Ferrucci, Fornage, Gudnason, Hofman, Illig, Kardia, Kelly-Hayes, Koenen, Kraft, Kuningas, Massaro, Melzer, Mulas, Mulder, Murray, Oostra, Palotie, Penninx, Petersmann, Pilling, Psaty, Rawal, Reiman, Schulz, Shulman, Singleton, Smith, Sutin, Uitterlinden, Völzke, Widen, Yaffe, Zonderman, Cucca, Harris, Ladwig, Llewellyn, Räikkönen, Tanaka, van Duijn, Grabe, Launer, Lunetta, Mosley, Newman, Tiemeier and Murabito2013; Major Depressive Disorder Work Group of the Psychiatric GWAS Consortium et al. Reference Ripke, Wray, Lewis, Hamilton, Weissman, Breen, Byrne, Blackwood, Boomsma, Cichon, Heath, Holsboer, Lucae, Madden, Martin, McGuffin, Muglia, Noethen, Penninx, Pergadia, Potash, Rietschel, Lin, Müller-Myhsok, Shi, Steinberg, Grabe, Lichtenstein, Magnusson, Perlis, Preisig, Smoller, Stefansson, Uher, Kutalik, Tansey, Teumer, Viktorin, Barnes, Bettecken, Binder, Breuer, Castro, Churchill, Coryell, Craddock, Craig, Czamara, De Geus, Degenhardt, Farmer, Fava, Frank, Gainer, Gallagher, Gordon, Goryachev, Gross, Guipponi, Henders, Herms, Hickie, Hoefels, Hoogendijk, Hottenga, Iosifescu, Ising, Jones, Jones, Jung-Ying, Knowles, Kohane, Kohli, Korszun, Landen, Lawson, Lewis, Macintyre, Maier, Mattheisen, McGrath, McIntosh, McLean, Middeldorp, Middleton, Montgomery, Murphy, Nauck, Nolen, Nyholt, O'Donovan, Oskarsson, Pedersen, Scheftner, Schulz, Schulze, Shyn, Sigurdsson, Slager, Smit, Stefansson, Steffens, Thorgeirsson, Tozzi, Treutlein, Uhr, van den Oord, Van Grootheest, Völzke, Weilburg, Willemsen, Zitman, Neale, Daly, Levinson and Sullivan2013). There is growing consensus that complex psychiatric disorders, including major depressive disorder (MDD), have a significant polygenic risk component, in which genetic liability is conferred by the combined additive effects of large numbers of variants with small effect sizes (Sullivan et al. Reference Sullivan, Daly and O'Donovan2012; Cross-Disorder Group of the Psychiatric Genomics Consortium et al. Reference Lee, Ripke, Neale, Faraone, Purcell, Perlis, Mowry, Thapar, Goddard, Witte, Absher, Agartz, Akil, Amin, Andreassen, Anjorin, Anney, Anttila, Arking, Asherson, Azevedo, Backlund, Badner, Bailey, Banaschewski, Barchas, Barnes, Barrett, Bass, Battaglia, Bauer, Bayés, Bellivier, Bergen, Berrettini, Betancur, Bettecken, Biederman, Binder, Black, Blackwood, Bloss, Boehnke, Boomsma, Breen, Breuer, Bruggeman, Cormican, Buccola, Buitelaar, Bunney, Buxbaum, Byerley, Byrne, Caesar, Cahn, Cantor, Casas, Chakravarti, Chambert, Choudhury, Cichon, Cloninger, Collier, Cook, Coon, Cormand, Corvin, Coryell, Craig, Craig, Crosbie, Cuccaro, Curtis, Czamara, Datta, Dawson, Day, De Geus, Degenhardt, Djurovic, Donohoe, Doyle, Duan, Dudbridge, Duketis, Ebstein, Edenberg, Elia, Ennis, Etain, Fanous, Farmer, Ferrier, Flickinger, Fombonne, Foroud, Frank, Franke, Fraser, Freedman, Freimer, Freitag, Friedl, Frisén, Gallagher, Gejman, Georgieva, Gershon, Geschwind, Giegling, Gill, Gordon, Gordon-Smith, Green, Greenwood, Grice, Gross, Grozeva, Guan, Gurling, De Haan, Haines, Hakonarson, Hallmayer, Hamilton, Hamshere, Hansen, Hartmann, Hautzinger, Heath, Henders, Herms, Hickie, Hipolito, Hoefels, Holmans, Holsboer, Hoogendijk, Hottenga, Hultman, Hus, Ingason, Ising, Jamain, Jones, Jones, Jones, Tzeng, Kähler, Kahn, Kandaswamy, Keller, Kennedy, Kenny, Kent, Kim, Kirov, Klauck, Klei, Knowles, Kohli, Koller, Konte, Korszun, Krabbendam, Krasucki, Kuntsi, Kwan, Landén, Långström, Lathrop, Lawrence, Lawson, Leboyer, Ledbetter, Lee, Lencz, Lesch, Levinson, Lewis, Li, Lichtenstein, Lieberman, Lin, Linszen, Liu, Lohoff, Loo, Lord, Lowe, Lucae, MacIntyre, Madden, Maestrini, Magnusson, Mahon, Maier, Malhotra, Mane, Martin, Martin, Mattheisen, Matthews, Mattingsdal, McCarroll, McGhee, McGough, McGrath, McGuffin, McInnis, McIntosh, McKinney, McLean, McMahon, McMahon, McQuillin, Medeiros, Medland, Meier, Melle, Meng, Meyer, Middeldorp, Middleton, Milanova, Miranda, Monaco, Montgomery, Moran, Moreno-De-Luca, Morken, Morris, Morrow, Moskvina, Muglia, Mühleisen, Muir, Müller-Myhsok, Murtha, Myers, Myin-Germeys, Neale, Nelson, Nievergelt, Nikolov, Nimgaonkar, Nolen, Nöthen, Nurnberger, Nwulia, Nyholt, O'Dushlaine, Oades, Olincy, Oliveira, Olsen, Ophoff, Osby, Owen, Palotie, Parr, Paterson, Pato, Pato, Penninx, Pergadia, Pericak-Vance, Pickard, Pimm, Piven, Posthuma, Potash, Poustka, Propping, Puri, Quested, Quinn, Ramos-Quiroga, Rasmussen, Raychaudhuri, Rehnström, Reif, Ribasés, Rice, Rietschel, Roeder, Roeyers, Rossin, Rothenberger, Rouleau, Ruderfer, Rujescu, Sanders, Sanders, Santangelo, Sergeant, Schachar, Schalling, Schatzberg, Scheftner, Schellenberg, Scherer, Schork, Schulze, Schumacher, Schwarz, Scolnick, Scott, Shi, Shilling, Shyn, Silverman, Slager, Smalley, Smit, Smith, Sonuga-Barke, St Clair, State, Steffens, Steinhausen, Strauss, Strohmaier, Stroup, Sutcliffe, Szatmari, Szelinger, Thirumalai, Thompson, Todorov, Tozzi, Treutlein, Uhr, van den Oord, Van Grootheest, Van Os, Vicente, Vieland, Vincent, Visscher, Walsh, Wassink, Watson, Weissman, Werge, Wienker, Wijsman, Willemsen, Williams, Willsey, Witt, Xu, Young, Yu, Zammit, Zandi, Zhang, Zitman, Zöllner, Devlin, Kelsoe, Sklar, Daly, O'Donovan, Craddock, Sullivan, Smoller, Kendler and Wray2013). Polygenic risk can be characterized in a GWAS by creating a summary score of weighted allelic dosage across all single nucleotide polymorphisms (SNPs) associated with the outcome at a pre-specified significance threshold (International Schizophrenia Consortium et al. 2009). Previous GWAS using polygenic scores to characterize genetic liability for depression found that they explain between 0.2% and 1% of the variance (Demirkan et al. Reference Demirkan, Penninx, Hek, Wray, Amin, Aulchenko, van Dyck, de Geus, Hofman, Uitterlinden, Hottenga, Nolen, Oostra, Sullivan, Willemsen, Zitman, Tiemeier, Janssens, Boomsma, van Duijn and Middeldorp2011; Major Depressive Disorder Work Group of the Psychiatric GWAS Consortium et al. Reference Ripke, Wray, Lewis, Hamilton, Weissman, Breen, Byrne, Blackwood, Boomsma, Cichon, Heath, Holsboer, Lucae, Madden, Martin, McGuffin, Muglia, Noethen, Penninx, Pergadia, Potash, Rietschel, Lin, Müller-Myhsok, Shi, Steinberg, Grabe, Lichtenstein, Magnusson, Perlis, Preisig, Smoller, Stefansson, Uher, Kutalik, Tansey, Teumer, Viktorin, Barnes, Bettecken, Binder, Breuer, Castro, Churchill, Coryell, Craddock, Craig, Czamara, De Geus, Degenhardt, Farmer, Fava, Frank, Gainer, Gallagher, Gordon, Goryachev, Gross, Guipponi, Henders, Herms, Hickie, Hoefels, Hoogendijk, Hottenga, Iosifescu, Ising, Jones, Jones, Jung-Ying, Knowles, Kohane, Kohli, Korszun, Landen, Lawson, Lewis, Macintyre, Maier, Mattheisen, McGrath, McIntosh, McLean, Middeldorp, Middleton, Montgomery, Murphy, Nauck, Nolen, Nyholt, O'Donovan, Oskarsson, Pedersen, Scheftner, Schulz, Schulze, Shyn, Sigurdsson, Slager, Smit, Stefansson, Steffens, Thorgeirsson, Tozzi, Treutlein, Uhr, van den Oord, Van Grootheest, Völzke, Weilburg, Willemsen, Zitman, Neale, Daly, Levinson and Sullivan2013; Chang et al. Reference Chang, Glymour, Walter, Liang, Joenen, Tchetgen, Cornelis, Kawachi, Rimm and Kubzansky2014), suggesting that polygenic risk (as captured by current GWAS) has only a modest effect on depression. However these studies did not take into account the potential contribution of gene × environment (G × E) interactions.
A number of previous studies have found evidence suggesting that genetic factors may interact with stressful life events (SLEs) to increase the risk of depression by a larger amount than one would expect by the combined effects of each factor separately. In an early twin study, Kendler et al. (Reference Kendler, Kessler, Walters, MacLean, Neale, Heath and Eaves1995) found that exposure to a severe SLE increased the risk of depression to a larger degree among individuals with high genetic predisposition, compared with individuals with low genetic predisposition. In a widely publicized candidate gene study, Caspi et al. (Reference Caspi, Sugden, Moffitt, Taylor, Craig, Harrington, McClay, Mill, Martin, Braithwaite and Poulton2003) found that the effect of a functional polymorphism on the promoter region of the serotonin transporter gene (5-HTTPR) on depression risk increased with the number of SLEs. The findings of this study generated a great deal of interest in the 5-HTTPR × stress interaction as a potential contributing factor in the etiology of depression. Numerous attempts to replicate this finding over the past 10 years have yielded inconsistent results, however (Munafò et al. Reference Munafò, Durrant, Lewis and Flint2009; Risch et al. Reference Risch, Herrell, Lehner, Liang, Eaves, Hoh, Griem, Kovacs, Ott and Merikangas2009; Karg et al. Reference Karg, Burmeister, Shedden and Sen2011), which led to a great deal of discourse and conflicting opinions surrounding the validity or exact nature of this association (Brown & Harris, Reference Brown and Harris2008; Caspi et al. Reference Caspi, Hariri, Holmes, Uher and Moffitt2010; Uher & McGuffin, Reference Uher and McGuffin2010). Additional studies have found evidence supporting possible interactions between SLEs and genetic polymorphisms on other candidate genes, including the brain-derived neurotrophic factor (BDNF) gene (Kim et al. Reference Kim, Stewart, Kim, Yang, Shin, Kim and Yoon2007; Bukh et al. Reference Bukh, Bock, Vinberg, Werge, Gether and Kessing2009; Chen et al. Reference Chen, Li and McGue2012; Hosang et al. Reference Hosang, Shiles, Tansey, KcGuffin and Uher2014), the dopamine receptor D2 (DRD2) gene (Elovainio et al. Reference Elovainio, Kokela, Kivimaki, Pulkki-Raback, Lehtimaki, Airla and Keltikangas-Jarvinen2007), the corticotropin-releasing-hormone receptor type 1 (CRHR1) gene (Liu et al. Reference Liu, Liu, Yao, Yang, Xiao, Wan, Gao, Wang, Zhu, Wang and Xiao2013), the catechol-O-methyltransferase (COMT) gene (Mandelli et al. Reference Mandelli, Serretti, Marino, Pirovano, Calati and Colombo2007), galanin (GAL) and galanin receptor (GALR2-3) genes (Juhasz et al. Reference Juhasz, Hullam, Eszlari, Gonda, Antal, Anderson, Hokfelt, Deakin and Bagdy2014) and the hsp90 co-chaperone binding protein (FKBP5) gene (Zimmermann et al. Reference Zimmermann, Bruckl, Nocon, Pfister, Binder, Uhr, Lieb, Moffitt, Caspi, Holsboer and Ising2011). This suggests that the stress × gene interaction may involve a broad array of genetic factors beyond the 5-HTTPR locus.
Only one previous study has examined the interaction between polygenic risk (probably a better index of the overall genetic liability to depression than candidate genes) and SLEs (Peyrot et al. Reference Peyrot, Milaneschi, Abdellaoui, Sullivan, Hottenga, Boomsma and Penninx2014). Peyrot et al. (Reference Peyrot, Milaneschi, Abdellaoui, Sullivan, Hottenga, Boomsma and Penninx2014) examined whether a history of childhood trauma moderated the association between polygenic risk scores and MDD in a sample of adult individuals from the Netherlands Study of Depression and Anxiety. They found evidence for an interaction in that the effect of polygenic scores on major depression risk was stronger among individuals who reported a history of childhood trauma. To the best of our knowledge, no previous study has evaluated the extent to which either recent SLEs or SLEs experienced during adulthood moderate the association between polygenic risk and depression. The goal of the current study was to test the hypothesis that recent SLEs (experienced within the previous 2 years) moderate the association between polygenic risk scores and depressive symptoms among older adults. To accomplish this, we used data from the Psychiatric Genomics Consortium (PGC) (Sullivan, Reference Sullivan2010), to derive polygenic scores in the Health and Retirement Study (HRS) and tested the association between these scores, SLEs and depressive symptoms.
Method
Study participants
The HRS is a longitudinal panel study designed to assess the effects of aging and retirement on the physical and mental health of community-dwelling older US adults (Health and Retirement Study, 2004). The HRS is sponsored by the National Institute on Aging (NIA; grant no. NIA U01AG009740) and is conducted by the University of Michigan (Juster & Suzman, Reference Juster and Suzman1995). The study began in 1992 with a nationally representative sample of older adults aged 50–60 years. In 1998 it expanded to incorporate additional cohorts of older adults, and since then new cohorts have been added at regular intervals to maintain the overall age range of the sample. At present the HRS consists of approximately 26 000 individuals between the ages of 50 and 90 years old. Information on a wide variety of physical, psychological, cognitive, social and economic variables is collected every 2 years (National Institute on Aging, 2007). Saliva samples were collected in 2006 and 2008, and DNA was obtained for GWAS.
For the current study, phenotype information was drawn from the year 2000 interview and genotype data were obtained from the HRS GWAS. The year 2000 interview was chosen over the 1998 baseline interview to make it easier to establish the temporal relationship between SLEs and depressive symptoms. Participants were included in the current study if they met the following: (1) were present for the year 2000 interview and provided data on depressive symptoms and SLEs; (2) provided a saliva sample and had GWAS data available; (3) were genetically unrelated to all other HRS participants; and (4) reported no history of stroke, transient ischemic attack or memory-related disease. A total of 8761 participants meeting these criteria were included in the study sample.
Measures
Depression
The HRS includes an eight-item subscale of the Center for Epidemiologic Studies Depression Scale (CES-D). This subscale has been used in previous studies to measure depression in older adults, and has demonstrated good internal consistency (Cronbach's α = 0.78) (Turvey et al. Reference Turvey, Wallace and Herzog1999). We operationalized depression in two ways: as a count variable representing number of symptoms (range = 0–8) and as a dichotomous variable (1 = depressed, 0 = not depressed) with a cut-point of ⩾4 symptoms. This cut-point was chosen because it corresponds to a score of 16 on the full CES-D scale, which indicates clinically relevant depressive symptoms (Steffick, Reference Steffick2000).
SLEs
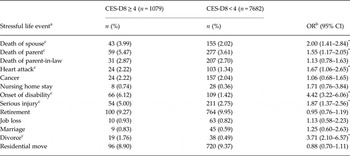
The HRS does not include any validated SLE scales or inventories; however, it does include a number of questions related to health, job loss, bereavement and other significant life events, which correspond to items on well-validated stress measures such as the Social Readjustment Rating Scale (Holmes & Rahe, Reference Holmes and Rahe1967). We tested the associations between 13 of these events and clinically relevant depressive symptoms individually and used events associated with depressive symptoms at the p < 0.05 level to create a composite measure for evaluating moderation (see Table 1). As the number of individuals who reported experiencing more than one SLE within the previous 2-year period was small (n = 63) relative to the numbers of participants who reported none or one SLEs, we operationalized SLEs as a dichotomous variable: 0 = no SLEs and 1 = ⩾1 SLE. We explored the possibility of weighting SLEs by their individual associations with depressive symptoms; however, this approach did not improve the measure's ability to explain the variation in depression, so for the sake of clarity and ease of interpretation we proceeded with the unweighted variable.
Associations between individual stressful life events and depression

CES-D8, Center for Epidemiologic Studies Depression Scale, eight-item version; OR, odds ratio; CI, confidence interval.
a Stressful life events occurred within the previous 2-year period.
b ORs compare the odds of depression among individuals who experienced the event with the odds of depression among individuals who did not experience the event.
c Events included in the composite measure used to test for moderation.
* p < 0.05.
Polygenic risk
Polygenic risk was measured using the polygenic score approach described by the International Schizophrenia Consortium et al. (2009). This approach requires a discovery dataset and a target dataset. The discovery, or training, dataset is used to identify individual SNPs associated with the outcome at a chosen p value threshold (p T). Results from the discovery dataset are then used to derive polygenic scores in the target dataset. In this approach, the polygenic score is a weighted sum of all of the alleles that either confer risk for, or are protective against, the outcome of interest, significant at the p T. For this study we used the results of the combined GWAS of MDD carried out by the PGC (Major Depressive Disorder Work Group of the Psychiatric GWAS Consortium et al. Reference Ripke, Wray, Lewis, Hamilton, Weissman, Breen, Byrne, Blackwood, Boomsma, Cichon, Heath, Holsboer, Lucae, Madden, Martin, McGuffin, Muglia, Noethen, Penninx, Pergadia, Potash, Rietschel, Lin, Müller-Myhsok, Shi, Steinberg, Grabe, Lichtenstein, Magnusson, Perlis, Preisig, Smoller, Stefansson, Uher, Kutalik, Tansey, Teumer, Viktorin, Barnes, Bettecken, Binder, Breuer, Castro, Churchill, Coryell, Craddock, Craig, Czamara, De Geus, Degenhardt, Farmer, Fava, Frank, Gainer, Gallagher, Gordon, Goryachev, Gross, Guipponi, Henders, Herms, Hickie, Hoefels, Hoogendijk, Hottenga, Iosifescu, Ising, Jones, Jones, Jung-Ying, Knowles, Kohane, Kohli, Korszun, Landen, Lawson, Lewis, Macintyre, Maier, Mattheisen, McGrath, McIntosh, McLean, Middeldorp, Middleton, Montgomery, Murphy, Nauck, Nolen, Nyholt, O'Donovan, Oskarsson, Pedersen, Scheftner, Schulz, Schulze, Shyn, Sigurdsson, Slager, Smit, Stefansson, Steffens, Thorgeirsson, Tozzi, Treutlein, Uhr, van den Oord, Van Grootheest, Völzke, Weilburg, Willemsen, Zitman, Neale, Daly, Levinson and Sullivan2013) as our discovery dataset and the HRS as our target dataset.
The PGC (Sullivan, Reference Sullivan2010) is a consortium of research groups around the world carrying out combined analyses of existing GWAS to identify common variants associated with five different psychiatric disorders. The combined PGC MDD GWAS included nine samples [Ising et al. Reference Ising, Lucrae, Binder, Bettecken, Uhr, Ripke, Kohli, Hennings, Horstmann, Kloiber, Menke, Bondy, Rupprecht, Domschke, Baune, Arolt, Rush, Holsboer and Muller-Myhsok2009; Sullivan et al. Reference Sullivan, de Geus, Willemsen, James, Smit, Zandbelt, Arolt, Baune, Blackwood, Cichon, Coventry, Domschke, Farmer, Fava, Gordon, He, Heath, Heutink, Holsboer, Hoogendijk, Hottenga, Hu, Kohli, Lin, Lucae, Macintyre, Maier, McGhee, McGuffin, Montgomery, Muir, Nolen, Nöthen, Perlis, Pirlo, Posthuma, Rietschel, Rizzu, Schosser, Smit, Smoller, Tzeng, van Dyck, Verhage, Zitman, Martin, Wray, Boomsma and Penninx2009; Lewis et al. Reference Lewis, Ng, Butler, Cohen-Woods, Uher, Pirlo, Weale, Schosser, Paredes, Rivera, Craddock, Owen, Jones, Jones, Korszun, Aitchison, Shi, Quinn, Mackenzie, Vollenweider, Waeber, Heath, Lathrop, Muglia, Barnes, Whittaker, Tozzi, Holsboer, Preisig, Farmer, Breen, Craig and McGuffin2010; Muglia et al. Reference Muglia, Tozzi, Galwey, Francks, Upmanyu, Kong, Antoniades, Domenici, Perry, Rothen, Vandeleur, Mooser, Waeber, Vollenweider, Preisig, Lucae, Müller-Myhsok, Holsboer, Middleton and Roses2010; Rietschel et al. Reference Rietschel, Mattheisen, Frank, Treutlein, Degenhardt, Breuer, Steffens, Mier, Esslinger, Walter, Kirsch, Erk, Schnell, Herms, Wichmann, Schreiber, Jöckel, Strohmaier, Roeske, Haenisch, Gross, Hoefels, Lucae, Binder, Wienker, Schulze, Schmäl, Zimmer, Juraeva, Brors, Bettecken, Meyer-Lindenberg, Müller-Myhsok, Maier, Nöthen and Cichon2010; Shi et al. Reference Shi, Potash, Knowles, Weissman, Coryell, Scheftner, Lawson, DePaulo, Gejman, Sanders, Johnson, Adams, Chaudhury, Jancic, Evgrafov, Zvinyatskovskiy, Ertman, Gladis, Neimanas, Goodell, Hale, Ney, Verma, Mirel, Holmans and Levinson2011; Shyn et al. Reference Shyn, Shi, Kraft, Potash, Knowles, Weissman, Garriock, Yokoyama, McGrath, Peters, Scheftner, Coryell, Lawson, Jancic, Gejman, Sanders, Holmans, Slager, Levinson and Hamilton2011; Wray et al. Reference Wray, Pergadia, Blackwood, Penninx, Gordon, Nyholt, Ripke, MacIntyre, McGhee, Maclean, Smit, Hottenga, Willemsen, Middeldorp, de Geus, Lewis, McGuffin, Hickie, van den Oord, Liu, Macgregor, McEvoy, Byrne, Medland, Statham, Henders, Heath, Montgomery, Martin, Boomsma, Madden and Sullivan2012 (two samples)] with a total of 9240 MDD cases and 9519 controls of European descent. All cases in the PGC MDD GWAS met Diagnostic and Statistical Manual of Mental Disorders, 4th edition (DSM-IV) criteria for lifetime history of MDD, measured either using structured diagnostic interviews administered by lay interviewers or diagnostic checklists administered by clinicians. Samples were imputed against the European reference sample from HapMap3 (Altshuler et al. Reference Altshuler, Gibbs, Peltonen, Dermitzakis, Schaffner, Yu, Bonnen, de Bakker, Deloukas, Gabriel, Gwilliam, Hunt, Inouye, Jia, Palotie, Parkin, Whittaker, Chang, Hawes and Lewis2010). Polygenic scores were derived using the PGC's publicly available, clean, linkage disequilibrium-pruned dataset (500 kb window, r 2 = 0.25) consisting of 123 040 non-palindromic (i.e. AT or CG) SNPs in approximate linkage equilibrium with minor allele frequency > 1% and information metric (INFO) > 90%.
Genotyped data for HRS participants was downloaded from dbGAP. Genotyping of the HRS samples was performed by the Center for Inherited Disease Research using the Illumina Human Omni-2.5 Quad beadchip. HRS genotypes in dbGAP were available as genotypes and as 1000 genomes (1000 Genomes Project Consortium et al. 2012) imputed dosage files. Imputation was performed on 2 065 320 SNPs that both passed quality-control filters (described in detail in the HRS quality-control report; Center for Inherited Disease Research, 2012a ) and overlapped with the 1000 genomes reference panel (Center for Inherited Disease Research, 2012b ). Of the 12 507 HRS participants with available GWAS data, imputed data were provided for 12 454 samples. The rest were excluded due to missing call rates > 2% (Center for Inherited Disease Research, 2012b ). For our primary analysis we used the imputed files, selected SNPs with INFO > 0.90 and converted them to PLINK files using GTOOL (Freeman & Marchini, Reference Freeman and Marchini2007). Although this method of analysing imputed data does not account for uncertainty generated by the imputation process, simulation studies suggest that for SNPs with INFO > 0.90, this method does not result in a significant loss of power (Zheng et al. Reference Zheng, Li, Abecasis and Scheet2011).
Almost all the clumped MDD PGC SNPs were present in the imputed HRS GWAS (99%; 121 251 of 123 040 SNPs). We derived 10 continuous polygenic score variables in PLINK (Purcell et al. Reference Purcell, Neale, Todd-Brown, Thomas, Ferreira, Bender, Maller, Sklar, de Bakker, Daly and Sham2007) using the following p T: p T < 0.10; p T < 0.20; p T < 0.30; p T < 0.40; p T < 0.50; p T < 0.60; p T < 0.70; p T < 0.80; p T < 0.90; p T < 1.0. Each allele was weighted by the natural log (ln) of the odds ratio (OR) of its association with MDD in the discovery dataset.
Analyses
We evaluated the associations between SLEs, polygenic scores and depressive symptoms using logistic and negative binomial regression models. Because the range of polygenic scores across individuals was narrow, we multiplied the scores by 10 000 to make differences in β coefficients between models observable. Next we estimated the main effects of both SLEs and polygenic scores together in the same models before including interaction terms to test for moderation. All regression models were adjusted for age (centered), sex, education and ancestry [using self-reported race (black, white, Hispanic) in models without polygenic score variables and the first three principal components (PCs) in models that included polygenic score variables (Price et al. Reference Price, Patterson, Plenge, Weinblatt, Shadick and Reich2006)]. We adjusted for the first three PCs based on an examination of eigenvalues and a scree plot from a PC analysis conducted as part of the HRS GWAS quality control. We also ran the models with up to eight PCs and observed no meaningful difference in the results. Interaction models were additionally adjusted for all covariate × environment and covariate × polygenic score interactions (Keller, Reference Keller2014).
Analyses were conducted in SAS 9.3 (USA). An α level of p < 0.05 was used to judge statistical significance. Because the results were similar for all 10 polygenic score variables, we report only the results for p T < 0.40 – the threshold after which the proportion of variance explained by polygenic scores stopped increasing (see online Supplementary Fig. S1). Complete results for all 10 polygenic score thresholds are shown in online Supplementary Tables S1 and S2.
We conducted a number of additional analyses to test the robustness of the findings, including calculating polygenic scores using only directly assayed SNPs from the HRS GWAS sample, testing for interaction on the additive scale using linear models and testing the interactions between SLEs and various categorical measures of polygenic score. We also ran the regression models in the sample of HRS participants who self-reported their race as ‘white/Caucasian’ (see online Supplementary Tables S3 and S4). None of these additional analyses produced results that differed significantly from the main analyses, although the proportion of variance explained by the polygenic score variables was slightly smaller in the white/Caucasian sample compared with the full sample.
Results
Participant characteristics
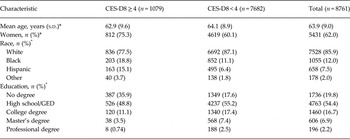
The study sample was primarily white (86%) and female (62%), with an average age of 64 years. Of the 8761 participants, 1079 (12.3%) met criteria for clinically relevant depressive symptoms (CES-D8 score ⩾4). Participants with clinically relevant depressive symptoms were significantly younger and more likely to be female, black or Hispanic, and to have no education degree (see Table 2). Approximately 12.6% (n = 1101) of participants reported experiencing at least one SLE within the previous 2 years. The most common SLE reported in this sample was the death of a parent (3.83%, n = 336) followed by a serious injury (3.02%, n = 265). The least common SLE was a nursing home stay, reported by only 0.41% (n = 36) of the sample.
Sample characteristics for participants with and without clinically relevant depressive symptoms

CES-D8, Center for Epidemiologic Studies Depression Scale, eight-item version; s.d., standard deviation; GED, General Educational Development.
* t Test or χ2 test comparing depressed v. non-depressed participants significant (p < 0.05).
SLEs and depression
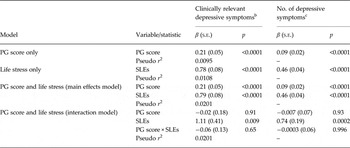
The odds of experiencing ⩾4 depressive symptoms were over twice as high among individuals who reported experiencing at least one SLE (OR 2.19, 95% confidence interval 1.86–2.58, p < 0.0001). SLEs explained about 1% of the variance in depressive symptoms (pseudo r 2 = 0.0108). The pattern of results was similar when depressive symptoms were modeled as a count variable (see Table 3).
Results of regression models examining the associations between PG scores, SLEs and depressive symptoms a

PG, Polygenic; SLE, Stressful life event; s.e., standard error; p T, p value threshold; CES-D8, Center for Epidemiologic Studies Depression Scale, eight-item version.
a All regression analyses adjusted for age (centered), sex, education and ancestry [self-reported race (white, black, Hispanic, other) in the ‘life stress only’ model, first three principal components in all other models]. Interaction models adjusted for all PG × covariate and SLE × covariate interaction terms. PG scores presented in the table were generated using p T < 0.40. The PG score variable generated in PLINK was multiplied by 10 000 for the regression analyses in order to make changes in β coefficients between models observable. Pseudo r 2 values were ascertained by fitting models without covariates.
b Depression = 1 if CES-D8 score ⩾4; model type = logistic.
c Depressive symptoms = CES-D8 score, range = 1–8; model type = negative binomial.
Polygenic scores and depressive symptoms
Polygenic scores were significantly associated with depressive symptoms: as polygenic score increased, so did the odds of experiencing ⩾4 depressive symptoms (see Table 3). Polygenic scores explained about 1% of the variance in depressive symptoms (pseudo r 2 = 0.0095). Again, the pattern of results was similar when depressive symptoms were modeled as a count variable.
Polygenic scores, SLEs and depressive symptoms
Both polygenic scores and SLEs were significant predictors of depressive symptoms in the combined main effects regression models (see Table 3). The magnitudes of the coefficients for polygenic scores and SLEs did not change when both predictors were included in the same models, suggesting that SLEs did not mediate or confound the association between polygenic scores and depressive symptoms. We also failed to find evidence for gene–environment correlation: polygenic scores did not predict SLEs in a separate logistic regression model (β = 0.02, s.e. = 0.02, p = 0.33). There was no significant interaction between the effects of SLEs and polygenic scores for either clinically relevant depressive symptoms (β = −0.06, s.e. = 0.13, p = 0.65) or number of depressive symptoms (β = −0.0003, s.e. = 0.06, p = 0.996).
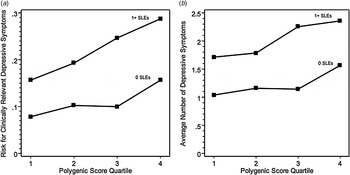
Fig. 1 shows the unadjusted associations between polygenic score quartiles and depressive symptoms separately for individuals who experienced 0 and 1 + SLEs. Risk for experiencing ⩾4 depressive symptoms ranged from 8% among individuals in the lowest polygenic score quartile who did not experience an SLE to 29% among individuals in the top polygenic score quartile who experienced 1 or more SLEs. Average symptom count ranged from 1.04 among individuals in the lowest polygenic score quartile who did not experience an SLE to 2.36 among individuals in the top polygenic score quartile who experienced one or more SLEs. Consistent with an additive model, there was an overall increase in depression risk associated with experiencing one or more SLEs; however, the associations between polygenic scores and depressive symptoms were similar regardless of whether or not individuals had experienced an SLE.
Polygenic risk (a) and depressive symptoms (b) in the Health and Retirement Study, stratified by stressful life events (SLEs). Polygenic scores were derived in study participants using single nucleotide polymorphisms associated with major depressive disorder (MDD) at the p < 0.40 level in the Psychiatric Genomics Consortium MDD combined genome-wide association study. Individuals were considered to have clinically relevant depressive symptoms if they scored ⩾4 on the Center for Epidemiologic Studies Depression Scale, eight-item version.

Discussion
In this study, we examined the associations between polygenic risk scores, recent adult-onset SLEs and depressive symptoms in a large US sample of older adults. We found that both SLEs and polygenic scores were significantly and independently associated with depressive symptoms, but found no evidence that SLEs moderated the association between polygenic risk and depressive symptoms. Instead, the combined effect of SLEs and polygenic scores on depressive symptoms was equal to the sum of the individual effects, as predicted by an additive model.
The overall effect of polygenic scores on depressive symptoms in this study was modest; polygenic risk explained less than 1% of the variance in depressive symptoms, which is consistent with results from other samples (Demirkan et al. Reference Demirkan, Penninx, Hek, Wray, Amin, Aulchenko, van Dyck, de Geus, Hofman, Uitterlinden, Hottenga, Nolen, Oostra, Sullivan, Willemsen, Zitman, Tiemeier, Janssens, Boomsma, van Duijn and Middeldorp2011; Major Depressive Disorder Work Group of the Psychiatric GWAS Consortium et al. Reference Ripke, Wray, Lewis, Hamilton, Weissman, Breen, Byrne, Blackwood, Boomsma, Cichon, Heath, Holsboer, Lucae, Madden, Martin, McGuffin, Muglia, Noethen, Penninx, Pergadia, Potash, Rietschel, Lin, Müller-Myhsok, Shi, Steinberg, Grabe, Lichtenstein, Magnusson, Perlis, Preisig, Smoller, Stefansson, Uher, Kutalik, Tansey, Teumer, Viktorin, Barnes, Bettecken, Binder, Breuer, Castro, Churchill, Coryell, Craddock, Craig, Czamara, De Geus, Degenhardt, Farmer, Fava, Frank, Gainer, Gallagher, Gordon, Goryachev, Gross, Guipponi, Henders, Herms, Hickie, Hoefels, Hoogendijk, Hottenga, Iosifescu, Ising, Jones, Jones, Jung-Ying, Knowles, Kohane, Kohli, Korszun, Landen, Lawson, Lewis, Macintyre, Maier, Mattheisen, McGrath, McIntosh, McLean, Middeldorp, Middleton, Montgomery, Murphy, Nauck, Nolen, Nyholt, O'Donovan, Oskarsson, Pedersen, Scheftner, Schulz, Schulze, Shyn, Sigurdsson, Slager, Smit, Stefansson, Steffens, Thorgeirsson, Tozzi, Treutlein, Uhr, van den Oord, Van Grootheest, Völzke, Weilburg, Willemsen, Zitman, Neale, Daly, Levinson and Sullivan2013; Chang et al. Reference Chang, Glymour, Walter, Liang, Joenen, Tchetgen, Cornelis, Kawachi, Rimm and Kubzansky2014). However while polygenic scores may not be especially predictive of depression risk at the population level, our results suggest that the combined effects of SLEs and polygenic risk may have a relevant impact on depression risk that could potentially be harnessed for preventative purposes.
The results of this study are consistent with a version of the diathesis–stress model in which environmental stress and biological diatheses are viewed as additive components in the etiology of psychopathology (Ingram & Luxton, Reference Ingram, Luxton, Hankin and Abela2005). According to this model, the same degree of depression could theoretically be precipitated in anyone regardless of genetic susceptibility, but the degree of stress required to precipitate a given level of depression will vary depending on an individual's level on the underlying diathesis (in this case, the polygenetic risk). Based on these findings, it appears that older adults with lower genetic risk profiles may have about the same probability of experiencing clinically relevant depressive symptomatology as individuals with higher genetic risk profiles if they are exposed to more stress. It is worth noting, however, that the polygenic scores used in this study have only measured the additive effects of common genetic variants. Other sources of genetic variation that may be relevant for assessing gene × stress interactions, such as rare variation or gene × gene interactions (Kaufman et al. Reference Kaufman, Yang, Douglas-Palumberi, Grasso, Lipschitz, Houshyar, Krystal and Gelernter2006; Kim et al. Reference Kim, Stewart, Kim, Yang, Shin, Kim and Yoon2007; Conway et al. Reference Conway, Hammen, Brennan, Lind and Najman2010; Priess-Groben & Hyde, Reference Priess-Groben and Hyde2013), were not considered. Consequently, our findings do not rule out the possibility that other sources of genetic variation interact with SLEs to increase depression risk. This may explain the discrepancy between our findings and the findings of Kendler et al. (Reference Kendler, Kessler, Walters, MacLean, Neale, Heath and Eaves1995), who used an indirect measure of genetic predisposition that would have incorporated all possible sources of genetic variation.
Our results appear inconsistent with those of Caspi et al. (Reference Caspi, Sugden, Moffitt, Taylor, Craig, Harrington, McClay, Mill, Martin, Braithwaite and Poulton2003), as well as many other published candidate gene G × E studies (although we did not specifically test any associations with the candidate gene polymorphisms). However, the candidate gene approach for studying G × E interactions may lack statistical power, which raises the possibility that previous positive findings may have been false positives (Duncan & Keller, Reference Duncan and Keller2011). Contrary to our initial hypothesis, our results are also inconsistent with the findings of Peyrot et al. (Reference Peyrot, Milaneschi, Abdellaoui, Sullivan, Hottenga, Boomsma and Penninx2014), who reported a significant interaction between polygenic risk and childhood trauma. This suggests that polygenic risk × stress effects could be specific to certain developmental periods – a hypothesis which has also been suggested as a possible explanation for the inconsistent replication of Caspi et al.'s (2003) 5-HTTPR × stress interaction (Brown & Harris, Reference Brown and Harris2008; Karg et al. Reference Karg, Burmeister, Shedden and Sen2011).
We found no evidence to suggest that SLEs mediate the association between genetic risk and depression, which has been suggested elsewhere (Kendler & Karkowski-Shuman, Reference Kendler and Karkowski-Shuman1997; Kendler, Reference Kendler2001; Kendler & Baker, Reference Kendler and Baker2007). It should be noted, however, that our measure of SLEs assessed only whether an SLE had occurred, without inquiring about how the participant experienced the event. Previous research suggests that it is the subjective appraisal of SLEs that may mediate the association between genetic risk and depression (Conway et al. Reference Conway, Hammen, Espejo, Wray, Najman and Brennan2012), which we would not have been able to detect in this study.
The results of this study should be interpreted in light of several limitations. First, depression was assessed differently in our discovery and target datasets. The PGC samples used structured interviews to identify depression cases, while depression symptoms in HRS participants were measured using a shortened version of the CES-D. These two methods for case definition yield results that are correlated, but not equivalent (Radloff, Reference Radloff1977; Turvey et al. Reference Turvey, Wallace and Herzog1999). Another limitation of the CES-D is that it only assesses depressive symptoms within the past week. As such, it may have missed depressive symptoms that occurred in the wake of a stressful event but had already dissipated by the time the HRS interview was given.
Second, our measure of SLEs included all events experienced within the past 2 years. Previous research suggests that the depression-inducing effects of SLEs may be limited to the month in which the event occurred (Kendler et al. Reference Kendler, Kessler, Walters, MacLean, Neale, Heath and Eaves1995). Hence, it is possible that the effect of SLEs, and any interaction with polygenic risk, may have been attenuated by the length of time between our assessment of depression and the experience of the stressful event(s). In addition, although it is clear that the SLEs preceded our measure of depression, we cannot be certain that the onset of the depression did not precede the SLE. This limits our ability to make inferences regarding whether or not the association between SLEs and depression is causal. Previous research has suggested that depression may in fact increase the probability of experiencing an SLE, particularly an SLE that is influenced by the actions or behavior of the individual (such as divorce or job loss) (Hammen, Reference Hammen1991, Reference Hammen2006; Middeldorp et al. Reference Middeldorp, Cath, Beem, Willemsen and Boomsma2008; Liu & Alloy, Reference Liu and Alloy2010).
Despite the large sample sizes of both our discovery and target datasets, it is still possible that we were underpowered to detect a significant interaction effect. Simulation studies indicate that detecting statistically significant G × E interactions may require even larger sample sizes than those required to detect significant main effects, particularly when the environmental factor is measured with more than a small amount of error (Luan et al. Reference Luan, Wong, Day and Wareham2001). Moreover, the predictive ability of our polygenic scores may have been limited by the sample size of the discovery dataset (Chatterjee et al. Reference Chatterjee, Wheeler, Sampson, Hartge, Chanock and Park2013; Dudbridge, Reference Dudbridge2013) and the inherent heterogeneity of the MDD phenotype (Levinson et al. Reference Levinson, Mostafavi, Milaneschi, Rivera, Ripke, Wray and Sullivan2014), which probably contributed to the modest polygenic effects.
Finally, our sample consisted almost entirely of older adults, with an average age of 64 years. Considering that the median age of onset for depression is approximately 32 years (Kessler et al. Reference Kessler, Berglund, Demler, Jin, Merikangas and Walters2005), few if any of our cases are likely to be first-onset. This could potentially make an impact on the generalizability of the findings, as there is evidence to suggest that the association between life stress and depression is different for first-onset versus recurrent episodes (Post, Reference Post1992; Stroud et al. Reference Stroud, Davila and Moyer2008). Several previous studies have detected significant G × E interactions among older adult populations, however (Nakatani et al. Reference Nakatani, Sato, Sakata, Shiotani, Kinjo, Mizuno, Shimizu, Ito, Koretsune, Hirayama and Hori2005; Kim et al. Reference Kim, Stewart, Kim, Yang, Shin, Kim and Yoon2007). It is also possible that among older adults, depressive symptoms may be more commonly attributable to organic causes (such as cerebrovascular or neurodegenerative disease) than to genetic factors relative to younger individuals. We attempted to minimize this difference by excluding HRS participants who reported a history of stroke, transient ischemic attack or memory-related disease.
In conclusion, the results of this study suggest that polygenic risk and recent, adult-onset SLEs are each significant, independent predictors of depressive symptoms, with no evidence to suggest that the association between polygenic risk and depressive symptoms is moderated by SLEs. Future research should determine the extent to which this finding generalizes to samples of other ages, and also investigate further the extent to which life stress moderates the association between other sources of genetic variance (e.g. rare variants, copy number variation, gene × gene interactions) and depression.
Supplementary material
For supplementary material accompanying this paper visit http://dx.doi.org/10.1017/S0033291714002839
Acknowledgements
The authors would like to thank Dr Tamar Mendelson, Pia Mauro, Sarah Murray, Angela Lee Winn, Stacey Lloyd and Emma Stapp for their help editing the manuscript. This study used publicly available data from the Psychiatric GWAS Consortium, which was supported by grant funding from the National Institute of Mental Health (grants NIMH MH085520 and NIMH MH080403), and the HRS, which was supported by grant funding from the NIA (grant no. NIA U01AG009740). While conducting the analyses described in the manuscript, the first author received funding for doctoral training from the National Institute of Mental Health (Psychiatric Epidemiology Institutional Training Grant NIMH 2T32MH014592-36).
Declaration of Interest
None.