Implications
This review describes how dairy herd records, measurement of metabolic compounds and detection of the physiological state of a cows reproductive tract by ultrasonography can be used to monitor reproductive and nutritional management of a herd. It guides the selection of timely key performance indicators (KPIs) that monitor specific events in the period after calving and during the service period. It suggests the development of new KPIs to exploit research findings to improve on-farm performance. By deploying these findings farmers could improve cattle fertility and herd profitability.
Introduction
Good herd management is vital for good herd reproductive performance. Which measurements are made, how they are monitored and acted upon are the keys to identifying factors reducing performance in any business. International and national data sets indicate a decline in cattle fertility which has often been attributed to increased milk yield over the same period. However, this is disputed and health, yield and fertility may go together within herds (López-Gatius et al., Reference López-Gatius, García-Ispierto, Santolaria, Yániz, Nogareda and López-Béjar2006). Data from UK milk recorded herds suggest no difference in mean calving index for herds of different mean lactation yields but a trend for herds with higher milk per cow per year to have a shorter mean calving index as animals are at a higher average daily yield if they conceive early and re-calve promptly without an extended dry period (Table 1). Surveys have identified a wide range of farm factors associated with fertility; for example, feed (bunk) space per cow, temperature for thawing semen, percentage of cows with low body condition scores (BCS), number of cows in the maternity pen, strategy for using a clean-up bull, and milk yield at first service, as well as the number of people and time spent detecting oestrus (Caraviello et al., Reference Caraviello, Weigel, Craven, Gianola, Cook, Nordlund, Fricke and Wiltbank2006). Current calving pattern and abnormal inter-oestrus intervals, indicating inaccuracies in detecting oestrus, have recently been identified as the main factors related to poor fertility performance in Ireland (Lane et al., Reference Lane, Crowe, Beltman and More2013). These and other data indicate the wide range of herd records, farm observations and management factors relevant to maximising herd fertility.
Mean calving index of herds with different lactation yields and milk per cow per year produced for herds milk recording with National Milk Records UK (n=200 per group randomly selected)

Data for year to 31 August 2013. There is no change in mean calving index with increasing lactation yield but there is a trend for herds with higher milk per cow per year to have a shorter mean calving index as animals are at a higher average daily yield if they conceive early and re-calve promptly without an extended dry period.
The aim of this review was to consider currently used fertility key performance indicators (KPIs) generated from herd-level data along with other performance monitors and discuss their usefulness. Consideration was given to recent research findings that indicate possible areas for development of cow and herd-level measuring and monitoring strategies. The clinical utility of physiological data obtainable from careful analysis of ultrasonographic images collected at fertility monitoring visits has also been discussed.
Reproductive targets
The target reproductive performance for a herd depends on the farming system adopted, which in turn is dependent on the milk market a farm is supplying. The two extremes are seasonal calving, to synchronise peak lactation with maximum grazed grass availability to produce milk for processing and all-year round calving to fullfil a ‘level dairy’ supply contract (often ±10% of a set level without penalty) to meet an even demand for liquid drinking milk.
Reproduction in dairy cows has two main outcomes: (1) produce a calf that has economic value (that may be a heifer replacement), and (2) stimulate a new lactation. The relative importance of these two events depends on the herd replacement rate and sourcing policy, the availability of heifer replacements (modified by use of sexed semen) and the persistency of the lactation. A more global consideration is the environmental impact of beef production from the dairy v. the beef herd. As the animal maintenance cost of the dam is shared between milk and calf production, the perceived environmental impact of beef from the dairy herd is lower than that from dedicated beef herds (Zehetmeier et al., Reference Zehetmeier, Baudracco, Hoffmann and Heißenhuber2012). If cows had persistent lactations and did not require re-calving to stimulate milk production, periodic calving to produce beef calves with a short dry period may be environmentally and economically sustainable. However, the interactions between these systems are complex (Zehetmeier et al., Reference Zehetmeier, Baudracco, Hoffmann and Heißenhuber2012).
The animals within the herd with fertility and other problems need to be identified. By determining what risk factors they have compared with their better performing herd mates, it may be possible to gain an insight into the underlying causes. Thus, enabling formulation of strategies to focus intervention on those animals that would benefit from it without risking reducing the performance of others. Many risk factors have been identified experimentally (Dobson et al., Reference Dobson, Smith, Royal, Knight and Sheldon2007) but those actively reducing fertility on a specific farm need to be ascertained from contemporaneous data. It is sobering that the majority of commercial animals have identifiable problem(s) after calving (Peake et al., Reference Peake, Biggs, Argo, Smith, Christley, Routly and Dobson2011).
There is also a cost to an animal becoming pregnant. Under circumstances where costs of a pregnancy are high and benefit is low, re-serving animals may not be economically justified (de Vries, Reference de Vries2006). Costs of a pregnancy are higher where there are high staff and semen costs, low pregnancy rate, and the benefit of a pregnancy may be low when there is only a small difference in cost between an in-calf (or freshly calved) cow and the income from a cull cow and cows have a flat lactation curve so the difference between peak and late lactation is small and purchase costs of replacement animals are low. Some farmers maintain that pregnancy rates are too low if animals are served too soon after calving, so they employ a long voluntary waiting period (VWP). This can exacerbate post-calving problems in subsequent lactations as the cows will have extended lactations and may put on body condition as they are fed for a higher yield than they are producing. Their subsequent lack of dry matter intake and BCS loss after calving will reduce the likelihood of establishing a pregnancy (Opsomer et al., Reference Opsomer, Grohn, Hertl, Coryn, Deluyker and de Kruif2000).
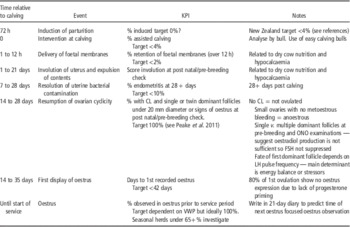
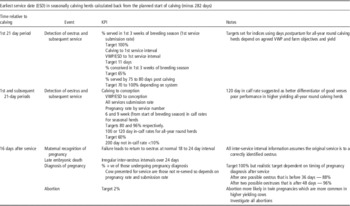
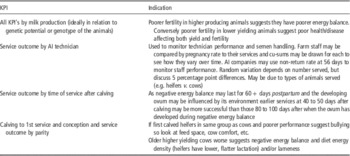
After calving, a cow has to overcome a series of physiological hurdles for conception to take place (Table 2). Failing to overcome these means an animal is less likely to recommence ovarian cyclicity and conceive at the required time. Thus, the time from calving to overcome these hurdles and the proportion of animals that have done so by a set time can be used as performance indicators as well as providing an early warning system. Tables 2 to 4 outline which KPIs can be used to monitor the postpartum and service periods and how comparison of performance between different herd cohorts can be used to identify specific management issues.
KPI to monitor postpartum events

KPI=key performance indicator; CL=corpus luteum; VWP=voluntary waiting period.
Key performance indicators to monitor service period events

End of voluntary waiting period (VWP) in all-year round herds (42 to 60 days after calving).
Examples of possible analyses of KPIs by cow herd subgroup

KPI=key performance indicator; AI=artificial insemination; cu-sum=cumulative sum.
Research findings regarding causes of subfertility need to be used to generate new predictive KPIs which can be utilised to pre-empt reproductive failure, rather than the current ones which tend to only describe historic events. Monitoring risk factors for poor fertility such as metabolic disease, lameness, mastitis and other infectious disease need to be part of the herd monitoring system.
Types of KPIs
Traditionally, fertility KPIs are produced once an animal has undergone pregnancy diagnosis. This is possible from 4 weeks after service but may be undertaken at the end of the breeding period. Annual averages have also been quoted so changes in KPI values have been slow to reflect the current events. Thus, these KPIs are too historic to be used to actively manage fertility. This has been addressed in some computer programmes by production of 3 months and well as 12 months rolling averages and use of control graphs showing trends (de Vries and Conlin, Reference de Vries and Conlin2003).
KPIs can be divided into (i) those that determine the proportion of a defined cohort that have a particular outcome to an event (such as proportion pregnant to an insemination), and (ii) the average time to that event for all animals within a defined cohort. This may be to the event per se (e.g. calving to first service) or to a successful event (e.g. calving to conception interval). These two types can be combined in KPIs determining the proportion that have had a particular outcome by a determined time, for example, the percentage of animals which have conceived by 100 days after calving, the ‘100 day in-calf rate’. These can be taken from failure plots of calving to conception for a cohort (Figure 1). The exact number of days after calving to be used has been hotly debated. A figure of 100 days seems appropriate for seasonal calving herds but 120 days may better differentiate adequately performing high yielding all-year round calving herds. If the performance of a cohort is monitored, then time-to-event data will get worse as the average time from calving of the cohort gets longer and more animals conceive. Management decisions regarding culling v. continuing to serve also impact on the KPI and its interpretation. Censoring the data using 200 and 300-day in-calf rates allow comparisons between herds. The number of animals that are culled for failure to conceive should also be monitored. The number of animals calved and ever considered eligible to be served should be used as the denominator (rather than the number that survive to these times) to make the KPIs relatively insensitive to the effects of involuntary culling. Traditionally, time from calving is used as the start point. However, a recent study suggested that the percentage of the herd pregnant by 30 days after the end of the VWP was the best single indicator of herd performance (Löf et al., Reference Löf, Gustafsson and Emanuelson2012). The study tested the discrimination of a range of KPIs to 18 different combinations of management and physiological efficiency. It will be interesting to see if this KPI is adopted and found to be useful with real-world combinations of data.
Example failure curve showing the % of a cohort of animals having a first service (red line) and conceived (blue line) with time after calving from one farm. Value under the blue line at 100 days is the 100 day in calf rate. Value at 200 days is the 200 day in calf rate (Programme: TotalVet QMMS/SUMIT Software).

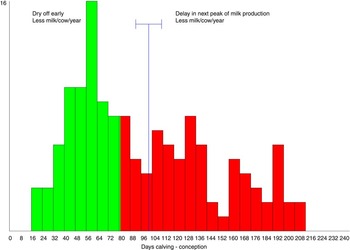
Fertility data are skewed by management decisions to start re-breeding at a specific time or date postpartum and also by a minority of very poorly performing animals. Median values are more reflective of the performance of the majority of animals and thus non-parametric and survival analysis methods are best suited for analysis. However, the spread of the data is also important for example the range of calving to conception interval for animals in a herd calving in 1 year (Figure 2). If an animal conceives early it will dry off early, have a short lactation and produce less milk. Cows that do not conceive until after a specified target will produce less milk as they have more days of lower yield. A herd with a mixture of cows at these two extremes may have the same median calving to conception interval as a herd where all cows were on target but would have lower production per cow per year. In seasonally calving herds, these animals will also calve either too early or too late to make full and efficient use of the grazed feed supply. A tight pattern is also important to reduce disease build up and the need for prolong calving supervision.
Example range of calving to conception intervals for all animals calving on a single herd in a 12 month period. Green data from animals below 80 days, red above. Mean (blue line) 102 days, median 81 days (Programme: Interherd, Pan Livestock Services).

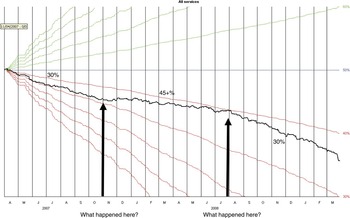
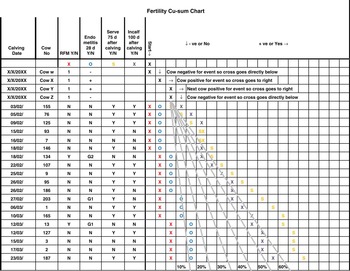
The size of the cohort and time over which cohorts are selected to produce a KPI are important for both validity and timeliness. Large cohort size reduces the effect of natural variation but in small herds this means that the cohort covers a long time period, so problems are not detected quickly. Conversely, natural variation is not identified as ‘a problem’ either. The cohort is traditionally all the animals that have had a particular event occur in a calendar year or rolling 12-month period. For example, the interval from one calving to next calving of all animals that calve in a calendar year is the calving index for a herd. Conceptions that make up the current calving index thus occurred 9 to 21 months earlier. The management factors that may have led to poor oocyte quality and thus failure to conceive will have occurred at least 9 to 24 months ago. Changing current practices in response to historic rather than contemporary data runs the risk of making erroneous decisions. This has been partially addressed in some computer programmes by production of 3 month as well as 12-month rolling averages. Rather than analysing data from defined cohorts, control charts, such as cumulative sum (cu-sum) charts can be used to emphasise changes in data. They can be produced for any binary outcome but they can also be used to show an increase or decrease from a pre-determined or rolling mean or median over time. Identifying the date when the gradient of the graph changes allows the time the trend in fertility changed to be pinpointed. If management changes, such as alterations in feeding (silage clamp/bunker or grazing paddocks, grass growth rates) are recorded in the farm diary and marked on the graph, correlation with fertility changes can be assessed. This can be performed for higher and lower yielding cohorts, heifers and cows, etc. Cu-sums have traditionally been used to show outcome of insemination over time (Figure 3) but could also show incidence of peri-parturient diseases such as hypocalcaemia, retained foetal membranes, endometritis and whether an event had occurred by a specific time (e.g. served by 80 days, in-calf by 100 days). Plotting data on the same graph by calving date allows visual assessment of correlations between events (Figure 4).
Cumulative sum (cu-sum) control chart for service outcome over time on a single farm (black line). If the service outcome is positive, the line moves up, negative and the line moves down. Services are in date order but even space given for each month. Standard green, blue and red lines are calculated for different pregnancy rates and used to compare with the farm data. Arrows point to where the gradient of the black line changes indicating change in herd pregnancy rate (Programme: Interherd, Pan Livestock Services).

Cumulative sum (cu-sum) control chart for periparturient disease and service and conception by target time after calving. Explanation of how a cu-sum is constructed are on the first four lines and blank chart can be printed off and used in the farm office. Endometritis is graded on a 0 to 3 scale (Sheldon et al., Reference Sheldon, Price, Cronin, Gilbert and Gadsby2009). Hypocalcaemia and other metabolic conditions can be added using additional colours and columns (Programme: Microsoft Excel).

Using current software packages, it is still a matter of judgement how long a trend needs to occur before remedial action is indicated. Statistical rules to determine if a parameter has altered sufficiently to warrant intervention have been suggested by de Vries and Conlin (Reference de Vries and Conlin2003). These authors also assigned financial value to the benefit early detection could produce. To the author’s knowledge such charts, with control limits to formularise the trigger for intervention, have not yet been incorporated into any commercially available software.
Discrepancies in terminology and definitions of KPIs
The terminology used to describe KPIs is not internationally agreed. The term ‘rate’ suggests amount per unit of time. Most ‘rates’ calculated for fertility KPIs are the proportion having an outcome in a set time period and would more accurately be described as a ‘risk’ of an event occurring in that period. This terminology is used by one computer system (Dairy Comp 305, Valley Agricultural Software). The percentage of ova that are fertilised by a correctly timed service may be as high as 90% (Sreenan and Diskin, Reference Sreenan and Diskin1983). A variable proportion of these ‘conceptions’ are lost before diagnosis of ‘pregnancy’. The physiologically purist view is that the percentage of animals served that are subsequently detected as pregnant should be termed ‘pregnancy rate’ to ensure it is understood that the percentage of services resulting in an initial conception (conception rate) is higher and not measurable on farm. Good management, nutrition and disease control may reduce the number of conceptions lost before pregnancy diagnosis. This appears to be an uphill battle, as recently pregnancy rate (shortened to ‘preg rate’ in the United States) has been used to describe the percentage of animals eligible for service (i.e. after the earliest service date (ESD) or VWP but not pregnant) that are served within a rolling 3-week period and are subsequently detected as pregnant. It has previously been termed ‘reproductive efficiency’ (Anon., 1984) or ‘fertility factor’ (Williams and Esslemont, Reference Williams and Esslemont1993). The percentage of animals served in a 3-week period of those eligible is also alternatively called ‘submission rate’ or ‘oestrus (heat) detection rate’ or ‘insemination rate or risk’. Disagreements regarding terminology should not detract from acknowledging that these are the most timely indicators of fertility of a herd as they are generated for data 3 weeks previously for ‘first services submission rate’ and immediately after pregnancy diagnosis for the ‘all services submission rate’ and ‘21-day preg rate’. The definition used in each situation must be explicitly stated until an international consensus is agreed.
The outcome of service cannot currently be determined until 4 weeks after service by b-mode ultrasonography (Ginther, Reference Ginther1998), and is often delayed until the end of the breeding period. Thus, there is an inherent delay in identifying changes in conception rate. Using non-return to oestrus as a proxy for pregnancy carries the danger of interpreting other causes of anoestrus as pregnancy. Dairy Comp 305 (Valley Agricultural Software) uses changes in the proportion of animals returning to oestrus as an early warning of a reduction in fertility. This give the possibility of early warning if conception rate is the only indicator to be altered, but has potential for false positives or negatives if efficacy of detection of oestrus changes.
Fertility KPIs as indicators of animal welfare
Fertility KPIs may also be indicators of animal welfare (de Vries et al., Reference de Vries, Bokkers, van Schaik and de Boer2011). Specifically the 120-day in-calf rate and the percentage of heifers not mated by 17 months of age, have been suggested as indicators of poor animal welfare in a herd (Nyman et al., Reference Nyman, Lindberg and Sandgren2011). The intensity of oestrus may also be related to an animal’s flight distance and an indicator of welfare (Garcia et al., Reference Garcia, Hultgren, Fällman, Geust, Algers, Stilwell, Gunnarsson and Rodriguez-Martinez2011). This is not surprising considering the known interactions between disease and welfare, but conversely it emphasises that any reproductive manipulation may not be effective if the welfare and management of the animals is not already good. For example, the efficacy of systems to detect oestrus are reduced when cows are lame (Holman et al., Reference Holman, Thompson, Routly, Cameron, Jones, Grove-White, Smith and Dobson2011).
Induction of parturition to maintain tight calving patterns became very common in New Zealand and concerns regarding consumer perception resulted in national targets of under 4% of any herd being induced have been set by the industry. There are welfare concerns regarding other fertility practices (Higgins et al., Reference Higgins, Ferguson, Smith and Green2013). Some organic farming standards do not allow management use of exogenous reproductive hormones. The percentage of animals receiving treatment for induction of oestrus or fixed time insemination protocols may become KPIs to monitor these practices in the food supply chain in the future.
Data availability
Data available varies greatly between farms. The fullest data set possible increases the accuracy of the data produced and ensures that conclusions from analyses are correct. In EU countries, there is a statutory duty to record the birth of an animal and register the animal and its dam on a national database. These data can be used to produce a crude distribution of calvings per month and inter-calving intervals for individual animals to produce a herd calving interval (Gates, Reference Gates2013). If artificial insemination (AI) is used, semen deliveries should be recorded and an inventory kept allowing services per conception to be calculated on a herd level and individual animal services per conception recorded. If natural service is used, only observed mating will be recorded and used as the denominator for services per conception.
Detection of oestrus
It is important to determine which behavioural signs are being used on the farm to identify oestrus and the time allocated to this task as this determines the likelihood that oestrus will be observed (Roelofs et al., Reference Roelofs, Van Eerdenburg, Hazeleger, Soede and Kemp2006). Animals may be erroneously classified as acyclic if observations are not sufficiently frequent. Secondary behaviours displayed at oestrus are well characterised and observation for them can increase the rate of detection of oestrus, but animals served that only exhibit them have a lower pregnancy rates than those showing standing oestrus (Garcia et al., Reference Garcia, Hultgren, Fällman, Geust, Algers, Stilwell, Gunnarsson and Rodriguez-Martinez2011). The ability of animals to join a sexually active ‘bulling group’ may also influence accuracy of detection of oestrus as the size of the active group influences the duration of activity (Sveberg et al., Reference Sveberg, Refsdal, Erhard, Kommisrud, Aldrin, Tvete, Buckley, Waldmann and Ropstad2011). Recording of oestrus observed before the ESD or VWP allows focused observation for signs of oestrus 18 to 24 days later. If farm routine, passageway space and lighting allow, metoestrous bleeding can be observed in many animals that are missed during observation for oestrus and a note to watch them for return to oestrus from 16 days can be made.
Automated systems to detect oestrus are increasing in popularity and their use has recently been reviewed (Saint-Dizier and Chastant-Maillard, Reference Saint-Dizier and Chastant-Maillard2012). Such systems can increase reproductive performance compared with use of synchronisation protocols (Neves et al., Reference Neves, Leslie, Walton and Leblanc2012). Performance is increased if data from human observations are also used. Performance is reduced in lame and high yielding animals, and those in poor BCS. A quarter of animals may also exhibit no oestrus behaviours before ovulation (Holman et al., Reference Holman, Thompson, Routly, Cameron, Jones, Grove-White, Smith and Dobson2011). Some systems now email or text action lists of animals to serve and these can be used to assess the number of animals served compared with those indicated as a measure of farm staff compliance. Many units have reduced number of services at weekends (personal observation) and this metric may modify farm staff behaviour.
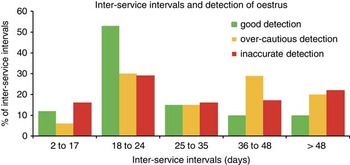
The capabilities of farm staff and what support they require also need to be assessed. Recording service outcome alongside who identified the oestrus (both staff and any automated system, and the signs observed) and who inseminated the animal will allow performance of individual staff to be measured. This can also instil healthy competition but successful pregnancy rather than just submission for service needs to be used if any incentive payment system is instigated. The timing between services, the inter-service interval, can indicate the efficacy of detection of oestrus. Interpretation of inter-service intervals histograms, available in several programmes, are shown in Figure 5. Embryonic loss can also affect these patterns, so other data not affected by embryonic loss, such as first service submission rates, should also be used to assess efficacy of detection of oestrus.
Interpretation of inter-service interval histograms. Ideally repeat services would occur in the 18 to 24 day period; target over 55%. Over-cautious includes missed events and those considered weak by a farmer so they decide not to service the animal and wait 18 to 24 days to see if the animal shows signs again, hence higher percentage at 36 to 48 days than those with good detection of oestrus. Adapted from Anon, (1984).

Studies from diverse populations indicate that around 10% of animals are submitted for AI when milk progesterone is high, suggesting they are in the luteal phase. Protocols for the use of milk progesterone measurement for primary detection of oestrus or as a check for correct identification of oestrus by other methods, have been available for many years (Williams and Esslemont, Reference Williams and Esslemont1993). They have not been widely adopted due to difficulties of reliably measuring the hormone in a timely fashion on-farm. Two recent developments may alter this. Herd Navigator (Lattec I/S, Hillerød, Denmark) is an on-farm system that measures milk progesterone, β-hydroxbutyrate (BHB), urea and lactate dehydrogenase in samples automatically collected during milking. Predictive models have been generated to underpin the interpretation of results (Friggens et al., Reference Friggens, Bjerring, Ridder, Hojsgaard and Larsen2008). The financial returns on use of the system have been calculated but the initial capital cost may slow adoption. Second, there are lateral flow milk progesterone assay dip stick tests that can be stored at ambient temperature (Ridgeway Research Ltd, St Briavels, Gloucester, UK). The strip gives an indication of high or low concentration. Neither product is likely to be able to predict ovulation and optimum time for service (Roelofs et al., Reference Roelofs, Van Eerdenburg, Hazeleger, Soede and Kemp2006) but will focus farm staff attention on the correct animals and indicate if an animal is returning to oestrus at the normal interval after service. Accurate determination time of onset of ovarian cyclicity, prolonged luteal phases and type of ovarian cyst may allow earlier and more rational intervention in animals with postpartum reproductive problems.
Occurrence of peri-parturient diseases that are associated with reduced fertility should be recorded. Mobility scoring is being increasingly practiced on farms and is a requirement of some milk supply contracts. Early detection and treatment of lameness to reduce severity may prevent the deleterious effects on fertility.
Monitoring metabolic and nutritional status
Metabolic profiles were developed in the United States and United Kingdom in the late 1960s facilitated by the invention of auto-analysers allowing cost-effective measurement of a range of compounds in a single sample by one laboratory. The first research relating these measurements to fertility was published in 1977 (Rowlands et al., Reference Rowlands, Little and Kitchenham1977). Interestingly a greater emphasis was placed on glucose and blood cell parameters and none measured the most common metabolites now used, BHB and non-esterified fat acids (NEFAs). Complete profiles are currently advocated to assess the adequacy of the transition period management (Macrae et al., Reference Macrae, Whitaker, Burrough, Dowell and Kelly2006). Research has tended to focus on identification of metabolites as predictors of reduced fertility in individuals or herds and linked these measurements to evaluation of the causal mechanisms linking nutrition and fertility. This review will focus on practical approaches to interpretation of metabolites in blood and milk in field situations and some additional or alternative strategies to identify negative energy balance.
The most commonly measured blood metabolites are BHB, released from the liver as an alternative energy source to glucose, and NEFAs released by lipolysis of fat store. BHB tends to be elevated postpartum while NEFAs can be elevated both prepartum and postpartum. However, recent studies suggest NEFAs have higher sensitivity and specificity for identifying animals with postpartum health problems (Chapinal et al., Reference Chapinal, Carson, Duffield, Capel, Godden, Overton, Santos and LeBlanc2011; Jackson et al., Reference Jackson, Wills, Kendall, Green, Murray and Dobson2011). The pros and cons of their measurement methods have recently been reviewed (McArt et al., Reference McArt, Nydam, Oetzel, Overton and Ospina2013). Many practitioners and farmers are adopting the use of cow side BHB tests using milk or urine dip sticks or electronically read enzymatic blood measurement (Precision Xtra (Abbott Diabetes Care, Inc., Alameda, CA, USA) or Optium Xceed (Abbot Laboratories, Maidenhead, Berkshire, UK)); as no cow-side NEFA tests are currently available. Analysis of strategic NEFA samples in pre-calving cows may be triggered if the incidence of elevated BHB (over 1.2 to 1.4 mmol/l) are detected. There is much debate regarding sampling strategy. Random sampling of cattle can provide an indication of herd incidence and trigger a review of transition cow management. Monitoring every animal at 7 to 14 days postpartum will allow interventions such as oral propylene glycol to be administered. This was associated with a reduction in incidence of clinical ketosis, a faster resolution of sub-clinical ketosis and 40% reduction in the number of animals with left displacement of the abomasums. The significant reproductive outcome was a 30% increase in the likelihood of conception at first service. A large number of animals needed to be treated by oral drenching but modelling suggested an economic benefit of doing so (McArt et al., Reference McArt, Nydam, Oetzel, Overton and Ospina2013). Incorporation of propylene glycol into feed of the at-risk group may be an alternative strategy but whole herd supplementation has not shown consistent reproductive benefits. Although BHB has been found to be a better predictor of calving to conception interval than milk constituents (concentrations of fat, protein and urea), milk constituents are measured on a monthly basis on many farms so are available indicators. Some authors have found fat : protein ratios to be more correlated with energy balance than concentrations of protein or fat alone while other dispute this (Duffield and Lumsden, Reference Duffield and Lumsden1997). Heuer et al. (Reference Heuer, Schukken and Dobbelaar1999) found that cows with fat : protein ratios over 1.5 were more likely to develop ovarian cysts, and had a lower first service conception rate. Fat : protein ratios are produced by many computer-based milk constituent monitoring programmes. Lower milk protein percentage in the first 2 months postpartum has also been identified as a risk factor for delayed return to ovarian cyclicity (Opsomer et al., Reference Opsomer, Grohn, Hertl, Coryn, Deluyker and de Kruif2000).
Hypocalcaemia is a risk factor for RFM, endometritis and subsequent reduced fertility (Hayes et al., Reference Hayes, Christley and Dobson2012). Many farmers treat animals at 3rd or more calvings with oral calcium chloride boluses or subcutaneous calcium borogluconate. However, it is not known if treatment at this stage counteracts the deleterious effects of sub-clinical hypocalcaemia. Monitoring for subclinical hypocalcaemia before treatment may give an indication if preventative strategies are working, as successful treatment does not prevent the deleterious effect of hypocalcaemia on fertility. The mineral content of forages vary between fields, and depend on crop maturity, time of year and number of previous cuts taken, mineral analysis of the forage fed to dry cows may identify periods where a batch of forage represents a particular risk of utilised control measures being insufficient. The concentrations of urea in milk may also be monitored as elevated concentrations have been associated with reduced fertility and recently, a subset of repeat breeder animals with abnormal oocytes have been identified that have high milk concentrations of urea (Kurykin et al., Reference Kurykin, Waldmann, Tiirats, Kaart and Jaakma2011), however, cows may adapt to high protein diets reducing the possible impact on fertility (Westwood et al., Reference Westwood, Lean and Kellaway1998) so steady state high concentrations of milk urea may not be as deleterious as acute changes. A ratio of concentrations of milk urea to BHB has been suggested as a predictor on time to commencement of luteal activity postpartum (Jackson et al., Reference Jackson, Wills, Kendall, Green, Murray and Dobson2011). This warrants further investigation.
Interpretation of milk constituent data are limited by monthly sample collection under Dairy Herd Improvement scheme/milk recording schedules. More frequent measurement using in-line near infrared spectrophotometry (e.g. Afilab, Afimilk) may provide a better predictor of fertility as data would be obtained at a similar time postpartum for all animals. Initial findings suggest that increased milk lactose percentage in the 2nd week postpartum and decreased milk protein percentage in the 3rd week postpartum are associated with an increased interval to commencement of luteal activity (Russell, Dobson and Smith, unpublished observation). Also increased milk yield in the first 2 weeks postpartum and increased milk fat percentage in the 3rd week postpartum and reduced protein percentage in the 4th week postpartum were all associated with an increased calving to conception interval. Studies are ongoing.
Data from automated weighing systems at the exit to milking parlours have recently been shown to give a good indication of energy balance in real time (Thorup et al., Reference Thorup, Højsgaard, Weisbjerg and Friggens2013). Adoption of any commercial development of these systems should be strongly considered by farm managers as an alternative to BCS. Change in BCS and BCS itself currently give the best indication of energy balance and likelihood of metabolic and reproductive problems (Roche et al., Reference Roche, Kay, Friggens, Loor and Berry2013). Ideally animals should have BCS assessed at calving and monthly for the first 3 months to assess BCS loss then 3 months before drying off. This allows time for management changes to prevent the animal drying off and subsequently calving in an inappropriate body condition. If no records of BCS are available, BCSs can be determine from a selection of animals from each key management group to assess the potential amount of BCS change occurring, but this may not reflect relative differences throughout the year when food availability may vary. However, it may stimulate the veterinary surgeon and farm staff to commence longitudinal monitoring as suggested above. There is much variation in published target BCS scores which may reflect underlying differences in scoring, breed and management but reasonable targets would be a BCS ‘on a 1 to 5 scale’ of 2.5 throughout lactation for high yielding Holstein cows (and 3 for animals of lower genetic merit for yield and other breeds) with no more than a 0.5 change (Garnsworthy, Reference Garnsworthy2006). A specific target, for example no more than 10% of animals more than 0.5 score away from the target BCS and no more than 10% losing 1 or more scores, could be set. However, this suggests that 10% of animals in metabolic compromise is acceptable. The best performance is 100% compliance with targets and is the ultimate target.
Ultrasonography of the reproductive tract
The use of ultrasonography has added another dimension to determination of the physiological state of the reproductive tract and clinical diagnosis of pathological conditions. As such, it allows determination of the proportion of animals exhibiting normal postpartum uterine involution and return to cyclicity (Crowe, Reference Crowe2008; Sheldon et al., Reference Sheldon, Price, Cronin, Gilbert and Gadsby2009) as an assessment of adequacy of peri-parturient management. The use in clinical practice of information obtained from research may be limited by the frequency of reproductive examination, the skill of the operator and the time/cost the farmer is prepared to allocate to the procedure. A cost/benefit assessment has not been undertaken for the more detailed examinations now possible with the advent of Doppler and high definition ultrasound equipment.
Ultrasonography allows more reliable differentiation of ovarian structures than palpation (Ribadu et al., Reference Ribadu, Ward and Dobson1994) although a level of skill and care is needed to differentiate follicles from blood vessels and the lymphatic system. Blood vessels enter the ovary at the ovarian pedicle and these may be mis-identified as a new emerging wave of small follicles. The corpus luteum (CL) is visible with care from the point of formation (76% on day of ovulation; Ginther, Reference Ginther1998). However, this is much easier to accomplish if the previous location of the ovulatory follicle was known, requiring frequent examination and recording of structures. For a diagnosis of anoestrous, careful scanning of the ovaries is required but conversely identification of a small amount of luteal tissue does not guarantee normal cyclicity. The first CL postpartum is often smaller and generates lower plasma/milk concentration of progesterone than normal. Usually, CL diameter is highly correlated with concentration of progesterone (Ginther, Reference Ginther1998), however, at the end of the cycle concentration of progesterone falls 2 to 3 days before reduction in CL size (Ribadu et al., Reference Ribadu, Ward and Dobson1994). The echogenicity of luteal tissue is higher at formation, decreases on Day 2 then remains consistent during the luteal phase. It falls again a day or two before the fall in concentration of progesterone. As the CL diameter reduces after luteolysis, the echogenicity increases again. Structurally the CL is usually detectable until the day of ovulation but is under 20 mm in diameter. Changes in CL echogenicity have been detected using computer image analysis but would require consistent set up of the ultrasound equipment and monitor if they were to be used as an indicator of age of CL clinically by eye. Echotexture or heterogeneity (variation) of the echogenicity of the structure measured by the standard deviation of the mean pixel value has been studied and is possibly a more useful indicator than echogencity itself (Siqueira et al., Reference Siqueira, Torres, Amorim, Souza, Camargo, Fernandes and Viana2009). During spontaneous luteolysis, pulses of prostaglandin (PG) appear to be associated with temporary increases in CL blood flow, then CL blood flow declines in parallel with concentration of progesterone. Thus, Doppler ultrasonography may not give more clinically useful information than CL diameter alone (Bollwein et al., Reference Bollwein, Lüttgenau and Herzog2012). A fluid filled cavity (lacuna) is common in the centre of CL’s varying in size and duration. Most reach a maximum diameter at 6 to 10 days after formation of the CL and the majority fill in by Day 18 regardless of whether luteolysis occurs or the CL is maintained due to pregnancy. Usually the radius of the cavity is not greater than the thickness of the luteal tissue wall. However, large thin-walled CL’s can form during normal cycles (Ginther, Reference Ginther1998). Ultrasonography has played a large part in confirming that waves of follicular development occur in vivo. Cows have 2 or 3 waves per oestrous cycle emerging (over 4 mm diameter) on approximately Day 0, 9 and 16 of the cycle (see diagrams in Crowe, Reference Crowe2008). As a rule of thumb, if a CL is over 20 mm diameter it has acquired PG receptors to be fully responsive to exogenous PG. After luteolysis, time to oestrus is inversely related to the size of the smallest follicle with a diameter more than 5 mm (i.e. emerged). This information can be used to predict the timing of oestrus after PG injection (Smith et al., Reference Smith, Ward and Dobson1998). The echogenicity of the follicle lumen contents (antrum) is quite consistent throughout its life span. It has been suggested it gets more heterogeneous during atresia due to accumulation of cell debris (Ginther, Reference Ginther1998). However, this is subtle and difficult to determine in an on-farm situation. The echogenicity of the follicle wall of anovulatory follicles decline once they reach maximum size. It increases again when the follicle starts to shrink during atresia. The echogenicity of ovulatory follicle walls falls to a greater extent but then increases before ovulation (Ginther, Reference Ginther1998). Echogenicity has also been shown to be lower around ovaries that did not produce high-quality embryos compared with those that do when collected after slaughter and put into an in vitro maturation system. The possibility of making these differentiations by eye to predict outcome in clinical situations has not been tested. There is no difference in blood flow between the follicle that will become dominant and others before deviation. After this, blood flow is increased to the dominant follicle and reduced to others (Acosta et al., Reference Acosta, Hayashi, Matsui and Miyamoto2005). At ovulation the blood flow increases further in response to the LH surge. Differences in blood flow between follicles that do or do not ovulate after luteolysis has not yet been studied so whether it would predict fertility is not known. The uterine wall thickness, contractility, its echogenicity and amount of fluid in the lumen all increase before ovulation while the amount of folding decreases (Ginther, Reference Ginther1998). The presence of fluid in the uterine lumen before, but not after, ovulation is useful to differentiate stage of the oestrous cycle when a small less distinct CL is present that could have just formed (Day 3 to 4 of cycle) or be undergoing luteolysis (Day 19 to 20 of cycle). This is a better indicator than vaginal fluid that may be present at both time points, although it may contain blood after ovulation. Our experience is that many veterinary surgeons do not appreciate the above detail when examining cattle using B-mode ultrasonography. If all the above information is taken into account, and a two-wave cycle assumed in lactating cows, an estimate of the point within the oestrous cycle and time to spontaneous or PG-induced luteolysis and ovulation can be given with 2 to 3 days. Recent work has suggested that the ovarian location of the CL relative to a follicle influences the number of follicular waves and oestrous cycle length (Ginther et al., Reference Ginther, Bashir, Santos and Beg2013). Additive information such as this as well as that available from colour Doppler is still being assessed for clinical use. Restraint of animals to obtain diagnostic images is an issue, as is capital cost of equipment.
Involution of both the cervix and uterus can be monitored postpartum by ultrasonography and the effect of uterine pathogens on follicular growth and CL size assessed (Sheldon et al., Reference Sheldon, Price, Cronin, Gilbert and Gadsby2009). Using high resolution ultrasound equipment, Scully et al. (Reference Scully, Maillo, Duffy, Kelly, Crowe, Rizos and Lonergan2013) determined that uterine involution took 49 days to complete until there was no difference in diameter between the previously gravid and non-gravid horn. Ultrasonography appears to be as sensitive as cytology at detecting these cows and will be more convenient practically. In a recent study, measurement of cervical diameter, endometrial thickness and assessment of echogenicity of the intra-uterine fluid from Days 15 to 21 postpartum predicted subsequent reproductive performance (López-Helguera et al., Reference López-Helguera, López-Gatius and Garcia-Ispierto2012). Doppler assessment of uterine blood flow and involution postpartum are still in their infancy and more data comparing animals with and without subsequent disease are needed before the clinical use of this procedure can be assessed (Heppelmann et al., Reference Heppelmann, Krüger, Leidl and Bollwein2013). The use of cytology and ultrasonography to diagnose and predict outcome of clinical and sub-clinical uterine disease are still being investigated by several groups. However, the outcome of other tests for uterine disease are related to the dominant ovarian structures indicating that interpretation of such tests needs to be made in conjunction with accurate diagnosis of ovarian structures (Senosy et al., Reference Senosy, Uchiza, Tameoka, Izaike and Osawa2011). The use of manual examination and grading of vaginal mucus is well recognised and many UK veterinary surgeons now classify infection and give farmers prognostic advice based on these criteria (Sheldon et al., Reference Sheldon, Price, Cronin, Gilbert and Gadsby2009).
Size of the first dominant follicle postpartum could also be monitored via ultrasonography and, if there was a herd tendency for small follicles, dietary interventions can be initiated and monitored. The fate of this first dominant follicle is critical. Failure of ovulation and development of cysts or persistent follicles delays the return to normal cyclicity. Cysts have been defined as structures over 25 mm in diameter for at least 10 days. Follicular cysts have wall thickness <3 mm and luteal cysts have wall thickness >3 mm, and possibly thin strands (trabeculae) of luteal tissue crossing the lumen. Ultrasonography improves the sensitivity and specificity of diagnosis of cystic ovarian disease (Douthwaite and Dobson, Reference Douthwaite and Dobson2000). The plasma concentration of oestradiol in cattle with follicular cysts can be predicted from observing if other follicles over 5 mm diameter are present on either ovary. If they are present, oestradiol is likely to be low, the cyst is endocrinologically inactive and FSH increases to stimulate emergence of a new wave of follicles. Cows with follicular cysts and other 5 mm follicles may have a higher likelihood of conceiving after treatment than cows with follicular cysts unaccompanied by other follicles (Douthwaite and Dobson, Reference Douthwaite and Dobson2000). Doppler ultrasonography to determine the proportion of the structure with elevated blood flow appears to be a better diagnostic criterion for diagnosis of active luteal tissue than wall thickness but fate or response to treatment of the cyst could not be predicted (Rauch et al., Reference Rauch, Krüger, Miyamoto and Bollwein2008). An ultrasonography reproductive tract scoring system has been proposed by Mee et al. (Reference Mee, Buckley, Ryan and Dillon2009) utilising information gained from pre-service ultrasound assessment to categorise involution and return to ovarian cyclicity. This could identify animals which subsequently had a lower likelihood of pregnancy to first service. Investigating the use of the percentage of the herd in each of these classifications as a monitoring tool and using them to trigger interventions is a potentially useful next step. In a review of data from a single farm, we recently observed that presence of a CL, suggesting cyclicity, at a pre-breeding check 30 to 40 days postpartum, was associated with a shorter calving to first service interval and a tendency (P=0.07) for a reduced time from calving to conception (Robertson and Smith, unpublished observation). Clinical observation suggests an association between periods of poor expression of oestrus, multiple follicular structures over 8 mm in diameter or single structures over 25 mm and changes in nutrition at a farm level (Smith, unpublished observation). Further research is needed on temporal correlations between ovarian structures and changes in herd management.
Using a 7.5 MHz probe, the maximum sensitivity and negative predictive value for pregnancy diagnosis was obtained at 26 days in heifers and 29 days in cows. Monitoring blood flow characteristics through the middle uterine artery using Doppler ultrasonography may be a more subtle way of monitoring placental viability in at-risk foetuses. However, there are also differences between uterine and CL blood flow, and endometrial and myometrial echogenicity, at Days 18 to 20 after service in heifers (Silva and Ginther, Reference Silva and Ginther2010). This may allow very early detection of pregnancy but research data from lactating cows and those with extended luteal phases are needed before the utility of this can be fully assessed.
Production of twins in dairy cattle is a risk factor for postpartum disease and subsequent poor fertility. Loss of twin pregnancies tends to be later in gestation (singles 52 days, twins 75 days) and fewer bilateral than unilateral twins are lost (40% v. 60%). The single embryo death rate was also significantly lower for cows with bilateral compared with unilateral twins (9.3% v. 21.6%) (Lopez-Gatius et al., Reference Lopez-Gatius, Santolaria, Yániz, Garbayo and Hunter2004). Thus, detection of twins should trigger a pregnancy diagnosis recheck at 13 weeks to ensure abortion has not occurred as well as promoting improved nutritional management of the cows including extra BCS checks and early drying off to reduce deleterious effects postpartum. The first step is to count CL’s because in the above study all twin-bearing cows had two or more CL’s and foetus distribution followed CL location.
If service dates are not known, foetal age to determine the next calving date and appropriate drying-off date can be performed by measuring crown-rump length, distance across the parietal bones of the head and trunk diameter. Foetal eye diameter has also been suggested as a metric but growth slows in the second half of gestation when it would be of most use compared with other measures (Ginther, Reference Ginther1998). Correct dry period duration and nutrition to avoid hypocalcaemia, dystocia and excess BCS, can then be instigated.
The physiological information that ultrasonography provides is underused by veterinary clinicians. The clinical use of Doppler measurement of blood flow requires further study but this area of research is likely to develop in the coming years as the price/capability ratio of machines continues to improve.
Use of data and KPIs
Improved reproductive performance has been associated with using computerised recording and analysis programmes in past studies (Hayes et al., Reference Hayes, Pfeiffer and Morris1998). Studies comparing users to non-users of computerised systems rather than performance of herds randomly allocated to use or not use them biases the findings to the more pro-active farmers self-selected in the intervention groups. There are, as yet, no studies to compare performance of herds where they use systems to different extents or favour one KPI over another within the system. The limiting factor on many farms is the availability of data. But is the act of measuring and monitoring associated with better herd performance? We recently surveyed 90 farmers in the North West of England regarding use of herd data. Calving interval was significantly shorter in herds where all oestrous cycles were recorded, irrespective of whether insemination was performed at the recorded oestrus; and on those herds where the herd manager rated inter-service interval data and calving interval as important monitoring tools. The importance given by farmers to measures of pregnancy rate or inseminations per conception (pregnancy) was not associated with a reduction in calving interval. There was also a positive association between milk yield per cow and increased use of data analysis by the farmers themselves (Oultram et al., personal communication). However, a study conducted in New Zealand identified a mismatch between perceived and actual fertility performance on herds and this was thought to be a block to improvement in fertility and engagement with extension (training) programmes (Brownlie et al., Reference Brownlie, Weir, Tarbotton, Morton, Heuer and McDougall2011). Adoption and use by all farm staff of oestrus detection technology may be limited by farmer belief that knowing their cows is their job and they do not want to be replaced by technology (Rehman et al., Reference Rehman, McKemey, Yates, Cooke, Garforth, Tranter, Park and Dorward2007). Once a system is installed high levels of satisfaction have been reported (Michaelis et al., Reference Michaelis, Hasenpusch and Heuwieser2013)
Setting targets
The ultimate targets for the farm will depend on the farming system and possible targets are outlined in Tables 2 and 3. Step-wise interim targets should be agreed with the farm staff for the next breeding period and reviewed before further, tougher targets are set approaching the ultimate targets. This aids morale and incentivises staff to focus on the task of submitting cows for service. If farm staff expect to fail because the targets are initially set too high, nothing will be achieved. Computer programmes such as Interherd+ in the United Kingdom, and the InCalf project in Australia set targets of the top 25% percentile or the average of the top 25% of farms for a KPI. This does mean that 25% of farms are already meeting that standard. They can then be given the top 10% performance as a goal. Those in the top 10% will be driving themselves!
Conclusion
Fertility is intrinsically linked with milk production and profitability. Fertility performance is a bellwether for quality of the animal environment, overall management and nutrition. To have a positive influence on fertility the farm management team of herd manager, agricultural advisor, nutritionist and veterinary surgeon need to actively monitor up-to-date information. Selecting the correct KPIs for the farming system employed and the data available are keys to this task. As our understanding of postpartum (patho-)physiology develops new KPIs need to be developed to allow farmers and veterinary surgeons to monitor animals during this key period.
Acknowledgements
Development of cu-sum chart for postpartum disease was funded by the Tesco PLC as part of the Tesco Dairy Centre of Excellence, University of Liverpool. The study on correlation between use of data analysis and herd performance was in partial fulfilment of the requirements of the Diploma in Bovine Reproduction, University of Liverpool by J.O. Figure 1 reproduced by kind permission of Dr A Bradley, QMMS, Cheddar, UK.