I. INTRODUCTION
Nanoscale metallic material (NMM) composites, when properly designed, exhibit superior strength, Reference Misra and Kung1–Reference Bellou, Overman, Zbib, Bahr and Misra3 high resistance to fatigue damage, Reference Wang, Misra and Hoagland4 tolerance to irradiation damage, Reference Misra, Demkowicz, Zhang and Hoagland5 good thermal stability, Reference McKeown, Misra, Kung, Hoagland and Nastasi6,Reference Economy, Schultz and Kennedy7 and resistance to harsh environments. Reference Misra, Verdier, Lu, Kung, Mitchell, Nastasi and Embury8 Because of these properties, a large number of potential applications can be foreseen for these structures including surface coatings of high wear, fatigue, and irradiation resistance, Nano Electro-Mechanical System (NEMS) devices, and lightweight metal panels for the automotive and aerospace industry. Reference Abdolrahim, Zbib and Bahr9 Various works have shown Reference Hoagland, Mitchell, Hirth and Kung2,Reference Bellou, Overman, Zbib, Bahr and Misra3,Reference Mastorakos and Abdolrahim10,Reference Gale, Achuthan and Morrison11 that the NMM strength depends highly on the individual layer thickness, interface type, and material selection. Typically, NMM composites are bimetallic systems with either coherent or incoherent interfaces although hybrid systems (with both types of interfaces) can also exist. Reference Mastorakos, Zbib and Bahr12,Reference Shao, Zbib, Mastorakos and Bahr13
Coherent interfaces Reference Mitlin, Misra, Radmilovic, Nastasi, Hoagland, Embury, Hirth and Mitchell14,Reference Mitlin, Misra, Mitchell, Hirth and Hoagland15 occur in systems consisting of materials with the same crystallographic structures (i.e., Cu–Ni or fcc–fcc) but a lattice spacing mismatch. In contrast, incoherent interfaces consist of layers with different crystallographic structures (i.e., Cu–Nb or fcc–bcc), with no continuous slip planes along the interfaces. Reference Misra, Hirth and Hoagland16 Overall, the coherent systems are more ductile while the incoherent systems are generally stronger. Reference Akasheh, Zbib, Hirth, Hoagland and Misra17 Theoretical and computational studies Reference Misra, Demkowicz, Wang and Hoagland18,Reference Mastorakos, Bellou, Bahr and Zbib19 have shown that the strength of NNM composites follows the following relationship Reference Hoagland, Mitchell, Hirth and Kung2 :
 $$\sigma (h,\ell ) = \alpha {{bE} \over {{h^m}}}\ln \left( {{{\beta h} \over b}} \right) + \gamma E{b \over \ell }\quad ,$$
where E is an average elastic property, b is the Burgers vector, h is the layer thickness, α, β, γ, m are material constants, and
 $\ell$
is the average spacing between interface and misfit dislocations. The first term in Eq. (1) shows the strong dependence of strength on the layer thickness. Also, the experimentally measured hardness can be predicted by this term. The second term in Eq. (1) is a measure of strain-hardening that results from the accumulation of interfacial dislocations during deformation.
The deformation mechanisms in NMMs are highly dependent on the interfacial morphology and the characteristic of the type of the interface. In coherent systems, the lattice mismatch causes a tensile strain in the layer with the larger lattice spacing and a compressive strain in the other layer that results in a coherency stress. Reference Barshilia and Rajam20 These stresses are developing at the interface, and they decrease inside the layers as the distance from the interface increases. However, as the individual layers are very thin (in the order of few nm to few tens of nm), there is no enough room in the layers for a full stress relaxation. Therefore, a residual stress exists inside the layers. This stress is larger for smaller layer thicknesses; as the distance between the two interfaces decreases, the less the stress can relax and the stronger the film becomes. Misfit dislocations have also been observed along the coherent interface. They relieve a portion of the stress and act as barriers to other dislocations, thus further increasing the strength.
In incoherent systems, the crystallographic structures are different and thus the interfaces are barriers to slip transmission, Reference Misra, Hirth and Hoagland16 much like grain boundaries with transmission (or alternate layer nucleation) only occurring when the strength overcomes the barrier strength. In these systems, the prevalent deformation mechanism, especially for thinner layer NMMs, is the confined-layer-slip (CLS) mechanism. Reference Wang and Misra21,Reference Zhang, Zhang, Liu, Zhang and Sun22 As the dislocations cannot cross the interface and there is no room to pile-up, they glide in a single layer, bowing along the interface and leaving misfit dislocations behind. The misfit dislocations in turn interact with passing dislocations leading to an increased flow stress and strain-hardening. Once the layer thickness decreases below a few nanometers, dislocations can no longer bow due the extremely small radius of curvature of the propagating dislocation. Instead the dislocations start moving across the interfaces since the overall strength in the film is high enough to overcome the interface strength that confines the dislocations within an individual layer. Reference Abdolrahim, Zbib and Bahr9
Computational simulations of tri-layer NMM systems, which are a combination of both coherent and incoherent structures having both types of interfaces, have suggested that the tri-layer systems will possess significant strain-hardening ability above that of their bi-layer counterparts. Reference Bellou, Overman, Zbib, Bahr and Misra3,Reference Mastorakos, Zbib and Bahr12,Reference Zbib, Overman, Akasheh and Bahr23,Reference Shao, Zbib, Mastorakos and Bahr24 However, very little experimental validation of the strain-hardening behavior of NMM systems exists. Reference Petch25,Reference Schoeppner, Wheeler, Zechner, Michler, Zbib and Bahr26 With significant evidence in bi-layer NMMs that layer thickness plays a substantial role in controlling the deformation processes, Reference Verdier, Huang, Spaepen, Embury and Kung27,Reference Huang and Spaepen28 the effect of layer thickness on strain hardening needs to be evaluated.
One recent study by Bahr and co-workers Reference Schoeppner, Wheeler, Zechner, Michler, Zbib and Bahr26 on the compression of micropillars made of trilayer Cu/Ni/Nb and bilayer Cu–Ni/Nb films describes the strain-hardening behavior to be a function of layer thickness and the type of the interfaces. Their work found that thinner layers lead to higher strain-hardening with the trilayer system exhibiting higher hardening compared to the bi-layer. They postulated that the presence of the coherent interface in the trilayer system was responsible for the presence of additional deformation mechanisms in the trilayer that caused the excess hardening in the Cu–Ni–Nb film.
NMM composites often consist of alternating layers of pure metals without any mixing, e.g., without any diffusion of atoms through the two sides of the interface. Reference Misra, Hirth and Hoagland16,Reference Misra, Demkowicz, Wang and Hoagland18,Reference Wang, Zhou, Shao and Misra29 However, in bulk applications, alloys often exhibit better properties such as higher tensile strength and hardness, and improved ductility and toughness compared to their parent metals are preferred over the pure metals in a variety of applications such as manufacturing, automotive, and aerospace industries. One recent attempt to study the effect of alloying in NMMs was the manufacturing and testing of nanopillars made of alternating Cu–Ni alloy/Nb layers. Reference Schoeppner, Wheeler, Zechner, Michler, Zbib and Bahr26 This current paper builds on these experimental results and uses atomistic simulations to study the effect of alloying on NMMs.
II. METHODOLOGY
A. Experiments
NMM composites consisting of films of Cu–Ni binary alloys and Nb were deposited using magnetron sputtering on (100) oriented Si. First, an Nb layer of 5 or 30 nm thickness was deposited, and then the alloy layer of 10 or 60 nm thickness has been added by co-deposition sputtering. This method resulted in a binary Cu–Ni alloy with 50% composition of each element. The alternating alloy and Nb layers were deposited to a total thickness of 1.5 μm with a constant period. Then, micropillars with diameters of 500 nm and aspect ratios of 1:3 were fabricated using a Ga ion beam at an accelerating voltage of 30 keV in a Tescan Vela FIB instrument (TESCAN, Brno, Czech Republic). Initially, high currents of 4 nA were used to mill rough pillar shapes with exact dimensions achieved after low current polishing to help minimize irradiation damage with lower currents ranging from 1 nA to 100 pA. The micropillars were imaged using a Hitachi S4800 high-resolution scanning electron microscope (Hitachi, Tokyo, Japan) to determine the taper due to FIB milling. The taper angle was found to be 3.25°. The taper effect can result in artificial perceived hardening of the micropillar as the smaller diameter top section deforms before the thicker bottom section. This artificial hardening has been removed by including a first-order correction factor using a technique described by Mara et al. Reference Mara, Bhattacharyya, Dickerson, Hoagland and Misra30
The low strain compression tests were conducted on the produced micropillars in a Zeiss DSM 962 SEM (Carl Ziess AG, Oberkochen, Germany) with a modified Alemnis in situ indenter, Reference Rabe, Breguet, Schwaller, Stauss, Haug, Patscheider and Michler31 as improved by Wheeler and Michler, Reference Wheeler and Michler32 using displacement control loading and conducted at strain rates of approximately 0.001 s−1.
B. Simulations
To qualitatively explain the experimental findings, molecular dynamics (MD) simulations were also performed. Because of the high strain rates and low temperatures utilized during the simulations, MD should not be expected to produce quantitative or identical results when compared to quasi-static experiments. Reference Mastorakos, Bellou, Bahr and Zbib19 However, the MD simulation results should follow similar trends to the experimental findings, which is enough evidence that the mechanisms observed in the atomistic simulations are similar to the ones responsible for the experimental findings. For that reason, our purpose is to ensure that the simulations will be able to reproduce the trends observed in experiments.
The LAMMPS Reference Plimpton33 MD software (Scandia National Laboratories, Albuquerque, New Mexico) was chosen for this study, using the embedded atom method Reference Daw and Baskes34 atomic potentials for Cu, Ni, and Nb and their combinations. Reference Voter35–Reference Zhang, Lai and Liu37 Fully periodic boundary conditions were considered in all cases. To keep the thermal fluctuations to a minimum, the temperature of the structures has been kept constant at 1 K using a Nose–Hoover thermostat. Reference Melchionna, Ciccotti and Lee Holian38
The atomistic configuration been considered was Cu–Ni/Nb multilayers with various alloy concentrations. The orientations of the fcc and bcc layers were the typical for these types of systems as reported in the literature. Reference Mastorakos, Zbib and Bahr12,Reference Shao, Zbib, Mastorakos and Bahr13,Reference Wang, Zhou, Shao and Misra29,Reference Hoagland, Kurtz and Henager39 For the same reasons, the Cu–Ni/Nb alloy/bcc system was oriented in the same way, in a Kurdjumov-Sachs (KS) crystallographic orientation with {111}Cu–Ni//{110}Nb interface plane and 〈110〉Cu–Ni//〈111〉Nb in the interface plane. The methodology described in Ref. Reference Mastorakos, Bellou, Bahr and Zbib19 was used to form stress-free films.
III. RESULTS
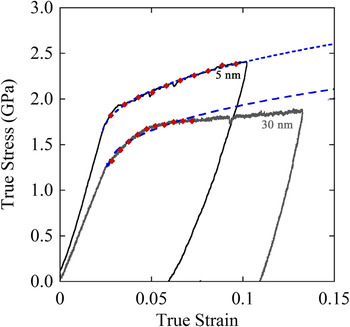
The experimental true stress–true strain curves after the taper correction are shown in Fig. 1 as solid lines. In all cases, the effect of pillar sink-in on the substrate compliance was found to be negligible. Reference Sneddon40 The beginning of each curve in Fig. 1 (below 1% strain) is slightly nonlinear due to the rounding of the top pf the pillar from the FIB milling; the stress–strain curves were offset so that the extrapolated elastic portion crosses the origin.
Stress–strain curve from the micropillar compression testing for two individual layer thicknesses.

The uniaxial compression strain-hardening relationship between stress and strain is Reference Hertzberg, Vinci and Hertzberg41
 $${\sigma _{{\rm{S}}-{\rm{H}}}} = K{\varepsilon ^n}\quad ,$$
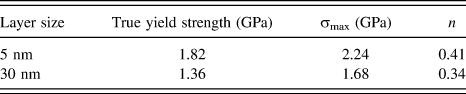
where n is the strain-hardening coefficient and K is the strength index. The strain-hardening coefficient can be obtained by curve fitting the plastic portions of the stress–strain curves in Fig. 1. As Eq. (2) is designed to model the plastic part of the stress–strain curve, only the portion after yielding up to the maximum stress (σmax) must be used. This portion is emphasized in individual marked diamonds and overlaid over the stress–strain curves with the curve fits shown as dashed lines. All curves fit very well to Eq. (2) with R-values of at least 0.95, suggesting a very reasonable fitting. A summary of the mechanical properties of the micropillar from the compression tests is listed in Table I.
Strength summary for alloy–Nb micropillars under compression.

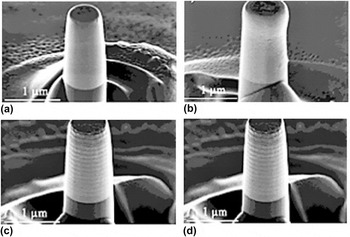
In Fig. 2 SEM images of the micropillars before and after compression are shown. In both nanopillar samples, a gradual yielding is observed without the formation of shear bands. The yield strengths of the 5 and 30 nm layer thickness samples were 1.32 and 1.86 GPa respectively. The maximum stress of the thinner structure was 2.24 GPa compared to 1.68 GPa of the thicker structure.
Micropillars of alloy–Nb films before (left) and after (right) the compression showing the difference in deformation as a result of layer thickness. (a) and (b) 5 nm and (c) and (d) 30 nm individual layer thickness.

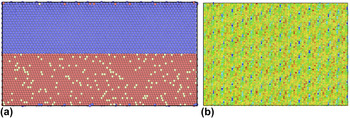
For the atomistic simulations, four structures were produced with individual layer thicknesses of 5, 10, 15, and 20 nm and five alloy concentrations; 10–50% Ni. The number of atoms varied from 220,000 in the 5 × 5 nm cases up to 3,500,000 atoms for the 20 × 20 nm structures. Originally, Cu/Nb incoherent structures were produced and then the binary Cu–Ni alloys were formed by randomly replacing atoms inside the Cu layer by Ni to the required concentration. Then the atomic structures were relaxed using a CG method to produce the initial configurations. A typical NMM after the energy relaxation is shown in Fig. 3.
(a) A typical CuNi/Nb structure used in this paper (here Cu–0.1%Ni). The atoms are colored according to their type. Red-Cu, blue-Nb, yellow-Ni. (b) The interface of the CuNi/Nb structure. The atoms are colored by their centrosymmetry value to show the interfacial structure. This structure is characteristic of the Cu/Nb systems.

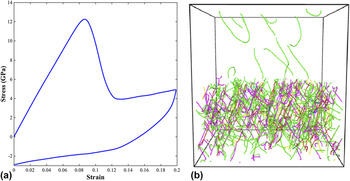
To match the experimental testing conditions (compression of micropillars), the atomic structures were subjected to uniaxial compression along the direction perpendicular to their interface. Fully periodic boundary conditions were chosen to model an infinitely long and thick structure which consisted of a large number of alternating metallic layers, to closely approximate the experimental structures. As the as-produced structures were dislocation-free, we applied an initial compressive loading of constant strain rate of 109 s−1 up to a 20% final strain, with a subsequent unloading with the same strain rate back to zero strain. The purpose of this process was to produce a stable dislocation population inside the structures. The loading was applied by displacing the y-face of the structures at the constant strain rate. A characteristic stress–strain curve produced by this process and the final dislocation distribution inside the NMM is shown in Fig. 4.
(a) A typical loading–unloading stress–strain curve. The initial positive loading corresponds to compression and the negative to tension. (b) The dislocation structure at the end of unloading cycle. The fcc layer is at the bottom and the bcc on top. The DXO technique has been used to identify the dislocation types.

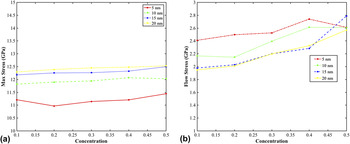
Curves like the one shown in Fig. 4 have been produced for every alloy concentration for all thicknesses. The results are shown in Fig. 5. Figure 5(a) displays the variation of the maximum stress with the change in concentration.
(a) The maximum stress for the four film thicknesses (5, 10, 15, and 20 nm) and five different Cu/Ni alloy concentrations as a function of Ni atom percentage. The different cases are shown in various dashed curves. (b) The flow stresses for the same structures.

The maximum stress in Fig. 5(a) is the stress to initiate the first dislocation within the structure. This stress must not be confused with the maximum stress shown in the experimental curves in Fig. 1, since the experimental structures already have a dislocation population inside them, and the maximum stress is related to the strength of the nanotubes. The simulations show that as the layer thickness increases, this stress increases. This behavior has been discussed in Ref. Reference Mastorakos, Bellou, Bahr and Zbib19 and is attributed to the role of interfaces and their shearing that govern the deformation behavior at the small layer thicknesses. The simulations showed a very weak influence of the alloy concentration on the maximum stress.
The strength behavior, however, is reversed in the case of flow stress, Fig. 5(b). We measured the flow stress as the average stress from strains 0.15 to 0.2. The results show that the films with the smaller layer thickness exhibit higher flow stresses than the thicker layers. In this case the simulated structures have a residual population of dislocations, and the flow stress is the stress required to propagate the dislocations instead of generating them. In the thinner structures, there is less space for the dislocations to move and therefore more stress is required to produce the same deformation. In the case of the flow stress, the alloy concentration seems to affect it. The overall trend is that as the alloy concentration increases, the flow stress increases for the same layer thickness. The increase varies between 40% (from 2.0 to 2.8 GPa) for the case of 15 nm layer thickness and 8% (from 2.4 to 2.8 GPa) for the case of 5 nm layer thickness, with an average increase (considering all thicknesses) of about 24%. This increase has been attributed to the extra obstacle the Ni atoms impose on the dislocation motion.
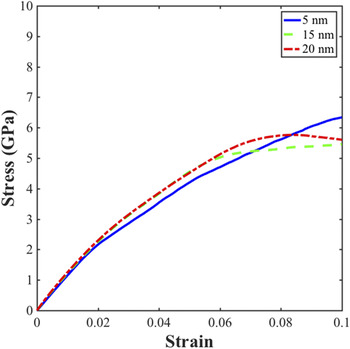
The loaded structures were unloaded applying a tensile load with the same strain rate as the compression. The load was applied perpendicular to the interface, along y-axis until the dimensions of the structures reached the average initial dimensions. Then, the structures are relaxed by energy minimization and then by keeping them in a constant temperature for 20 ps. This process was necessary to assure that a relaxed initial dislocation population was left inside the structures. The relaxed dislocation densities depended on the layer thickness with the 5 nm layer exhibit the lower dislocation density of 2 × 10¹⁶ m/m3 on average while the 20 nm layer with an average dislocation density 5.5 × 10¹⁶ m/m3 and the 10 and 15 nm systems having dislocation densities between those two extreme values. These densities may be high; however they are typical for the high strain rate applied. The initial dislocation densities were independent on the alloy concentration, with all the structures with the same thickness having similar dislocation densities. Next, we loaded again the structures up to a strain of 0.1 to produce stress–strain curves, such as those shown in Fig. 6.
Stress–strain curves of the three structures 5, 15, and 20 nm. The alloy concentration is 0.2. Only three curves are shown for clarity. The different cases are shown in various dashed curves.

A similar trend as the one observed in Fig. 1 has been observed here too. All the structures exhibit an initial yield followed by hardening. The maximum stress of a 5 nm structure was 6.3 GPa, that of 10 nm was 6 GPa, that of 15 nm was 5.3 GPa, and that of 20 nm 5.1 GPa. The higher magnitude of these stresses, compared to the experimental values, can be explained by the higher strain rate used in the simulations.
Initially the hardening of the 15 and 20 nm films was slightly higher than the 5 nm. However, as the loading increases, the hardening becomes smaller (in the 15 nm case) or even negative, e.g., the structure exhibits softening (in the 20 nm case) at a strain of about 0.08 and continues up to the final strain. On the other hand, the 5 nm films continue to harden up to a strain of 0.1. This initial hardening of the 15 and 20 nm films can be explained by the higher initial dislocation density inside the alloy layer. However, as the strain increases the dislocation density drops due to the interactions of the dislocations with the interface. Furthermore, the existing dislocations inside the 20 nm Nb layer (and later inside the 15 nm layer) are also activated and began interacting with the interface, resulting in the increase of the available free space inside the structures that leads to the softening in the 20 nm film and the drop in hardening in the 15 nm film, respectively. This is in accordance with the previous simulation work Reference Mastorakos and Abdolrahim10 where the dislocations inside the thicker Nb layer has been shown to be activated at lower stresses than that inside the thinner layers. On the other hand, in the 5 nm film, the lack of space inside the alloy layer that do not allow the dislocations to propagate freely and the inactivity of dislocations inside the Nb layer, resulted to a consistent hardening that continued until the end of the loading process.
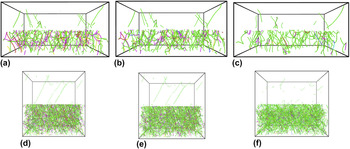
The above observations are also supported by the dislocation density measurements. The dislocation content of the 5 and 20 nm structures with 20% Ni is plotted in Fig. 7 for 0.0, 0.03, and 0.1 strains, respectively. These strains correspond to the initial structure, to the strain right after yielding and to the strain at the end of the simulation. The Dislocation Extraction Algorithm (DXA) technique Reference Stukowski, Bulatov and Arsenlis42 has been used to show the dislocations.
Snapshots of the two layers at various strains. In all cases, the bottom layer is the alloy layer and the top is Nb. (a)–(c) The dislocation content of 5 nm structures at 0.0, 0.03, and 0.1 strains, respectively. (d)–(f) The dislocation content of 20 nm structures at 0.0, 0.03, and 0.1 strains, respectively.

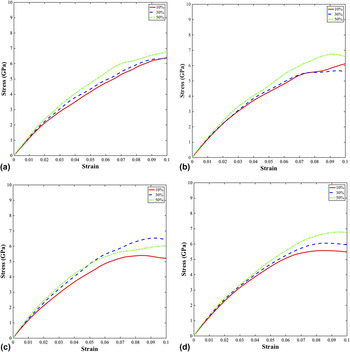
The effect of the alloy concentration also seems to affect the hardening of the film, although not as strongly as the layer thickness. This is shown in Fig. 8 where the stress–strain curves of the different layer thicknesses are plotted for three different alloy concentrations.
The effect of the alloy concentration on the hardening of the films. (a) 5 nm films, (b) 10 nm films, (c) 15 nm films, and (d) 20 nm films. The different cases are shown in various dashed curves.

IV. DISCUSSION
Overall, the experiments and simulations suggest that both alloy concentration and individual layer thickness affect the strength and hardening behavior of the structures. The experiments show that while the yield strength is not considerably affected by the layer thickness, the maximum stress of the thinner layer structures is much higher than that of the thicker.
The yield stress dependence can be explained by the definition of the initial yield of the composite that is related to the stress required to initiate dislocation motion in the softer layer (the alloy in this material system). As this is an inherent material property, it is not surprising that the yield strength is not strongly affected by the layered structure. Reference Abdolrahim, Zbib and Bahr9
The maximum stress dependence can be explained by the behavior of dislocations inside the composite structure and in particular by the stress required by a dislocation to cross the interface and the number of interfaces. All NMM with all alloy contents exhibited a similar behavior, leading to the assumption that the layer thickness (and especially the presence of the incoherent interface) is mainly responsible for the exhibited stress dependence.
The simulations suggest that the strain-hardening is a result of the increased dislocation content that is deposited along the interface as dislocations propagate through an individual layer. This is in agreement with the previous work in the literature. Reference Misra, Hirth and Hoagland16 The deposited dislocations act both as barriers to further deformation and nucleation sources for more dislocations, resulting in an increase in the dislocation density of the films. A previous study indicates that the decreasing layer thickness results in an increase in the number of interfacial interactions and dislocation nucleation sites, Reference Abdolrahim, Zbib and Bahr9 which would increase the strain-hardening rate as the dislocations interact with one another and delay further deformation. As the individual layer thickness is reduced, there are more dislocation interactions and an increased strain-hardening ability.
From the plots in Fig. 7 it can be seen that in the case of 5 nm, the yield begins when the dislocations inside the alloy layer start to move, and at the end dislocations in both layers are active and propagate. Although there is room inside Nb for the dislocations to move, there is also no space inside the alloy layer and since the dislocations do not cross the interface, the material hardens. This is further clarified when we calculate the dislocation densities inside the two layers. In the alloy layer, the dislocation density jumps from 2 × 10¹⁶ m/m3 initially, to 3.5 × 10¹⁶ m/m3 at 0.03 strain, to 5 × 10¹⁶ m/m3 at 0.1 strain, while the Nb layer dislocation density drops from 3 × 10¹⁶ m/m3 initially to 1.7 × 10¹⁶ m/m3 at a strain of 0.1, mostly due to the interactions with the interface that acts as a sink to the dislocations. Reference Wang and Misra21,Reference Wang, Zhou, Shao and Misra29 This observation suggests that the alloy layer thickness is responsible for the hardening since dislocations cannot cross the interface.
In the case of 20 nm film, no considerable initial dislocation activity is detected inside the Nb layer, while the dislocation density inside the alloy layer slightly dropped due to interactions between dislocations and the interface, leaving more space available and resulting in the detected softening. Initially, the dislocation density inside the alloy layer was 5.5 × 10¹⁶ m/m3, and increased to 7.2 × 10¹⁶ m/m3 at a strain of 0.03 and to 1.4 × 10¹⁷ m/m3 at about 0.8 strain before drops to 1.2 × 10¹⁷ m/m3 at 0.1 strain. As the dislocation density inside the Nb layer initially dropped from 3 × 10¹⁶ m/m3 to 1.7 × 10¹⁶ m/m3, the initial hardening of the structure is explained by the increase in dislocation density inside the alloy layer.
The initial dislocation density in all structures with the same composition was roughly the same, revealing a dependence of the dislocation content from the alloy concentration. Furthermore, the hardening is also affected by the alloy composition. This behavior can be attributed to the extra obstacle the presence of second type atoms present to the dislocation motion that will be the same for the same for structures with similar composition. However, the hardening effect due to alloy concentration was not as strong as that from the layer thickness, which leads to the assumption that, like in the maximum stress, the layer thickness is mainly responsible for the hardening of the NMM composites.
V. CONCLUSIONS
In our current study, the hardening of the bi-layer alloy systems appears to depend on the thickness of the individual layer, with the thinner systems exhibiting higher hardening. This is supported by the MD simulations indicating that the FCC layer exhibits more dislocation content and storage over the BCC layer at a given strain. The alloy concentration of the alloy layer also contributes to hardening due to the extra obstacle that the second type atoms impose on the dislocation motion although not as strongly as the layer thickness. For the same layer film thickness, the general trend was that the higher concentration exhibited the higher hardening. This was also reflected in the flow stress where the higher concentration films exhibited higher flow stresses. The observed behavior is attributed to the less available space for the dislocations in the thinner layers that, in conjunction with the presence of the incoherent interface acts as both dislocation sink and obstacle to the dislocation motion and/or the presence of the second type atoms inside the softer layer, results in the increased flow stress in the thinner layers.
ACKNOWLEDGMENTS
This work was supported in part by the National Science Foundation under Grant No. CMMI 1634772/1634640 and in part by the US Department of Energy, Office of Basic Energy Sciences, Division of Materials Sciences under Grant No. DE-FG02-07ER46435. The authors acknowledge access, through an approved user project, to the Center for Integrated Nanotechnologies (CINT), a DOE Office of Basic Energy Sciences user facility.