


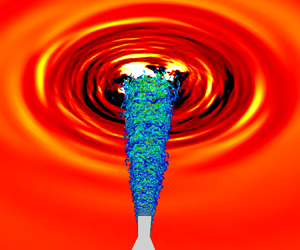



1. Introduction
Passive and active noise control strategies have been explored and tested to reduce the supersonic jet noise. A common trend in the implementation of passive noise control methods is to modify the geometries of nozzle exits, such as chevrons (Schlinker et al. Reference Schlinker, Simonich, Shannon, Reba and Ladeinde2009; Callender, Gutmark & Martens Reference Callender, Gutmark and Martens2010; Henderson & Bridges Reference Henderson and Bridges2010; Kuo, Veltin & Mclaughlin Reference Kuo, Veltin and Mclaughlin2010; Rask, Kastner & Gutmark Reference Rask, Kastner and Gutmark2011; Munday et al. Reference Munday, Heeb, Gutmark, Liu and Kailasanath2012; Heeb, Gutmark & Kailasanath Reference Heeb, Gutmark and Kailasanath2016; Humphrey & Edgington-Mitchell Reference Humphrey and Edgington-Mitchell2016; Jawahar, Meloni & Camussi Reference Jawahar, Meloni and Camussi2022), tabs (Benot, Castelain & Bailly Reference Benot, Castelain and Bailly2013; Arun Kumar & Rathakrishnan Reference Arun Kumar and Rathakrishnan2015), vortex generators (Liu et al. Reference Liu, Khine, Saleem, Rodriguez and Gutmark2022; Saleem et al. Reference Saleem, Karnam, Rodriguez, Liu and Gutmark2023), castellations/notches (Pannu & Johannesen Reference Pannu and Johannesen1976; Anureka & Srinivasan Reference Anureka and Srinivasan2018), bevels (Wlezien & Kibens Reference Wlezien and Kibens1988; Viswanathan et al. Reference Viswanathan, Shur, Spalart and Strelets2008; Viswanathan & Czech Reference Viswanathan and Czech2011; Aikens, Blaisdell & Lyrintzis Reference Aikens, Blaisdell and Lyrintzis2015; Lim et al. Reference Lim, Wei, Zang, Vevek and Cui2020; Wei et al. Reference Wei, Chua, Lu, Lim, Mariani, Cui and New2022), interior corrugations (Seiner, Ukeiley & Jansen Reference Seiner, Ukeiley and Jansen2005; Viswanathan et al. Reference Viswanathan, Krothapalli, Seiner, Czech, Greska and Jansen2011; Powers, Kuo & Mclaughlin Reference Powers, Kuo and Mclaughlin2013; Powers & McLaughlin Reference Powers and McLaughlin2017; Tinney, Valdez & Murray Reference Tinney, Valdez and Murray2020) and steps (Wei et al. Reference Wei, Mariani, Chua, Lim and New2019). Examples of active noise control methods encompass fluidic inserts/micro-jets (Greska et al. Reference Greska, Krothapalli, Seiner, Jansen and Ukeiley2005; Henderson Reference Henderson2010; Wan & Yu Reference Wan and Yu2011; Heeb et al. Reference Heeb, Kastner, Gutmark and Kailasanath2013; Morris, Mclaughlin & Kuo Reference Morris, Mclaughlin and Kuo2013; Cuppoletti & Gutmark Reference Cuppoletti and Gutmark2014; Coderoni, Lyrintzis & Blaisdell Reference Coderoni, Lyrintzis and Blaisdell2019; Prasad & Morris Reference Prasad and Morris2020) and plasma actuators (Samimy et al. Reference Samimy, Kim, Kastner, Adamovich and Utkin2007, Reference Samimy, Kim, Kearney-Fischer and SINHA2010; Speth & Gaitonde Reference Speth and Gaitonde2013). Most of these methods mentioned above are developed for circular jets and have shown prospective noise reduction potentials. However, compared with circular jets, the fluid and acoustic features of rectangular jets are more complex. Due to the asymmetrically internal geometry, the aspect ratio ( $AR$) and sharp corners, the flow exhausted from rectangular jets has different characteristics, including the collapse rates of potential cores (Chakrabarti et al. Reference Chakrabarti, Gaitonde, Nair Unnikrishnan, Stack, Baier, Karnam and Gutmark2022), the growth rates of shear layers (Chakrabarti et al. Reference Chakrabarti, Gaitonde, Nair Unnikrishnan, Stack, Baier, Karnam and Gutmark2022), the formation of corner vortices (Bhide, Siddappaji & Abdallah Reference Bhide, Siddappaji and Abdallah2021), warping of azimuthal vortices (Grinstein Reference Grinstein1995), axis switching (Zaman Reference Zaman1996) and preferential flapping along the direction of the minor axis (Shih, Krothapalli & Gogineni Reference Shih, Krothapalli and Gogineni1992). The discrepancies in flow characteristics between the minor- and major-axis planes result in different far-field acoustic radiations in the two principal planes. The complexities associated with the flow and acoustic fields of rectangular jets lead to a great challenge in applying noise control strategies.
Rectangular jets show inherent advantages over their circular counterparts, including higher turbulent mixing (Grinstein Reference Grinstein2001), easier thrust vectoring (Goss, Lee & Mclaughlin Reference Goss, Lee and Mclaughlin2009) and superior air-frame integration (Wiegand Reference Wiegand2018). These features allow for reducing the infrared and radar signature of the aircraft, the wave drag on the aircraft (Jumper Reference Jumper1983) and the design complexities of the aircraft system. The imperfectly expanded supersonic rectangular jets often produce intense broadband shock-associated noise (BBSAN) and screech tones (Powell Reference Powell1953; Norum & Seiner Reference Norum and Seiner1982), due to the interactions between the shock-cell structures and the jet shear layers. In particular, the screech tones, characterized by high magnitudes and discrete frequencies, lead to adverse impacts on aircraft structures, the surrounding environment and personnel hearing health (Clarkson Reference Clarkson1962; Yong & Wang Reference Yong and Wang2015; Shannon et al. Reference Shannon2016). The generation of the screech tones is associated with self-sustained fluid-acoustic feedback mechanism involving downstream-travelling hydrodynamic instabilities and upstream-propagating neutral acoustic waves (Tam & Hu Reference Tam and Hu1989; Shen & Tam Reference Shen and Tam2002; Edgington-Mitchell Reference Edgington-Mitchell2019). Noise control of supersonic rectangular jets is desired to ensure the operational safety and environmental sustainability of military aircraft.
Studies on the noise control of supersonic rectangular jets are limited, and here we give a short survey. Samimy et al. (Reference Samimy, Kim, Clancy and Martens1998) explored the effects of castellations on the supersonic rectangular jet noise, and found that the castellations eliminate, or at least substantially reduce, the screech tone and significantly suppress the far-field overall sound pressure levels under the imperfectly expanded conditions. The effects of chevrons on under-expanded rectangular jets were investigated by Nichols et al. (Reference Nichols, Lele, Moin, Ham, Brès and Bridges2012), who observed an evident noise suppression. Powers, Mclaughlin & Morris (Reference Powers, Mclaughlin and Morris2015) showed that hard-wall corrugations could significantly mitigate the BBSAN in the upstream direction and the turbulent mixing noise in the major-axis direction. With regard to the active noise control, the noise control of over-expanded rectangular jets was experimentally studied by Scupski et al. (Reference Scupski, Akatsuka, Mclaughlin and Morris2022). Results showed that fluidic inserts can effectively reduce the noise levels in the sideline and upstream directions, benefiting from the suppression of BBSAN. Gautam et al.'s (Reference Gautam, Karnam, Mohammed, Saleem and Gutmark2024) experimental results showed that internal fluidic inserts mitigate the magnitudes of screech tone and BBSAN significantly, owing to the alteration of the shock pattern and the enhancement of jet mixing. Active noise control based on the plasma actuator was numerically investigated by Prasad & Unnikrishnan (Reference Prasad and Unnikrishnan2023, Reference Prasad and Unnikrishnan2024), suggesting that high-frequency forcing reduces the noise levels in the downstream direction, due to the reduced energy in the supersonic phase speeds by redistribution of energy into the high-frequency band. These noise control approaches modify the shock-cell structures in the jet core region and disrupt the feedback loop for the generation of screech tones. Meanwhile, the break-up of large-scale vortical structures into smaller scales strengthens the shear-layer mixing, and consequently suppresses the turbulent mixing noise.
The bevelled nozzle is a promising noise control approach and has been utilized to suppress the supersonic circular jet noise. The concept of single-bevelled circular nozzle was first proposed by Norum (Reference Norum1983), who experimentally found that the single-bevelled nozzle is able to destroy the symmetry of the shock-cell structures and reduce the amplitude of the screech tone significantly. The flow-field and noise-generation characteristics of supersonic circular jets originating from single-bevelled and tabbed nozzles were studied (Wlezien & Kibens Reference Wlezien and Kibens1988), showing that the screech tone and turbulent mixing noise are greatly suppressed in the divergent plane (the vertical plane perpendicular to the inclined exit plane). The numerical investigation of Viswanathan et al. (Reference Viswanathan, Shur, Spalart and Strelets2008) reported that the single-bevelled nozzle could damp out the shock cells and reduce the far-field noise levels of high-speed circular jet in the direction of the long lip side. They also observed noise reduction benefits in the azimuthal direction of the longer lip, and that increasing the bevelled angle enhances the significance of the noise suppression (Viswanathan & Czech Reference Viswanathan and Czech2011). Similar results were obtained in the large-eddy simulations of supersonic circular jets with single-bevelled nozzle (Aikens et al. Reference Aikens, Blaisdell and Lyrintzis2015). Furthermore, Powers & McLaughlin (Reference Powers and McLaughlin2017) measured the acoustic characteristics of military-style supersonic circular jets with a combination of single-bevelled nozzle and hard-wall corrugations, and observed efficient noise reductions of the BBSAN and the turbulent mixing noise of up to 3 dB. Lim et al. (Reference Lim, Wei, Zang, Vevek and Cui2020) found that the single-bevelled nozzles are able to mitigate or eliminate the screech tones in the experiments of under-expanded supersonic circular jets, and confirmed the existence of a correlation between turbulent structures and the screech tone by using proper orthogonal decomposition of ultra-high-speed schlieren images. In contrast, their subsequent study revealed that the double-bevelled nozzle has no noise reduction effects, rather, it amplifies the intensity of the screech tone and enhances the shear-layer mixing (Wei et al. Reference Wei, Chua, Lu, Lim, Mariani, Cui and New2022).
With respect to the impacts of bevelled nozzles on the rectangular jet noise, previous studies were all conducted in the subsonic flow regime. Bridges (Reference Bridges2012) and Bridges & Wernet (Reference Bridges and Wernet2015) measured the acoustic and turbulent fields of a family of rectangular nozzles with aspect ratios of 2, 4 and 8 in the high subsonic flow regime. The acoustic results showed that increasing aspect ratio is able to reduce the peak-frequency noise in the downstream directions and increase the high-frequency noise in the sideline directions, similar to the impacts of enhanced mixing devices. As the aspect ratio increases, the total noise was observed to be reduced in the major-axis plane, but increased in the minor-axis plane. Single-bevelled nozzles were constructed by extending the wide lip on one side of the rectangular nozzles. Results showed that the single-bevelled nozzles emit stronger noise in all observation directions when the bevel length is increased, and the noise on the long lip side is stronger than that on the short side. Following the configurations and flow conditions in the study of Bridges (Reference Bridges2012), Sandhya & Tide (Reference Sandhya and Tide2018) numerically studied the impacts of the aspect ratio and bevel length on the potential core length and spreading of the jets. They found that the bevelled nozzle considerably improved the turbulent mixing and modified the turbulent characteristics of the jets, implying that bevelling of the nozzle is an effective passive method for jet noise reduction. The enhanced turbulence mixing was more evident for the nozzle with a long bevel length and a high aspect ratio. Erwin et al. (Reference Erwin, Panickar, Vogel and Sinha2014) performed numerical simulations of a cold subsonic rectangular jet with/without single-bevel cut. They observed that the noise levels at upstream angles on the long lip side are reduced due to the acoustic shielding, whereas the bevel does not provide acoustic shielding at upstream angles on the short lip side and at the downstream angles.
The literature review suggests that most studies have focused on the bevelled-nozzle- based noise control of supersonic circular jets and subsonic rectangular jets. To the best of our knowledge, no study was found in open literature on the noise control of supersonic rectangular jets with bevelled nozzles. Considering the differences between the rectangular and circular jets, the efficiency of bevel cuts in reducing the supersonic rectangular jet noise under imperfectly expanded conditions is still an open question. The motivation of the current study is to fill in the blank and provide insights into the bevelled-nozzle-based noise control techniques for supersonic rectangular jets.
In this study, high-fidelity large-eddy simulations (LES) of supersonic rectangular jets at three nozzle pressure ratios (forming two over-expanded jets and one under-expanded jet) with either single- or double-bevelled nozzle are performed, aiming to analyse the influences and mechanisms of bevelled nozzles on the flow structures and acoustic features of supersonic rectangular jets.
The remainder of this paper is organized as follows. The nozzle geometries and flow conditions are introduced in § 2. The numerical algorithms and validations are given in § 3. In § 4, analyses and discussions on the flow and acoustic fields of the jets with/without bevelled nozzles are reported, and particular attention is paid to the generation and suppression of the screech tones. Finally, concluding remarks are summarized in § 5.
2. Nozzle geometries and flow conditions
Three nozzles with different types of exits are considered in this study. They are named baseline (i.e. non-bevelled), single-bevelled and double-bevelled nozzles. Figures 1 and 2 show the three-dimensional view and the cross-sectional geometries of the nozzles, respectively. The baseline nozzle is a convergent–divergent rectangular nozzle, which has been experimentally tested at the University of Cincinnati (Mora et al. Reference Mora, Baier, Gutmark and Kailasanath2016; Karnam, Baier & Gutmark Reference Karnam, Baier and Gutmark2019) and numerically studied with large-eddy simulations (Gojon, Gutmark & Mihaescu Reference Gojon, Gutmark and Mihaescu2019; Chen, Gojon & Mihaescu Reference Chen, Gojon and Mihaescu2021; Chen et al. Reference Chen, Qiang, Wu, Yang and Li2024). The width (b) and height ( $h$) of the baseline nozzle exit are 25.908 mm and 12.954 mm, respectively, forming an aspect ratio (
 $AR$) of 2.0 at the exit. The equivalent diameter (
 $D_{eq}$) of the nozzle is 20.66 mm, ensuring that the exit area of the rectangular nozzle is equal to that of a circular nozzle. The origin is fixed at the centroid of the baseline nozzle exit. For convenience of discussion, the bisecting plane perpendicular to the long edges of the nozzle is referred to as the minor-axis plane (i.e.
 $x$–
 $y$ plane), and the bisecting plane perpendicular to the short edges of the nozzle is referred to as the major-axis plane (i.e.
 $x$–
 $z$ plane).
Nozzle configurations: (a) baseline nozzle, (b) single-bevelled nozzle and (c) double-bevelled nozzle.

Cross-sectional geometries of (a) baseline nozzle, (b) single-bevelled nozzle and (c) double-bevelled nozzle. The black solid point represents the origin. The angle ( $\alpha$) represents the bevelled angle.

As displayed in figures 2(b) and 2(c), the single- and double-bevelled nozzle are designed with single- and double-bevel cuts, respectively, which are imposed at the nozzle lips. The tailored plane is perpendicular to the major-axis plane and has an inclined angle ( $\alpha$) to the exit plane of the baseline nozzle. The three nozzles share the same origin position and have the same averaged axial length (i.e. the average of the long and short axial lengths) and constant divergent angle. The inclined angle, also known as the bevelled angle, is set as
 $30^{\circ }$ in this study.
The nozzles have a design Mach number ( $M_d$) of 1.5, under the ideally expanded condition with nozzle pressure ratio (
 $NPR$) (i.e. the ratio of stagnation pressure
 $p_0$ to ambient pressure
 $p_{\infty }$) of 3.67 and nozzle temperature ratio (
 $NTR$) (i.e. the ratio of stagnation temperature
 $T_0$ to ambient temperature
 $T_{\infty }$) of 1.0. The ambient pressure and temperature are
 $p_{\infty } = 101\ 325$ Pa and
 $T_{\infty } = 293$ K, respectively. We keep
 $NTR = 1.0$ and choose three
 $NPR$ (2.3, 3.0 and 5.0) to form two over-expanded cold jets and one under-expanded cold jet. Details of the jet operating conditions are summarized in table 1.
Jet operating conditions.

The velocity of the ideally expanded jet is  ${u_j} = {M_j}\sqrt {\gamma R{T_j}}$, where
 $\gamma$ is the specific heat ratio of air,
 $R$ is the perfect gas constant,
 $T_j$ is the static temperature of the ideally expanded jet and
 $M_j$ is the ideally expanded Mach number. The Reynolds number is defined as
 $Re_j = u_j D_{eq}/{\nu }_j$, where
 ${\nu }_j$ denotes the kinematic viscosity of air at the nozzle exit.
3. Computational methodology
3.1. Numerical methods
The governing equations are non-dimensional three-dimensional unsteady compressible Navier–Stokes equations in conservative form. For spatial discretizations, a modified seventh-order weighted compact nonlinear scheme (Nonomura & Fujii Reference Nonomura and Fujii2009; Nonomura, Iizuka & Fujii Reference Nonomura, Iizuka and Fujii2010) is employed to solve the convective terms, and an eighth-order central difference scheme is applied for the viscous terms. A simple high-resolution upwind scheme (Shima & Jounouchi Reference Shima and Jounouchi1997) is used to approximate the inviscid fluxes. For the temporal integration, an implicit lower–upper symmetric Gauss–Seidel scheme (Yoon & Jameson Reference Yoon and Jameson1988) is used, and a second-order temporal accuracy is obtained with three sub-iterations in every time advancement. Implicit large-eddy simulations (Grinstein, Margolin & Rider Reference Grinstein, Margolin and Rider2007) are utilized without any explicit subgrid-scale model. The dynamics of small-scale turbulent eddies is implicitly modelled by the dissipation of the numerical methods. The in-house solver has been extensively validated in previous studies, including supersonic cavities (Li, Nonomura & Fujii Reference Li, Nonomura and Fujii2013a; Li et al. Reference Li, Nonomura, Oyama and Fujii2013b), shock-wave/boundary-layer interactions (Li Reference Li2019; Li & Liu Reference Li and Liu2019) and supersonic jets (Nonomura & Fujii Reference Nonomura and Fujii2011; Nonomura et al. Reference Nonomura, Nakano, Ozawa, Terakado, Yamamoto, Fujii and Oyama2019, Reference Nonomura, Ozawa, Abe and Fujii2021; Chen et al. Reference Chen, Qiang, Wu, Yang and Li2024).
3.2. Computational grids and boundary conditions
In our previous work (Chen et al. Reference Chen, Qiang, Wu, Yang and Li2024), a study of grid convergence has been conducted by using the baseline nozzle at  $NPR = 3.0$ and
 $NTR = 1.0$. A similar computational domain and grid resolutions of the ‘fine grid’ as in Chen et al. (Reference Chen, Qiang, Wu, Yang and Li2024) are adopted in this study. The distributions of the computational grids are displayed in figure 3 (showing every second point for clear visualization). The total number of multi-block structured grids is approximately 100 million, with a minimum grid spacing of
 $0.001h$ placed in the wall-normal direction and near the nozzle lip. In order to resolve the turbulent structures in the jet shear layer and capture the transition near the nozzle lip, the grids are refined in the jet core region, and gradually stretched to the outer boundaries, forming a sponge zone to avoid non-physical reflections of acoustic waves at the outer boundaries. Note that the grids in the simulation of the single-bevelled nozzle are arranged along the direction of the jet plume, which is estimated with a preliminary simulation.
Distributions of the computational grids in the minor-axis plane (a) and near the nozzle lip in the  $x$–
 $y$ plane (b) and
 $y$–
 $z$ plane (c). Every other grid point is shown.

The stagnation inflow conditions with corresponding  $NPR$ and
 $NTR$ are imposed at the nozzle inlets. The wall surfaces are treated with no-slip adiabatic wall boundary conditions. Riemann far-field boundary conditions using an invariant are applied at the outer boundaries of the sponge zone. The non-dimensional time step (
 ${{\Delta t \times {u_j}}/{{D_{eq}}}}$) is set as 0.001. After an initial stage allowing the jet becomes fully developed (statistically stable), a time duration of 500 is used to acquire the flow statistics and acoustic fields.
3.3. Validations
To validate the accuracies of the simulations, the numerical results of the baseline nozzle are compared with the available experimental data and theoretical predictions. Figure 4 shows the contours of time-averaged density gradient magnitudes of the baseline nozzle at  $NPR = 3.0$ and 5.0, qualitatively compared with the experimental schlieren images (Karnam, Saleem & Gutmark Reference Karnam, Saleem and Gutmark2023). No experimental data were found at
 $NPR = 2.3$. It can be seen that the locations of the shock cells match well with the experimental measurements. Differences exist in the downstream of the potential cores, where larger shock-cell spacings are obtained in the numerical results, especially in the case at
 $NPR = 5.0$. The differences may be related to the turbulent inflow condition at the nozzle inlet, as we did not consider the turbulent velocity profiles and turbulence intensities at the nozzle inlet, which may result in diminished shock dissipation in the simulations with smaller viscosity.
The time-averaged density gradient magnitudes ( $0 \leq |{\boldsymbol {\nabla } \bar \rho }| \leq 3$) from (upper half) present LES and (lower half) experimental schlieren (Karnam et al. Reference Karnam, Saleem and Gutmark2023) in (a,c) the minor-axis plane and (b,d) the major-axis plane at
 $NPR = (a{,}b)\ 3.0$ and (c,d) 5.0.

Figure 5 displays the distributions of time-averaged streamwise velocities at  $NPR = 3.0$ along the jet centreline and the minor/major axis of the nozzle at
 $x/h = 2$ (no available data at
 $NPR = 2.3$ and 5.0). The velocities along the jet centreline are overall in good agreement with the experimental (Gojon et al. Reference Gojon, Baier, Gutmark and Mihaescu2017) and LES results (Gojon et al. Reference Gojon, Gutmark and Mihaescu2019). In the transverse cross-section at
 $x/h=2$, the velocities along the minor axis are slightly under-predicted, and those along the major axis agree well with the experimental measurements.
Profiles of time-averaged streamwise velocities at  $NPR = 3.0$ along (a) the jet centreline, (b) the minor axis at
 $x/h = 2$ and (c) the major axis at
 $x/h = 2$.

The averaged shock-cell spacings are shown in figure 6 and compared with the theoretical predictions of Tam's model (Tam Reference Tam1988) and the experimental data (Karnam et al. Reference Karnam, Saleem and Gutmark2023). Note that the spacings are normalized by the equivalent diameter  $D_{eq}$. The simulated shock-cell spacings agree well with the theoretical predictions and closely match the experiment data. This indicates that the vortex-sheet formula in Tam's model is suitable for the current rectangular jets with
 $AR = 2.0$, although it was developed based on the assumption of infinite
 $AR$.
Normalized average shock-cell spacings.

The positions of far-field observers are schematically displayed in figure 7, and the emission angle ( $\theta$) is defined with respect to the upstream direction. Figure 8 shows the directivity of overall sound pressure levels (OASPLs) at far-field noise observers with a distance of
 $55 D_{eq}$ to the origin. The OASPLs in the simulations are estimated with Ffowcs Williams–Hawkings (FW-H) acoustic analogy method (Ffowcs Williams, Hawkings & Lighthill Reference Ffowcs Williams, Hawkings and Lighthill1969). The uncertainty of the selection of permeable surfaces has been investigated in our previous study (Chen et al. Reference Chen, Qiang, Wu, Yang and Li2024). Here, we adopt the largest permeable surface (
 $S_3$) in Chen et al. (Reference Chen, Qiang, Wu, Yang and Li2024) to minimize the impacts of turbulent disturbances in the shear layer. The dimensions of the permeable surface can be found in our previous study, and are not introduced here for brevity. In total, 50 000 snapshots of flow data on the permeable surface with a non-dimensional time interval of 0.01 are used to calculate FW-H equations. The trends of the predicted OASPLs have an overall good agreement with the experimental measurements (Karnam et al. Reference Karnam, Baier and Gutmark2019). At
 $NPR = 3.0$, two humps are observed in the upstream (
 $\theta \approx 40^{\circ }$) and downstream (
 $\theta \approx 150^{\circ }$) directions. At
 $NPR = 5.0$, only one hump is captured in the downstream (
 $\theta \approx 150^{\circ }$) direction. Roughly, the tendencies of the OASPL distributions share similarities in the minor- and major-axis planes. The magnitudes of the predicted OASPLs match the experimental data better in the downstream directions (
 $\theta \gtrsim 110^{\circ }$), but overpredict at
 $NPR = 3.0$ and underpredict at
 $NPR = 5.0$ in the upstream directions. The differences may possibly be ascribed to the neglect of the turbulent boundary-layer state at the nozzle inlet, which causes different emissions of fine-scale turbulence noise (Tam, Pastouchenko & Viswanathan Reference Tam, Pastouchenko and Viswanathan2005) between the current LES and experimental measurements. On the other hand, errors may exist in the experimental measurements, including inaccuracies of measurement instruments, anechoic environment and installation effects.
Schematic of far-field observer locations.

Far-field OASPLs comparison in the two planes at  $NPR = (a)\ 3.0$ and (b) 5.0.

The noise spectra at two emission angles ( $\theta = 45^{\circ }$ and
 $90^{\circ }$) in the minor-axis plane are shown in figure 9. The Strouhal number is defined as
 $St = {{f{D_{eq}}}/{{u_j}}}$, where
 $f$ is the dimensional frequency in Hz. The variations of the broadband noise are consistent with the experimental data (Karnam et al. Reference Karnam, Baier and Gutmark2019), and the frequencies of the tonal noise are also well predicted by LES. Over-predictions are observed at high frequencies, especially at
 $NPR=3.0$, which may be caused by increased fine-scale noise, as discussed in figure 8.
Far-field acoustic spectra comparison at two emission angles in the minor-axis plane at  $NPR = (a)\ 3.0$ and (b) 5.0.

Tam (Reference Tam1988) proposed a theoretical model to predict the frequency of the dominant screech tone
 \begin{align} \frac{fh}{u_j} & = \frac{{u_c}/{u_j}}{2(1 + {{u_c}}/{{a_\infty}}) ({M_j^2 - 1})^{1/2}} \left[\left(\frac{h_j}{b_j} \right)^2 + 1 \right]^{1/2}\nonumber\\ &\quad \times \left\{ \left[ \left( \frac{1 + \dfrac{\gamma - 1}{2} M_j^2}{1 + \dfrac{\gamma - 1}{2} M_d^2} \right)^{(\gamma + 1)/2(\gamma - 1)} \frac{M_d}{M_j} - 1 \right]\frac{b}{b + h} + 1 \right\}^{-1}, \end{align}
where  $h_j$ and
 $b_j$ are the ideally expanded jet dimensions,
 $a_{\infty }$ is the speed of sound in the ambient air and the convective velocity is assumed to be
 ${u_c} = 0.7{u_j}$. Table 2 compares the predicted frequencies of the dominant screech tone and its first harmonics with Reference TamTam's (Reference Tam1988) model and experimental measurements (Karnam et al. Reference Karnam, Baier and Gutmark2019). Good coincidences are exhibited among the numerical, theoretical and experimental results.
Comparisons of the frequencies of the screech tones among the numerical results, the Tam model (Tam Reference Tam1988) and the experimental measurements (Karnam et al. Reference Karnam, Baier and Gutmark2019).

4. Results and discussion
The acoustic characteristics of the baseline nozzle at different  $NPR$ values are investigated in § 4.1. Then, the effects of bevelled nozzles on the flow fields and far-field noise radiation are examined in §§ 4.2 and 4.3, respectively. Cross-correlation analysis is applied to investigate the organization of the shear layers in § 4.4. In § 4.5, dynamic mode decomposition is used to analyse the influences of bevelled nozzles on the dynamical coherent structures. Finally, the guided-jet wave modes in the screech feedback mechanism are analysed based on the frequency–wavenumber analysis in § 4.6.
4.1. Acoustic characteristics of the baseline nozzle at different NPR values
Figure 10 shows the contours of instantaneous pressure fluctuations in the minor-axis plane, coupling with three-dimensional vortical structures in the shear layers, visualized by isosurfaces of the  $Q$ criterion (Lesieur, Métais & Comte Reference Lesieur, Métais and Comte2005) and coloured by streamwise velocities. Small-scale stripe vortices induced by the Kelvin–Helmholtz instability (Yule Reference Yule1978; Liepmann & Gharib Reference Liepmann and Gharib1992) are seen near the nozzle lips. As they convect downstream, these vortical structures roll up and develop into large-scale hairpin-like vortices. In the further downstream regions, the fragmentation of vortical structures into smaller-scale vortices occurs due to the turbulent mixing. From the contours of pressure fluctuations, upstream-propagating acoustic waves (referred to as screech tones) and downstream-propagating turbulent mixing noise are clearly resolved for the jets at all
 $NPR$ values. At
 $NPR = 3.0$, the screech tone is more intense than those in the other two cases, which is highly linked to the strong flapping motion of jet plume in the minor-axis plane (Gojon et al. Reference Gojon, Gutmark and Mihaescu2019; Chen et al. Reference Chen, Gojon and Mihaescu2021, Reference Chen, Qiang, Wu, Yang and Li2024). The strongest turbulent mixing noise is observed at
 $NPR = 5.0$, which is mainly attributed to the highest convective velocities in the shear layer.
Contours of instantaneous pressure fluctuations ( $-0.005 \le p{'}/p_{\infty } \le 0.005$) in the minor-axis plane, with isosurfaces of the second invariant of velocity gradient tensors (
 $Q_{2nd} = 10$) coloured by streamwise velocities (
 $0 \le u/u_{j} \le 1$) for the jets at
 $NPR = (a)\ 2.3$, (b) 3.0 and (c) 5.0.

The far-field noise at observers with a distance of  $55D_{eq}$ from the centre of the nozzle exit is calculated with the FW-H method. The spectra of the far-field noise in the two planes are plotted in figure 11 as a function of the emission angle (
 $\theta$). Three typical acoustic components (Tam Reference Tam1995), screech tone, BBSAN and turbulent mixing noise (TMN), are observed in the supersonic jets, regardless of the
 $NPR$. The frequencies of the screech tone are observed at
 $St = 0.66$, 0.38 and 0.22 for the flow conditions at
 $NPR = 2.3$, 3.0 and 5.0, respectively, which are in good accordance with the predictions of Reference TamTam's (Reference Tam1988) model. At
 $NPR = 2.3$ and 3.0, the first harmonics of the screech tones are presented in the direction perpendicular to the jet axis (
 $\theta \approx 90^{\circ }$), similar to the observations in Tam, Parrish & Viswanathan (Reference Tam, Parrish and Viswanathan2014), but not seen at
 $NPR = 5.0$. The BBSAN is prominent in the sideline directions (
 $30^{\circ } \lesssim \theta \lesssim 120^{\circ }$) and spreads in a wide frequency band. It is gradually shifted towards higher
 $St$, as the emission angle increases. The TMN is mainly evident in the downstream directions (
 $\theta \gtrsim 140^{\circ }$) at low frequencies, and the amplitudes of TMN at
 $NPR = 5.0$ are much larger than those at smaller
 $NPR$ values. Compared with the noise emission in the minor-axis plane, no essential difference is observed in the major-axis plane. Nevertheless, the amplitudes of the screech tones and their harmonics are relatively weak in the major-axis plane. The BBSAN in the major-axis plane seems to be amplified at
 $NPR = 5.0$, which is probably associated with more intense shock cells formed in the major-axis plane than those in the minor-axis plane, as seen in figures 4(c) and 4(d).
Far-field noise spectra in (a–c) the minor-axis plane and (d–f) the major-axis plane for the jets at  $NPR = (a{,}d) 2.3$, (b,e) 3.0 and (c,f) 5.0.

To clarify the near-field oscillating mode of the jet plume, Fourier transformation is applied to the time-series pressure data saved at the grid points in the two principal planes, and 8192 consecutive snapshots with the non-dimensional time interval of 0.04 are used. The phase fields at the frequency of the dominant screech tone are depicted in figure 12. The rectangular jets obey different oscillating modes at different  $NPR$ values. At
 $NPR = 2.3$, as displayed in figures 12(a) and 12(d), the patterns of the phase fields are seen to be symmetric with respect to the jet centreline both in the minor- and major-axis planes. It indicates that the jet at
 $NPR = 2.3$ oscillates in a symmetric mode (i.e. A mode). At
 $NPR = 3.0$, an anti-symmetric pattern is exhibited in the minor-axis plane, and a symmetric pattern in the major-axis plane, which suggests that the jet plume is governed by a flapping mode (i.e. B mode) along the minor axis. At
 $NPR = 5.0$, the phase fields are shown to be anti-symmetric in both planes, forming a distinguishing helical mode (i.e. C mode). The mode switching from A to C mode closely resembles the experimental study of Powell, Umeda & Ishii (Reference Powell, Umeda and Ishii1992), who reported that, as the
 $NPR$ increases, the jet plume exhausted from a convergent circular nozzle switched from a symmetrical pattern to a flapping pattern, then to a helical pattern. Meanwhile, they also observed that the frequency of the screech tone was reduced with increasing
 $NPR$.
Fourier phase fields at the dominant screech frequencies in (a–c) the minor-axis plane and (d–f) the major-axis plane for the jets at  $NPR = (a{,}d)\ 2.3$, (b,e) 3.0 and (c,f) 5.0.

The phase values along  $y/h = 2.35$ in the minor-axis plane and
 $z/h = 2.35$ in the major-axis plane are extracted and plotted in figure 13, aiming to determine the source location of the dominant screech tone. The propagation direction of acoustic waves can be determined by the sign of the phase slope (Mercier, Castelain & Bailly Reference Mercier, Castelain and Bailly2017; Li et al. Reference Li, He, Zhang, Hao and Yao2019). Positive phase slope represents upstream-propagating acoustic waves, and a negative one characterizes downstream-travelling waves. Identified from figures 13(a) and 13(b), the screech tones at
 $NPR = 2.3$ and 3.0 are generated at
 $x/h \approx 2.5$ and 6.5, respectively, where the sign of the phase slope changes. The locations correspond to the end of the third and fourth shock cells in the jet plumes oscillating in the symmetric mode and flapping mode, respectively. At
 $NPR = 5.0$, the source location of the screech tone appears around
 $x/h = 12 \sim 14.5$, as seen in figure 13(c), corresponding to the region between the fifth and sixth shock cells. As the
 $NPR$ value increases, the source location of the screech tone moves further downstream, and a non-compact source location appears when the jet oscillates in the helical mode. These features are in line with the experimental study of rectangular jets by Karnam et al. (Reference Karnam, Baier and Gutmark2019).
Fourier phase values along  $y/h = 2.35$ (black solid line) in the minor-axis plane and
 $z/h = 2.35$ (red dashed line) in the major-axis plane: (a) corresponds to the jet at
 $NPR = 2.3$, (b) corresponds to the jet at
 $NPR = 3.0$, (c) corresponds to the jet at
 $NPR = 5.0$.

4.2. Effects of bevelled nozzles on time-averaged flow fields and turbulent statistics
The contours of time-averaged streamwise velocities (normalized by  $u_j$) in the two planes of the nozzles at
 $NPR = 2.3$ are shown in figure 14. At the exit of the baseline nozzle, the Mach disk is clearly captured due to the mutual interception of oblique shocks originating from the nozzle lips (Paramanantham, Janakiram & Gopalapillai Reference Paramanantham, Janakiram and Gopalapillai2022). For the single-bevelled nozzle, the jet plume in the minor-axis plane is deflected towards the direction of the long lip side, and the shock-cell structures are significantly altered in the deflected jet plume with an oblique shock wave at the exit of the nozzle. For the double-bevelled nozzle, the shock cells remain symmetric in the two planes. However, in comparison with the baseline nozzle, the length of the potential core is reduced due to the premature pressure recovery (Wu & New Reference Wu and New2017), and its width is significantly expanded in the major-axis plane.
Contours of the time-averaged streamwise velocities in (upper half) the minor-axis plane and (lower half) the major-axis plane for (a) the baseline nozzle, (b) the single-bevelled nozzle and (c) the double-bevelled nozzle at  $NPR = 2.3$. The streamwise velocities are normalized by the velocities of ideally expanded jets
 $u_j$.

Figure 15 shows the contours of time-averaged streamwise velocities at  $NPR = 3.0$. No Mach disk is formed at the exit of the baseline nozzle, and interactions of oblique shock waves with the shear layer appear in the jet plume. Similar to the case at
 $NPR = 2.3$, the jet plume in the minor-axis plane of the single-bevelled nozzle is deflected towards the direction of the long lip side, and two oblique shocks intersect at a position close to the long lip. Differently, triangular shock cells are alternately developed in the potential core. For the double-bevelled nozzle, the suppression of the potential core and the enhancement of the shear-layer mixing can be also seen in figure 15(c).
Contours of the time-averaged streamwise velocities in (upper half) the minor-axis plane and (lower half) the major-axis plane for (a) the baseline nozzle, (b) the single-bevelled nozzle and (c) the double-bevelled nozzle at  $NPR = 3.0$. The streamwise velocities are normalized by the velocities of ideally expanded jets
 $u_j$.

Figure 16 displays the contours of time-averaged streamwise velocities at  $NPR = 5.0$. As the jet at
 $NPR = 5.0$ is under-expanded, the shock-cell structures are characterized by barrel shocks (Franquet et al. Reference Franquet, Perrier, Gibout and Bruel2015; Zapryagaev, Kavun & Kiselev Reference Zapryagaev, Kavun and Kiselev2022). The jet plume exhausted from the single-bevelled nozzle is deflected towards the direction of the short lip side, which is different from the over-expanded jets at
 $NPR = 2.3$ and 3.0. For the double-bevelled nozzle, the width of the potential core is seen to be expanded in the minor-axis plane and compressed in the major-axis plane, which are in contrary to the situations in the over-expanded jets. The phenomenon is related to the premature expansion, which results in the early flow divergence at the nozzle exit along the minor-axis direction.
Contours of the time-averaged streamwise velocities in (upper half) the minor-axis plane and (lower half) the major-axis plane for (a) the baseline nozzle, (b) the single-bevelled nozzle and (c) the double-bevelled nozzle at  $NPR = 5.0$. The streamwise velocities are normalized by the velocities of ideally expanded jets
 $u_j$.

To explain the mechanism responsible for the plume deflection, figure 17(a–c) displays the contours of  ${\boldsymbol {V}} \boldsymbol {\cdot } \boldsymbol {\nabla } {\boldsymbol {P}}$ in the minor-axis plane, which are used to identify the shocks (dark) and the expansions (light) in the regions where the pressure gradient (
 $\boldsymbol {\nabla } {\boldsymbol {P}}$) and velocity (
 ${\boldsymbol {V}}$) are aligned with each other or not. The influences of the throat shocks inside the nozzle can be neglected, as the shock structures are identical inside the three nozzles. The main distinctions arise from the shocks generated at the nozzle exit. For the over-expanded jets (see (a,b)), asymmetric shocks are observed at the nozzle exits, whereas asymmetric expansion fans appear at the nozzle lips of the under-expanded jet (see (c)). The appearance of shocks or expansions is well known to be associated with the nozzle pressure returning to ambient pressure. Therefore, the pressure recovery near the nozzle lips is the key factor for the generation of asymmetric shocks or expansions. The corresponding time-averaged pressure fields are shown in figure 17(d–f). The local pressure difference at the nozzle exit is an indicator to judge the plume deflection. At
 $NPR = 2.3$ and 3.0, the short lip side undergoes an earlier pressure relief than the long lip side, causing a significantly higher pressure near the short lip side compared with the long lip side at the same streamwise location close to the nozzle exit. The pressure distribution is unbalanced between the short and long lips, which is consistent with the asynchronism of pressure recovery (Wlezien & Kibens Reference Wlezien and Kibens1988). The high-pressure region (marked with a black ‘*’) near the short lip drives the plume to deflect towards the low-pressure region (marked with a red ‘
 $\times$’) near the long lip. For the case at
 $NPR = 5.0$, the positions of high- and low-pressure regions are opposite, showing an inverted scenario.
Time-averaged contours of (a–c)  ${\boldsymbol {V}} \boldsymbol {\cdot } \boldsymbol {\nabla } {\boldsymbol {P}}$ and (d–f) pressure (
 $\bar p/{p_\infty }$) in the minor-axis plane for the single-bevelled nozzle at
 $NPR = (a{,}d)\ 2.3$, (b,e) 3.0 and (c,f) 5.0.

The deflection angles ( $\beta$) of the jet plumes exhausted from the single-bevelled nozzle are plotted in figure 18. Negative deflection angles represent the deflections towards the direction of the long lip side, otherwise the short lip side. The numerical results of the single-bevelled circular jets in the study of Wu & New (Reference Wu and New2017) are also added for a qualitative comparison. As the
 $NPR$ value increases, the deflection angle is increased in a roughly proportional manner (Wu & New Reference Wu and New2017), and changed from negative to positive value once the jet is shifted from over-expanded to under-expanded condition. The variations in deflection angles with
 $NPR$ values are ascribed to the different levels of static pressure imbalance along the minor-axis direction at different
 $NPR$ values.
Deflection angles of the jet plumes exhausted from the single-bevelled nozzle.

The Mach numbers along the centrelines of jet plumes are extracted and plotted in figure 19. Note that the jet centrelines in the single-bevelled nozzles are defined along the deflected jet plumes, rather than the  $x$ axis of the nozzle. At
 $NPR = 2.3$, since Mach disks exist at the exits of the baseline and double-bevelled nozzles, as displayed in figures 14(a) and 14(c), the flows past the Mach disk are all subsonic; whereas the flow along the jet centreline of the single-bevelled nozzle is alternatively supersonic and subsonic, allowing for the generation of oblique shock waves in the jet potential core. At
 $NPR = 3.0$ and 5.0, shock cells exist in jet potential cores, and the strengths of shock cells are weakened in the single-bevelled nozzles, particularly at
 $NPR = 3.0$. The length of the potential core in the double-bevelled nozzle is the shortest among three nozzles, regardless of the
 $NPR$ value. At the same time, the Mach number at a given position in the far wake region is the smallest in the double-bevelled nozzle, reflecting the strongest shear-layer mixing effect in this nozzle configuration.
Mach number distributions along the centrelines of jet plumes at  $NPR = (a) 2.3$, (b) 3.0 and (c) 5.0. Here, the
 $s$-axis denotes the transformed axis based on the
 $x$-axis of the nozzle in the direction of the potential core.

To clarify of the features of shear-layer mixing in the transverse direction, the velocity half-width ( $\delta _{0.5}$) at a given streamwise location is calculated from the jet centreline to the corresponding transverse coordinate where the mean streamwise velocity is
 $50\,\%$ of its value at the centreline. Note that, for the cases of single-bevelled nozzle, the half-widths on the upper and lower sides of the nozzle are different due to the mixing characteristics of the deflected jets. Figure 20 compares the variations of velocity half-widths in the streamwise direction. For the baseline nozzles, the half-widths are seen to grow rapidly in the minor-axis plane, but remain nearly constant or grow slowly in the major-axis plane. The larger shear-layer growth rates and spreading rates along the minor-axis direction are consistent with the previous studies (Zaman Reference Zaman1996; Gojon et al. Reference Gojon, Gutmark and Mihaescu2019; Chakrabarti et al. Reference Chakrabarti, Gaitonde, Nair Unnikrishnan, Stack, Baier, Karnam and Gutmark2022). For the flow exhausted from the bevelled nozzles, the spreading rates are drastically changed. (i) At
 $NPR = 2.3$, the half-widths in both planes are decreased considerably by using the single-bevelled nozzle, although the jet experiences more spreading at the downstream (
 $x/h > 11$) of the lower side. The increased spreading indicates there exists a jet-mixing preference on the deflected side. The double-bevelled nozzle accelerates the spreading significantly in the major-axis plane (see (d)), but the suppressions are observed in the minor-axis plane (see (a)). (ii) At
 $NPR = 3.0$, the impact of the single-bevelled nozzle resembles that at
 $NPR = 2.3$, with the exception that the jet-mixing preference indistinctively shifts to the upper side of the nozzle (see (b)). The jet with the double-bevelled nozzle spreads at a relatively faster rate than the baseline jet in both planes, particularly in the major-axis plane. (iii) At
 $NPR = 5.0$, the single-bevelled nozzle is seen to expand and compress the half-widths on the lower and upper sides, respectively, without a discernible influence in the major-axis plane. The spreading rate of the jet with the double-bevelled nozzle shows an significant increase in the minor-axis plane, while exhibiting the opposite behaviour in the major-axis plane, which differs from the observations under the over-expanded conditions. In summary, the plots in figure 20 reveal that the single-bevelled nozzles can suppress the shear-layer mixing in the major-axis plane to varied extents, and the enhanced mixing effects show directional preferences in the minor-axis plane under different conditions. The double-bevelled nozzle has actions to significantly enhance the entrainment and mixing effect in one plane and suppress the spreading in the other plane. The enhanced mixing effect dominates the overall spreading rate, resulting in shorter potential cores (Ioannou & Laizet Reference Ioannou and Laizet2018), as displayed in figure 19.
Streamwise velocity half-width of the jets in (a–c) the minor-axis plane and (d–f) the major-axis plane at  $NPR = (a{,}d)\ 2.3$, (b,e) 2.3 and (c,f) 5.0.

The cross-sectional contours of normalized turbulent kinetic energy (TKE $/{u_j^2}$) at four streamwise locations (
 $x/h = 2$, 6, 10 and 14) of the jets at three
 $NPR$ values are displayed in figure 21. For the baseline nozzles (see (a–c)), the TKE distributions imitate the shape of the nozzle exit at the section close to the nozzle. Further downstream, the axis-switching phenomena in rectangular jets (Chen & Yu Reference Chen and Yu2014; Kim & Park Reference Kim and Park2020) can be observed, especially at the largest
 $NPR$. The sharp corners are able to induce four streamwise vortex pairs in the downstream sections (Grinstein Reference Grinstein1995; Bhide et al. Reference Bhide, Siddappaji and Abdallah2021), which are responsible for the inward penetrations of the TKE at the four edges and outward spreads at the four sharp corners. The TKE magnitudes at the edges are relatively stronger than those at the corners. For the single-bevelled nozzles (see (d–f)), the TKE distributions are asymmetric with respect to the major-axis plane, which is attributed to the asymmetric intensities of the corner vortex pairs. The stronger vortices on the short lip sides result in the relatively wider mixing layers than those on the long lip sides. The influences of the single bevel on the TKE magnitudes and axis switching are not obvious, if compared with the baseline nozzle. Different situations are observed in the cases of double-bevelled nozzles (g–i). The vortical effects of sharp corners appear to be absent, and the distribution and evolution of the TKE levels are preferred in one direction. At
 $x/h = 6$ and 10, the TKE magnitudes are significantly enhanced at all
 $NPR$ values, and the TKE distributions are elongated in the major-axis direction of the over-expanded jets (
 $NPR = 2.3$ and 3.0), but elongated in the minor-axis direction of the under-expanded jet (
 $NPR = 5.0$).
Cross-sectional contours of turbulent kinetic energy at different streamwise locations of the jets issued from (a–c) the baseline nozzle, (d–f) the single-bevelled nozzle and (g–i) the double-bevelled nozzle at  $NPR = (a{,}d{,}g)\ 2.3$, (b,e,h) 3.0 and (c,f,i) 5.0.

It is known that the modifications of mean flow structures inadvertently influence the aerodynamic performance. We calculate the nozzle thrust by applying the following integrated equation at the nozzle exit plane:
 \begin{align} Thrust =
{\underbrace{\unicode{x222F} {\dot m{u_e}\, {\rm d}
A}}_{\textit{Momentum thrust}}} + {\underbrace{\unicode{x222F} {(
{{p_e} - {p_\infty }})\, {\rm d} A}}_{\textit{Pressure thrust}}}, \end{align}
where  $\dot m$ is the mass flow rate,
 ${u_e}$ is the axial velocity at the nozzle exit,
 ${p_e}$ is the static pressure at the nozzle exit,
 ${p_\infty }$ is the ambient pressure,
 ${\rm d} A$ is the element area projected along the axial direction and
 $\unicode{x222F}$ denotes surface integration. Figure 22 shows the non-dimensional thrusts and corresponding thrust loss coefficients for the nozzles. At the over-expanded condition (
 ${p_e} < {p_\infty }$), the pressure thrust contributes negatively to the gross thrust; conversely, it contributes positively at the under-expanded condition (
 ${p_e} > {p_\infty }$). The momentum thrust dominates the gross thrust, regardless of the inflow conditions. As seen in figure 22(d–f), the gross thrusts are increased for all bevelled nozzles, and the increased values are specified in table 3. By using the single-bevelled nozzle, the momentum thrust is reduced and the pressure thrust is increased, regardless of the jet operating conditions. The increase of gross thrust results from the increase of pressure thrust. The degradation in momentum thrust is attributed to the reduction of the mass flow rate, as the effective flow area of the single-bevelled nozzle is reduced due to the non-uniform pressure distribution at the exit plane (Viswanathan Reference Viswanathan2005; Viswanathan & Czech Reference Viswanathan and Czech2011). The reduced shock strength at the single-bevelled nozzle exit has a beneficial effect for pressure thrust improvement. In the cases of double-bevelled nozzle, the increase of gross thrust is determined by the increased pressure thrust at
 $NPR=2.3$ and 3.0, and momentum thrust at
 $NPR=5.0$. It can be seen that the momentum thrust is lower than that of the baseline nozzle at
 $NPR = 2.3$, which is related to the drop in axial flow rate resulting from the suppression of the jet width along the minor-axis direction (shown in figure 20a). However, the improvement is observed at
 $NPR = 3.0$ and 5.0, and it benefits from the growth of the jet spreading along the minor-axis direction, as displayed in figures 20(b) and 20(c). Increased pressure thrust is seen as a result of weakened shock wave on the double-bevelled exit plane at the over-expanded conditions, whereas the enhanced expansion fan on the exit leads to a loss in pressure at the under-expanded condition.
Comparisons of (a–c) non-dimensional thrusts and (d–f) thrust loss coefficients between the baseline and bevelled nozzles at  $NPR = (a{,}d)\ 2.3$, (b,e) 3.0 and (c,f) 5.0.

The gross thrust loss coefficients.

4.3. Effects of bevelled nozzles on the far-field noise radiation
The sound pressure levels at far-field observers with a distance of  $55 D_{eq}$ to the nozzle origin are calculated with the FW-H acoustic analogy method. The parameter settings are the same as those introduced in § 3.3. Note that, for the single-bevelled nozzles, the FW-H permeable surfaces are designed along the deflected jet plumes, in order to prevent intersecting with the nonlinear turbulence. The observers in the minor-axis planes of the single-bevelled nozzles are separated into upper (i.e. short lip side) and lower (i.e. long lip side) ones, considering the asymmetries of jet plumes with respect to the
 $x$-axis.
Figure 23 shows the variations of OASPLs in the two planes. For the symmetrically oscillating jet at  $NPR = 2.3$ (see (a,d)), the single-bevelled nozzle is capable of reducing the OASPLs at the upstream angels (
 $\theta < 45^{\circ }$) by 1–3 dB in the minor-axis plane and approximately 1 dB in the major plane. The OASPLs at lower observers of the single-bevelled nozzle are mostly larger than those of upper ones, leading to noise increases at the downstream angles if compared with the baseline nozzle. It is associated with the stronger mixing noise generated by the fast shear-layer spreading at the downstream locations of the single-bevelled jet, as shown earlier in figure 20(a). Using the double-bevelled nozzle, efficient noise reductions are obtained at all emission angles in the minor-axis plane, with a maximum reduction of 5 dB seen at
 $\theta = 35^{\circ }$; whereas, in the major plane, noise reductions only appear at upstream angles. Overall, the double-bevelled nozzle performs better than the single-bevelled nozzle in reducing the OASPLs, except at
 $85^{\circ } \leq \theta \leq 150^{\circ }$ in the major-axis plane. This differs from the observation in the experimental study of the supersonic circular jet (Wei et al. Reference Wei, Chua, Lu, Lim, Mariani, Cui and New2022), in which the double-bevelled nozzle does not suppress the noise levels but amplifies the amplitude of the screech tone significantly. It should be noted that the oscillation mode of the circular jet (Wei et al. Reference Wei, Chua, Lu, Lim, Mariani, Cui and New2022) is helical (i.e. anti-symmetric), but the current rectangular jet at
 $NPR = 2.3$ oscillates in a symmetric mode.
Far-field OASPLs comparison between the jets issued from the baseline nozzle and the jets issued from the bevelled nozzle at various emission angles in (a–c) the minor-axis plane and (d–f) the major-axis plane at  $NPR = (a{,}d)\ 2.3$, (b,e) 3.0 and (c,f) 5.0.

For the flapping jet at  $NPR = 3.0$, as shown in (b,e), the OASPLs at all emission angles are reduced in both planes by using the single-bevelled nozzle, especially at upstream angles, where maximum reductions of 6 and 3 dB are obtained in the minor- and major-axis plane, respectively. For the double-bevelled nozzle, the suppressions of OASPLs are obviously seen at
 $\theta < 135^{\circ }$ in the major-axis plane, but dramatic increases are shown in the upstream (
 $\theta \leq 55^{\circ }$) and sideline (
 $85^{\circ } \leq \theta \leq 110^{\circ }$) directions of the minor-axis plane. Regarding the helically oscillating jet at
 $NPR = 5.0$, as seen in (c,f), the bevelled nozzle has fewer influences on the OASPLs, if compared with the jets at
 $NPR = 2.3$ and 3.0. Importantly, the double-bevelled nozzle is able to suppress the peak noise levels at
 $\theta \approx 150^{\circ }$, but causes considerable increases at upstream and sideline emission angles.
The variations of OASPLs are linked to the features of the noise spectra. Here, the noise spectra at three emission angles ( $\theta = 35^{\circ }, 90^{\circ }$ and
 $140^{\circ }$) in the minor-axis plane are displayed in figure 24, attempting to explain the changes of OASPLs in figure 23(a–c). At
 $NPR = 2.3$, the screech tone at
 $\theta = 35^{\circ }$ is evidently mitigated by the single-bevelled nozzle and completely eliminated by the double-bevelled nozzle. It is directly related to the noise suppression at the upstream emission angles (see figure 23a), where the screech tone dominates the overall sound pressure levels. At
 $\theta = 90^{\circ }$, the harmonics of the screech tone is suppressed by the bevelled nozzles, which may cause the reduction of OASPLs. However, the OASPL at this angle is increased in the case of single-bevelled nozzle, which is ascribed to the enhanced broadband noise at
 $0.8 \lesssim St \lesssim 4.0$. The enhanced broadband noise is mostly related to the increase of the shock strength and its interaction with the shear layer, as seen in figure 19(a). At
 $NPR = 3.0$, the elimination or amplification of the screech tone (or its harmonics) at
 $\theta = 35^{\circ }$ and
 $90^{\circ }$ is the key reason for the changes of OASPLs shown in figure 23(b). In the case of the double-bevelled nozzle, the frequencies of the screech tone and its harmonics are shifted to higher values, which are attributed to the shortened shock-cell spacings (see figure 19b), supported by the theory of Powell (Reference Powell1953). The noise spectra at
 $NPR = 5.0$ have no apparent difference among the three nozzles, except that the screech tone at
 $\theta = 35^{\circ }$ is enhanced and shifted to a higher frequency by the double-bevelled nozzle. These features also support the variations of OASPLs in figure 23(c).
Far-field spectra comparison between the jets issued from the baseline nozzle and the jets issued from the bevelled nozzle at three emission angles in the minor-axis plane at  $NPR = (a)\ 2.3$, (b) 3.0 and (c) 5.0.

4.4. Two-point space–time cross-correlation analysis
In order to investigate the propagation of flow and acoustic waves in the jet shear layers, two-point space–time cross-correlation analysis is performed using the fluctuating pressure data obtained along the lower shear layers in the minor-axis plane. The reference point is positioned at  $x/h=5.0$, and 150 targeted points are equally distributed from the nozzle lip to the streamwise location of
 $x/h = 15$. The correlations are presented in figure 25. The maximum correlation is visible at
 $(x/h, \tau ) = (5.0, 0)$, since the cross-correlation is transformed into the auto-correlation at the reference point.
The space–time cross-correlations of pressure fluctuations along the shear layers in the minor-axis plane for (a,d,g) the baseline nozzles, (b,e,h) the single-bevelled nozzles and (c,f,i) the double-bevelled nozzles, at  $NPR = (a\unicode{x2013}c)\ 2.3$, (d–f) 3.0 and (g–i) 5.0.

The results of the baseline nozzle are shown in (a,d,g). Well-organized stripes with two kinds of slopes are periodically arranged along the time-lag axis. The positive slopes imply that the acoustic waves are propagating in the upstream direction, and the negative slopes are related to the downstream-travelling hydrodynamic waves. The time lag exhibits the same periodic interval for the acoustic and hydrodynamic waves, which also corresponds to the dominant frequency of the screech. It reveals that the downstream-propagating acoustic waves at the dominant frequency of screech are linked to the convection of coherent flow structures in the shear layer. The correlation coefficients are highest at  $NPR = 3.0$ and relatively faint at
 $NPR = 5.0$. This phenomenon is in line with the amplitudes of the screech shown in figure 11. For the bevelled nozzles, the situations are similar. Stripe patterns are observed in (b,f,i), at the conditions with the generation of screech. For the cases without screech, the organized stripes disappear. For instance, at
 $NPR = 3.0$, the stripe patterns are analogous between the baseline and double-bevelled nozzle, and the correlation coefficients are amplified in the double-bevelled nozzle, suggesting that the screech is more evident than that in the baseline nozzle. The invisible stripe patterns in the single-bevelled nozzle indicate the elimination of the screech.
4.5. Dynamic mode decomposition
Dynamic mode decomposition (DMD) is a data-driven modal decomposition method to identify relevant dynamical structures in turbulent flows (Schmid Reference Schmid2010; Schmid et al. Reference Schmid, Li, Juniper and Pust2010; Taira et al. Reference Taira, Brunton, Dawson, Rowley, Colonius, McKeon, Schmidt, Gordeyev, Theofilis and Ukeiley2017). Given a sequence of  $m$ snapshots of the flow field, the sequence is condensed into a matrix notation
 \begin{equation} {\boldsymbol{\mathsf{Q}}}_1^{m} = [ {{{{\mathsf{q}}}_1},{{{\mathsf{q}}}_2}, \ldots ,{{{\mathsf{q}}}_{m}}} ].\end{equation}
Assuming there exists a linear operator  ${\boldsymbol{\mathsf{B}}}$, the snapshot
 ${{\boldsymbol {q}}_{i + 1}}$ is able to be obtained from the previous snapshot
 ${{\boldsymbol {q}}_i}$, that is
 \begin{equation} {{\boldsymbol{q}}_{i + 1}} = {\boldsymbol{\mathsf{B}}}{{\boldsymbol{q}}_i}, \end{equation}
where the matrix  ${\boldsymbol{\mathsf{B}}}$ represents the system matrix of the high-dimensional flow field, which describes the dominantly dynamical behaviour of the flow. Then we have
 \begin{equation} {\boldsymbol{\mathsf{Q}}}_2^{m} = [{{\boldsymbol{q}}_2},{{\boldsymbol{q}}_3}, \ldots ,{{\boldsymbol{q}}_{m}}] = [{\boldsymbol{\mathsf{B}}}{{\boldsymbol{q}}_1},{\boldsymbol{\mathsf{B}}}{{\boldsymbol{q}}_2}, \ldots ,{\boldsymbol{\mathsf{B}}}{{\boldsymbol{q}}_{m-1}}] = {\boldsymbol{\mathsf{B}}}{\boldsymbol{\mathsf{Q}}}_1^{m-1}.\end{equation}
As the number of snapshots ( $m$) increases, the sequence
 ${\boldsymbol{\mathsf{Q}}}_1^{m}$ is able to capture the dominant feature of flow field, and the last snapshot
 ${{\boldsymbol {q}}_{m}}$ can be expressed as a linear combination of the previous snapshots
 \begin{equation} {{\boldsymbol{q}}_{m}} = {c_1}{{\boldsymbol{q}}_1} + {c_2}{{\boldsymbol{q}}_2} + \cdots + {c_{m-1}}{{\boldsymbol{q}}_{m-1}}= {\boldsymbol{\mathsf{Q}}}_1^{m-1}{\boldsymbol{c}},\end{equation}
where the vector  ${\boldsymbol {c}} = ({c_1}, {c_2}, \ldots, {c_{m-1}})$, and the coefficient
 ${c_i}$ can be obtained by solving the least-squares solution of (4.5) utilizing singular value decomposition. Then, (4.4) is further written as
 \begin{equation} {\boldsymbol{\mathsf{B}}}{\boldsymbol{\mathsf{Q}}}_1^{m-1}= {\boldsymbol{\mathsf{Q}}}_2^{m} = {\boldsymbol{\mathsf{Q}}}_1^{m-1}{\boldsymbol{\mathsf{C}}}, \end{equation}
with the matrix  ${\boldsymbol{\mathsf{C}}}$ being
 \begin{equation} {\boldsymbol{\mathsf{C}}} =
\left[ \begin{array}{@{}ccccc@{}} 0 & 0 & \cdots & 0 & {{c_1}}\\
1 & 0 & \cdots & 0 & {{c_2}}\\ 0 & 1 & \cdots & 0 &
{{c_3}}\\ \vdots & {} & \ddots & {} & \vdots \\ 0 & 0 &
\cdots & 1 & {{c_{m-1}}} \end{array} \right].
\end{equation}
With the above matrix  ${\boldsymbol{\mathsf{C}}}$, we definite the residual of the linear combination as
 \begin{equation} {\boldsymbol{r}} = {\boldsymbol{q}}_{m} - {\boldsymbol{\mathsf{Q}}}_1^{m-1}{\boldsymbol{c}}. \end{equation}
When the residual  ${\boldsymbol {r}}$ is minimized, the eigenvalues of the matrix
 ${\boldsymbol{\mathsf{C}}}$ are approximations of the eigenvalues of the matrix
 ${\boldsymbol{\mathsf{B}}}$. These eigenvalues are mapped onto the complex plane by a logarithmic mapping, in which the real part represents the growth rate of the mode, and the imaginary part gives the frequency information. The eigenvector (
 $\boldsymbol {\upsilon }$) or the spatial variation of the DMD mode (
 ${\boldsymbol {D}}$) can be obtained from the eigenvector (
 ${\boldsymbol {T}}$) of the matrix
 ${\boldsymbol{\mathsf{C}}}$ and the matrix
 ${\boldsymbol{\mathsf{Q}}}$, that is,
 \begin{equation} {\boldsymbol{D}} = {\boldsymbol{\mathsf{Q}}}_1^{m-1}{\boldsymbol{T}}^{-1}. \end{equation}
The  $L2$ norm of the eigenvector
 $\boldsymbol {\upsilon }$ is regarded as the energy of each mode. More mathematical theories and implementation details of the DMD algorithm are given in Schmid (Reference Schmid2010).
In this study, we use DMD to extract the dynamical structures of shear-layer oscillations and the motions of shock cells at pertinent frequencies. The DMD analyses of the nine cases (three nozzles at three  $NPR$ values) are performed by using the pressure fluctuations in the minor- and major-axis planes. In each case, a total of 4096 consecutive snapshots with a non-dimensional time interval of 0.05 are employed. The time duration are approximately 46 times longer than the largest period of the screech tone at
 $St = 0.22$ (i.e. the non-dimensional time is approximately equal to 4.38).
The energy spectra of the DMD modes are plotted in figure 26. For the baseline nozzle at  $NPR = 2.3$, the dominant mode has a peak frequency at
 $St = 0.66$, which is consistent with the frequency of the screech tone in the noise spectrum, as shown in figure 24(a). Meanwhile, the harmonic mode at the frequency of
 $St = 1.32$ also corresponds to the first harmonics of the screech tone. It indicates that the identified low-rank dynamical structures are linked to the generation of the tonal noise (Lim et al. Reference Lim, Wei, Zang, Vevek and Cui2020; Karami & Soria Reference Karami and Soria2021). With the single- and double-bevelled nozzles, the peak in the energy spectra is suppressed or eliminated, implying that the spatial structures in the baseline case are disturbed. Figures 26(b) and 26(c) show that the frequencies of the most energetic modes of the baseline cases at
 $NPR = 3.0$ and 5.0 are also consistent with the frequencies of the dominant screech tones. Differently, the distinct dynamic modes are absent by using the single-bevelled nozzle; whereas the double-bevelled nozzle enhances the energy of DMD modes associated with the screech tone and its harmonics. These features are similar to those in the noise spectra.
The DMD energy spectra in the minor-axis plane for the jets at  $NPR = (a)\ 2.3$, (b) 3.0 and (c) 5.0. The red circles represent the chosen dominant modes.

Figure 27 illustrates the spatial distributions of the real part of the DMD modes at the most energetic frequencies, which are marked by red circles in figure 26. Note that, for the case without a dominant frequency, we choose the same frequency as the baseline nozzle. The wavepackets in figure 27 represent the spatially modulating standing waves (Westley & Woolley Reference Westley and Woolley1975; Panda Reference Panda1999; Gojon & Bogey Reference Gojon and Bogey2017), which characterize the interactions between the upstream-propagating acoustic waves and the downstream-travelling hydrodynamic instability waves. The symmetric/anti-symmetric patterns of the baseline nozzle are perfectly consistent with the distributions of the Fourier phase fields in figure 12, but disturbed by the bevelled nozzles. At  $NPR = 2.3$, the well-organized symmetric mode remains in the single-bevelled nozzle, but tilted along the centreline of the deflected potential core. However, chaotic and fragmented patterns are seen in the shear layer of the double-bevelled nozzle, and the upstream-propagating acoustic stripes are invisible, suggesting the destruction of the fluid-acoustic feedback loop and the absence of the screech tone in the upstream direction. At
 $NPR = 3.0$ and 5.0, anti-symmetric modes are seen in the minor-axis planes of the baseline and double-bevelled nozzles, but disappear in the cases of single-bevelled nozzle. It supports that the regularly oscillating shear layer is a vital factor for the generation of the screech tone.
The real part of the DMD modes at the dominant frequencies in the minor-axis plane for (a,d,g) the baseline nozzles, (b,e,h) the single-bevelled nozzles and (c,f,i) the double-bevelled nozzles at  $NPR = (a\unicode{x2013}c)\ 2.3$, (d–f) 3.0 and (g–i) 5.0.

The DMD modes in the major-axis planes are shown in figure 28. Note that the major-axis planes in the cases of single-bevelled nozzle are deflected along the centrelines of jet plumes. Well-organized wavepackets are seen in the cases with the generation of screech tones, and fragmented structures are seen in the cases without the generation of screech tones, similar to the observations in the minor-axis planes shown in figure 27. Importantly, in the cases with the generation of screech tones, the oscillating modes of shear layers are not altered by the bevelled nozzles, that is, the symmetrical mode in the single-bevelled nozzle at  $NPR = 2.3$, the flapping mode in the double-bevelled nozzle at
 $NPR = 3.0$ and the helical mode in the double-bevelled nozzle at
 $NPR = 5.0$, are in line with the modes in the baseline nozzles at corresponding
 $NPR$ values. On the other hand, in the cases without the generation of screech tones, the regularly oscillating modes are absent.
The real part of the DMD modes at the dominant frequencies in the major-axis plane for (a,d,g) the baseline nozzles, (b,e,h) the single-bevelled nozzles and (c,f,i) the double-bevelled nozzles at  $NPR = (a\unicode{x2013}c)\ 2.3$, (d–f) 3.0 and (g–i) 5.0.

Figure 23(b) has suggested that considerable increases of OASPLs are observed in the sideline emission angles of the double-bevelled nozzle. Here, we explain this phenomenon by showing the first harmonic DMD modes in the minor-axis planes of the baseline and double-bevelled nozzles at  $NPR = 3.0$, as displayed in figure 29. It can be seen that the acoustic beams are non-compactly distributed and mainly radiated in the sideline directions (
 $\theta \approx 90^{\circ }$). Their scales are smaller than those of the dominant DMD modes, as expected. Tam et al. (Reference Tam, Parrish and Viswanathan2014) stated that the high-order harmonic tones are initiated from the interaction of the nonlinear harmonic instability waves and the shock cells, and their directional radiation features are different from those of the dominant screech tones. The most energetic instability wave, which drives the fluid-acoustic feedback loop, can be transferred to high-order modes, and cause intense harmonic tones radiated in different directions (Tam et al. Reference Tam, Parrish and Viswanathan2014; Semlitsch et al. Reference Semlitsch, Malla, Gutmark and Mihăescu2020). In the current jets, the harmonic instability wavepackets in the jet plumes are observed to be symmetric, together with symmetric acoustic beams radiated in the sideline directions, which are in contrast to the asymmetric features of the flapping jets at the dominant screech frequencies. The patterns of the harmonic instabilities and acoustic waves are more regular and stronger in the jet with double-bevelled nozzle, as shown in figure 29(b), providing evidence for the noise level increase in the sideline emission angles.
The real part of the DMD modes at the first harmonic frequencies in the minor-axis plane for (a) the baseline nozzle and (b) the double-bevelled nozzle at  $NPR = 3.0$.

4.6. Frequency–wavenumber analysis
Four fundamental components, including downstream-convecting turbulent structures (Sinha et al. Reference Sinha, Rodríguez, Brès and Colonius2014), shock leakage (Suzuki & Lele Reference Suzuki and Lele2003; Edgington-Mitchell et al. Reference Edgington-Mitchell, Weightman, Lock, Kirby, Nair, Soria and Honnery2021b), upstream-travelling acoustic waves and the receptivity mechanism near the nozzle lips (Karami et al. Reference Karami, Stegeman, Ooi, Theofilis and Soria2020), exist in the fluid-acoustic feedback mechanism, which is responsible for the generation of the screech tones in supersonic jets (Edgington-Mitchell Reference Edgington-Mitchell2019; Edgington-Mitchell et al. Reference Edgington-Mitchell, Wang, Nogueira, Schmidt, Jaunet, Duke, Jordan and Towne2021a). The upstream-propagating guided-jet modes (i.e. the neutral acoustic modes) (Shen & Tam Reference Shen and Tam2002; Edgington-Mitchell et al. Reference Edgington-Mitchell, Jaunet, Jordan, Towne, Soria and Honnery2018; Mancinelli et al. Reference Mancinelli, Jaunet, Jordan and Towne2019), rather than the classical free-stream sound waves (Powell Reference Powell2002), play a vital role in closing the resonance loop. In this subsection, the spatio-temporal features of the jet shear layers are analysed by using a vortex-sheet model proposed by Tam & Norum (Reference Tam and Norum1992), to shed light on the existence of upstream-propagating guided-jet modes, and to illustrate that these waves are directly related to the generation of the screech tones, as well as to examine the impacts of the bevel cuts on these guided-jet modes and the screech feedback mechanisms.
Based on the linearized equations of a compressible inviscid flow, the vortex-sheet model (Tam & Norum Reference Tam and Norum1992) can predict the dispersion relations of the guided-jet wave modes, which are given as
 \begin{equation} \frac{[( \omega - u_jk)^2/a_j^2 - k^2 ]^{1/2} \rho _\infty \omega^2}{( k^2 - \omega^2/a_\infty^2 )^{1/2} \rho _j (\omega - u_j k )^2} - \cot \{ [( \omega - u_jk )^2/a_j^2 - k^2]^{1/2} h_j/2 \} = 0,\end{equation}
for symmetric modes, and
 \begin{equation} \frac{[(\omega - u_jk)^2/a_j^2 - k^2 ]^{1/2} \rho_\infty \omega^2}{(k^2 - \omega^2/ a_\infty^2 )^{1/2} \rho_j ( \omega - u_jk )^2} + \tan \{ [(\omega - u_j k)^2/a_j^2 - k^2 ]^{1/2} h_j/2\} = 0,\end{equation}
for anti-symmetric modes, where  $k$ is the wavenumber,
 $\omega$ is the angular frequency,
 $a_{j}$ and
 $a_{\infty }$ are the speeds of sound in the ideally expanded jet and the ambient air, respectively, and
 $\rho _{j}$ and
 $\rho _{\infty }$ are the densities in the ideally expanded jet and the ambient air, respectively. Figure 30 shows the dispersion relations of the guided-jet modes predicted using the vortex-sheet model for the jets at three
 $NPR$ values. The dispersion relations (solid lines) of the symmetric modes (referred to as S1, S2 and S3) and the anti-symmetric modes (referred to as A1, A2 and A3) are displayed in (a) and (b), respectively. The relations with negative slopes represent the guided-jet modes propagating upstream with negative group velocities. The dashed lines, which connect the lower limits (marked by triangles) of the negative slopes, denote the speeds of the upstream-propagating sound waves, i.e.
 $a_{\infty }$. The upper limits of the negative slopes correspond to the zero slopes of the relation curves. It can be seen that upstream-propagating guided-jet modes can only exist within an allowable frequency range, that is the range between the upper and lower limits, and the propagation velocities of the waves are smaller than the ambient speeds of sound waves.
The vortex-sheet dispersion relations of (a) the symmetric and (b) the anti-symmetric guided-jet wave modes (solid lines) for three jets issued from the baseline nozzle. The triangles indicate the lower limits of the modes. The dispersion relations of acoustic waves are represented by the dashed lines.

The simulated pressure fluctuations in the minor-axis plane along  $y/h = -0.5$ from
 $x/h =0$ to 15 are spatio-temporally Fourier transformed into the frequency–wavenumber spectra shown in figure 31. For the cases of the single-bevelled nozzle, we use the instantaneous data along the deflected shear layers. The theoretical predictions of selected guided-jet wave modes are also added in figure 31 for comparison. In the positive wavenumber regions (
 $k>0$), the high contour levels are seen to be organized along the line of
 $k = {\omega }/u_{c}$ for all cases, where
 $u_{c} = 0.68u_{j}$ is the convective velocity of the Kelvin–Helmholtz instability waves. The line represents the trace of the downstream-convecting turbulent structures, which is a hydrodynamic component in the feedback loop. In the negative wavenumber regions (
 $k<0$), the clusters of the contours help to indicate the frequencies of the dominant screech tones and their relations with the theoretically predicted guided-jet wave modes. For the cases with the generation of screech tones, as shown in (a,b,d,f,g,i), the contours are clustered at the same frequency of the corresponding dominant screech tone, and fall between the upper and lower limits of a theoretically predicted guided-jet wave mode, that is, the symmetric mode S2 in the baseline nozzle at
 $NPR = 2.3$, the symmetric mode S2 in the single-bevelled nozzle at
 $NPR = 2.3$, the anti-symmetric mode A1 in the baseline nozzle at
 $NPR = 3.0$, the anti-symmetric mode A1 in the double-bevelled nozzle at
 $NPR = 3.0$, the anti-symmetric mode A1 in the baseline nozzle at
 $NPR = 5.0$ and the anti-symmetric mode A1 in the double-bevelled nozzle at
 $NPR = 5.0$. The symmetric/anti-symmetric features are identical to the observations of the Fourier phase analysis, further confirming the dynamical modes (symmetric, flapping and helical modes) of jet oscillations observed in § 4.4. The above results also reveal that, at the frequency of the dominant screech tone, the upstream-propagating guided-jet modes propagate inside the jet plume with the group velocities close to the speed of sound waves, and they make contributions to the closure of the feedback mechanism. Compared with the baseline nozzle, the magnitudes of the clustering bands are suppressed in the single-bevelled nozzle at
 $NPR = 2.3$, while they are amplified in the double-bevelled nozzles at
 $NPR = 2.3$ and 5.0. The suppression/enhancement of the guided-jet modes corresponds to the reduction/increase in the noise levels of the screech tones, which have been discussed in § 4.3, further emphasizing the importance of the guided-jet modes in the feedback loop. On the other hand, for the cases without the generation of the screech tones, as displayed in (c,e,h), no evident band is clustered in the allowable frequency range between the upper and lower limits of a theoretically predicted mode, as expected. This suggests that no neutral waves exist to trigger the acoustic resonance and further supports that the upstream-propagating guided-jet mode is a critical factor in closing the feedback loop.
Frequency–wavenumber spectra of the pressure fluctuations in the minor-axis plane along the shear layers for the jets issued from (a,d,g) the baseline nozzle, (b,e,h) the single-bevelled nozzle and (c,f,i) the double-bevelled nozzle at  $NPR = (a\unicode{x2013}c)\ 2.3$, (d–f) 3.0 and (g–i) 5.0. The solid lines provide the theoretical dispersion relations of guided-jet wave modes plotted in the same way as in figure 30. The red and blue dashed lines represent the dispersion relations of downstream-convecting structures and upstream-propagating acoustic waves, respectively.

Figure 32 shows the contours of frequency–wavenumber spectra in the major-axis plane calculated by using the pressure fluctuations along  $z/h = 1$ (deflected shear layers in the single-bevelled jets) from
 $x/h = 0$ to 15. Similar to the observations in the minor-axis plane, the clustering bands in the negative wavenumber regions illustrate the existence of the guided-jet modes, and their symmetric/anti-symmetric features are identical to the observations of the Fourier phase and DMD analysis. Differently, the magnitudes of the guided-jet modes are relatively weaker in the major-axis plane, especially when the flapping mode governs the oscillations of the jet plume, i.e. the baseline and double-bevelled nozzles at
 $NPR = 3.0$, displayed in (d,f).
Frequency–wavenumber spectra of the pressure fluctuations in the major-axis plane along the shear layers for the jets issued from (a,d,g) the baseline nozzle, (b,e,h) the single-bevelled nozzle and (c,f,i) the double-bevelled nozzle at  $NPR = (a\unicode{x2013}c)\ 2.3$, (d–f) 3.0 and (g–i) 5.0. The solid lines provide the theoretical dispersion relations of guided-jet wave modes plotted in the same way as in figure 30. The red and blue dashed lines represent the dispersion relations of downstream-convecting structures and upstream-propagating acoustic waves, respectively.

5. Conclusions
High-fidelity large-eddy simulations are performed to analyse the noise control of supersonic rectangular jets with single- and double-bevelled nozzles. The jets are exhausted from a baseline convergent–divergent rectangular nozzle with an aspect ratio of 2.0 at three nozzle pressure ratios ( $NPR = 2.3$, 3.0 and 5.0), which form two over-expanded cold jets and one under-expanded cold jet. The accuracies of the simulations are well validated and show good agreement with the experimental measurements and theoretical predictions. Concluding remarks are summarized as follows.
The noise radiated from the imperfectly expanded rectangular jets issued from the baseline nozzle (without bevel cut) consists of three typical acoustic components, screech tone, BBSAN and TMN, regardless of the  $NPRs$ under scrutiny, although the jet plumes exhibit different oscillating modes. As the
 $NPR$ increases, the oscillation of the jet plume is switched from a symmetrical mode to a flapping mode (preferential in the minor-axis plane), then to a helical mode, together with a reduction of the screech frequency. The amplitude of the screech tone is the strongest in the flapping jet, and the TMN is the most prominent in the helically oscillating jet. The noise source location of the screech tone is changed from the end of the third shock cell to the fourth one when the
 $NPR$ increases from 2.3 to 3.0 (both being isolated sources); whereas for the jet at
 $NPR = 5.0$, a non-compact source is exhibited between the fifth and sixth shock cells. Moreover, no essential difference is observed between the noise emission in the minor- and major-axis planes, but the amplitudes of the screech tones and their harmonics are relatively weaker in the major-axis plane for all cases, and the BBSAN in the major-axis plane is amplified at
 $NPR = 5.0$.
For the single-bevelled nozzle, the asymmetric lips in the minor-axis plane results in asymmetric shock-cell structures and deflected jet shear layers. The mechanism responsible for the plume deflection is related to the local pressure imbalance resulting from the asynchronism of pressure recovery at the nozzle exit. In the two over-expanded jets, the jet shear layers are deflected towards the long lip side, while the deflection of the plume is redirected towards the short lip side in the under-expanded jet. For the double-bevelled nozzle, the shock cells remain symmetric in the two planes, but the lengths of the jet potential cores are shortened. The significant enhancement of shear-layer mixing occurs in the major-axis plane of the over-expanded jets, while it occurs in the minor-axis plane of the under-expanded jet, due to the premature pressure recoveries in the direction of the minor axis. For both the single- and double-bevelled nozzles, the gross thrusts of the baseline nozzle are increased by  $0.05 \sim 7.38$ % under three operating conditions. The thrust performance improvement mainly depends on the increased pressure thrust due to the reduction in shock strengths at the nozzle exits.
Regardless of the  $NPR$, the screech tones are dramatically mitigated or eliminated by the single-bevelled nozzle, resulting in the significantly reduced OASPLs at the upstream emission angels. With the double-bevelled nozzle, the OASPLs at upstream emission angles are effectively reduced in the two principal planes and the major-axis plane for the jets at
 $NPR = 2.3$ and 3.0, respectively, but increased in the minor-axis plane at
 $NPR = 3.0$ and the two principal planes at
 $NPR = 5.0$. The increases in the OASPLs are mainly ascribed to the magnification of the dominant screech tones. At the sideline angles, considerable increases of noise level are evident in the minor-axis plane at
 $NPR = 3.0$, which are related to the amplification of the first harmonics.
The results of cross-correlation analysis show that the hydrodynamic structures convect in the shear layers at the same frequency of the screech tone, coupling with the upstream-propagating acoustic waves. The bevelled nozzles are able to significantly alter the propagation patterns of the shear-layer structures, especially when the screech is amplified or mitigated. The coherent turbulent structures in the rectangular jets with/without the bevel cuts are extracted by the DMD. Well-organized coherent structures are presented in the cases with the generation of screech tones, whereas chaotic and fragmented structures are observed in the cases without the screech tones, suggesting that the regular oscillations of the shear layers play a critical role in the generation of the screech tones. The DMD modes also reveal that the mitigation/elimination of the screech tones with the bevelled nozzles are closely associated with the reorganization/destruction of the most energetic wavepackets in the shear layers. In addition, using the vortex-sheet model proposed by Tam & Norum (Reference Tam and Norum1992), the pressure fluctuations in the two principal planes are spatio-temporally Fourier transformed into frequency–wavenumber space to shed light on the importance of upstream-propagating guided-jet modes, rather than free-stream acoustic waves, in closing the feedback loop. Results confirm that the upstream-propagating guided-jet modes are indispensable in the self-sustained feedback mechanism, accounting for the generation of screech tones in the supersonic rectangular jets.
Acknowledgements
We express our gratitude to the reviewers for their constructive comments and suggestions that helped to clarify a number of questions and improve the quality of the paper.
Funding
The funding support of the National Natural Science Foundation of China (under grant no. 12372221) is acknowledged. This work was partially supported by SJTU Kunpeng&Ascend Center of Excellence.
Declaration of interests
The authors report no conflict of interest.



