





Introduction
Sleep disturbances affect 30–50% of older adults globally, with China’s CHARLS study reporting 38.2% prevalence among those ≥65 years (Grandner, Reference Grandner2017; Jaqua et al., Reference Jaqua, Hanna, Labib, Moore and Matossian2023; Yaremchuk, Reference Yaremchuk2018). These disturbances are linked to adverse outcomes including cognitive decline (HR = 1.34, 1.12–1.59) and cardiovascular risk (OR = 1.47, 1.23–1.76), while incurring 23% higher healthcare costs and significant productivity losses (Cohen et al., Reference Cohen, Eigenberger, Sharkey, Conroy and Wilkins2022; Liao et al., Reference Liao, Liao, Gao, Mu, Wang and Chen2022; Sánchez-de-la-Torre & Barbé, Reference Sánchez-de-la-Torre and Barbé2022). The growing socioeconomic burden underscores the need for early identification of high-risk populations for sleep disturbances to implement cost-effective interventions.
Adverse childhood experiences (ACEs) encompass various forms of abuse (physical, emotional, and sexual), neglect, and household dysfunction (e.g. domestic violence and substance abuse) occurring before age 18 years (Loveday et al., Reference Loveday, Hall, Constable, Paton, Sanci, Goldfeld and Hiscock2022). Epidemiological studies have consistently linked ACEs to increased risks of mental health disorders (depression and anxiety), chronic diseases (cardiovascular disease and diabetes), and premature mortality (Wang et al., Reference Wang, Liu, Yang, Jiang, Ni, Han, Lu and Guo2023; Yu et al., Reference Yu, Patel, Haynie, Vidal-Ribas, Govender, Sundaram and Gilman2022; Zhu et al., Reference Zhu, Shan, Liu, Li, Hou, Huang, Liu, Yi, Sun, Tang, Adeloye, Rudan and Song2022).
Emerging evidence suggests ACEs influence long-term health through three key pathways: (1) HPA axis dysregulation, characterized by prolonged cortisol exposure that impairs glucose metabolism and promotes visceral adiposity; (2) immune dysfunction, with ACE-exposed individuals showing 23% higher C-reactive protein levels (95% CI: 18–28%) and persistent low-grade inflammation; and (3) epigenetic reprogramming of stress-response genes (e.g. FKBP5 methylation changes increasing glucocorticoid receptor sensitivity). These mechanisms may explain the elevated risks of cardiometabolic and psychiatric disorders observed in ACE-affected populations (John-Henderson et al., Reference John-Henderson, Henderson-Matthews, Ollinger, Racine, Gordon, Higgins, Horn, Reevis, Running Wolf, Grant and Rynda-Apple2020; Levy & Muench, Reference Levy and Muench2022; Niwa et al., Reference Niwa, Lockhart, Wood, Yang, Francis-Oliveira, Kin, Ahmed, Wand, Kano, Payne and Sawa2024).
Despite established links between ACEs and physical/mental health, their association with sleep disturbances remains insufficiently characterized. Mechanistically, the same biological pathways implicated in ACE-related diseases are also known to regulate sleep disturbances. For instance, elevated cortisol levels have been shown to reduce REM sleep duration, while proinflammatory cytokines may disrupt slow-wave sleep (Besedovsky, Lange, & Born, Reference Besedovsky, Lange and Born2012; De Nys et al., Reference De Nys, Anderson, Ofosu, Ryde, Connelly and Whittaker2022). These observations suggest that ACEs could predispose individuals to sleep disturbances through similar mechanisms, though population-based evidence remains limited, particularly in aging populations where sleep fragmentation is prevalent.
Despite these plausible biological connections, critical epidemiological evidence remains insufficient. Several studies have attempted to examine this relationship, but the field is constrained by several methodological and demographic limitations (Albers et al., Reference Albers, Grigsby, Benjamin, Rogers, Unger and Forster2022; Cheng et al., Reference Cheng, Dong, Liu, Qu, Xu, Yao and Jin2023; Olsen et al., Reference Olsen, April-Sanders, Bird, Canino, Duarte and Suglia2024; Sheffler, Burchard, & Pickett, Reference Sheffler, Burchard and Pickett2023). First, existing research relies heavily on cross-sectional designs that assess sleep quality at single time points, providing limited insight into the persistence and long-term chronicity of sleep disturbances. Second, geographic representation has been markedly imbalanced, with Asian populations being particularly underrepresented in current studies. Third, there is a notable paucity of research focusing specifically on older adult populations. Investigating this demographic is clinically critical because older adults undergo natural degeneration in sleep architecture, making them highly vulnerable to chronic sleep disturbances. When compounded by the lifelong, cumulative physiological toll of childhood adversity – such as sustained HPA axis dysregulation and chronic low-grade inflammation – older adults may face an amplified risk of severe downstream outcomes, including cognitive decline and cardiometabolic diseases. Understanding this specific relationship is therefore essential for developing targeted geriatric screening and cost-effective public health interventions. Together, these gaps in longitudinal assessment, cultural representation, and age-specific investigation hinder a comprehensive understanding of potential ACE–sleep disturbance associations across diverse populations and developmental stages.
To expand current understanding of ACE–sleep relationships, this study investigates the associations between distinct ACE categories (e.g. abuse, neglect, and household dysfunction) and sleep outcomes in middle-aged and older Chinese adults. Leveraging longitudinal data from the China Health and Retirement Longitudinal Study (CHARLS), a nationally representative cohort, we advance prior research by: (1) employing a prospective cohort design, this study effectively mitigates recall biases regarding the longitudinal progression of sleep outcomes. However, we respectfully acknowledge that the assessment of adverse childhood experiences inherently relies on retrospective memory, meaning that recall bias for the ACEs component cannot be entirely avoided; (2) differentiating between ACE subtypes to identify potential dose–response or subtype-specific effects; and (3) focusing on an understudied demographic (Asian aging populations) to complement predominantly Western evidence.
This study elucidates the effects of ACEs on Chronic Sleep Disturbances in Chinese older adults, providing scientific evidence for identifying high-risk populations. The findings may offer valuable insights for public health policymakers to develop targeted interventions to improve sleep health among elderly individuals with a history of ACEs.
Method
Study design and population
The study utilizes data from the CHARLS database, a nationally representative survey tracking Chinese residents aged ≥45 years. The baseline survey (Wave 1, 2011–2012) was followed by four subsequent waves (2013, 2015, 2018, and 2020). A supplementary Life History Survey in 2014 collected retrospective data on childhood experiences and life course events. All CHARLS data are publicly available through its official website. To establish our analytical cohort, we utilized participants from the 2014 Life History Survey and successfully matched them with their corresponding baseline data collected during Wave 1 (2011–2012) to extract essential covariates.
The baseline survey employed a multistage stratified probability-proportional-to-size (PPS) random sampling strategy. During this baseline phase, data were rigorously collected via face-to-face interviews by trained interviewers using structured questionnaires. These questionnaires captured comprehensive socio-demographic characteristics (e.g. gender, age, education level, and residence), lifestyle behaviors (e.g. smoking and drinking history), and past medical history of chronic diseases. Concurrently, standardized physical examinations were performed by the trained staff to objectively measure physical parameters, including height, weight, and blood pressure, to prevent respondents from providing arbitrary answers or omitting data due to misunderstandings.
The study included 20,450 participants from the 2014 Life History Survey. After excluding 11,006 participants with missing ACE data (retaining 9,444), we further removed 3,767 individuals due to loss to follow-up or missing sleep data across the survey waves, and an additional 12 individuals who were aged <45 years. Crucially, to minimize the confounding effects of severe underlying pathologies on sleep, we further excluded 132 participants who reported a history of psychiatric illnesses (emotional or nervous problems, n = 72) or memory-related neurological diseases (n = 60). The final cohort (n = 5,533) was stratified by ACE count (Lu et al., Reference Lu, Huang, Yu, Li, Wen and Zhao2024): Class 1 (0 ACEs, n = 1,382), Class 2 (1 ACE, n = 1,769), Class 3 (2 ACEs, n = 1,264), and Class 4 (≥3 ACEs, n = 1,118). Flowchart of the study population was shown in Figure 1.
Flowchart of the study population.

Figure 1. Long description
The flowchart follows a vertical progression from the top down.
* At the top, a box indicates a total of 20450 participants took the Life History Questionnaire in 2014.
* An arrow points down to a second box, with a dashed box to the right stating: Exclude participants with missing values on A C Es. The second box shows a total of 9444 participants for analyses.
* An arrow points down to a third box, with a large dashed box to the right listing four exclusion criteria: 1. Exclude participants without information of sleep in any waves, 2. Exclude participants with loss of visit, 3. Exclude participants aged less than 45, and 4. Exclude participants with psychiatric illnesses or memory-related neurological diseases. The third box shows a total of 5533 participants for analyses.
* From the bottom of the third box, a horizontal line branches into four final boxes at the base:
* Class 1: 1382
* Class 2: 1769
* Class 3: 1264
* Class 4: 1118
Data collection on chronic sleep disturbances
While the formal clinical diagnosis of sleep disorders requires comprehensive criteria including daytime impairment and objective polysomnography (First, Reference First2013; Robbins & Quan, Reference Robbins and Quan2024), large-scale epidemiological studies commonly assess chronic sleep disturbances using standardized survey items.
In this study, chronic sleep disturbances were defined based on two key criteria derived from standardized epidemiological survey items. Specifically, the sleep quality metric was drawn from the sleep-specific item within the Center for Epidemiologic Studies Depression Scale (CES-D), a tool extensively validated within the CHARLS cohort (Chen et al., Reference Chen, Guo, Xu, Liu, Barry and Wu2021). The criteria included: (1) participants reporting restless sleep for ≥3 days per week (corresponding to responses of ‘Occasionally or a moderate amount of the time (3–4 days)’ or ‘Most or all of the time (5–7 days)’ to the item ‘My sleep was restless’), combined with (2) an average nightly sleep duration of <6 hours or >9 hours (assessed via the question ‘During the past month, how many hours of actual sleep did you get at night?’).
To establish chronicity, participants had to meet both criteria in two consecutive survey waves, ensuring persistence to corroborate duration ≥3 months.
Data collection on ACEs
The 2014 CHARLS Life History Survey assessed ACEs using dichotomous/multiple-choice questions (Lu et al., Reference Lu, Huang, Yu, Li, Wen and Zhao2024). Twelve indicators (covering 17 childhood items; see Supplementary Table S1) before age 18 years were evaluated, including physical abuse, emotional neglect, household substance abuse, mental illness, domestic violence, incarcerated family members, parental separation/divorce, unsafe neighborhoods, bullying, parental or sibling death, and parental disability.
Specifically, each type of ACE corresponds to particular items within the life history questionnaire, with certain ACE categories encompassing multiple related questions. Supplementary Table S1 provides a detailed breakdown of these questionnaire items, alongside the specific answer thresholds used to define the occurrence of an ACE. When a participant’s responses met the predefined criteria for a given ACE category, it was recorded as experiencing one ACE. The total number of experienced ACEs was then summed for each individual. Based on this cumulative count, participants were assigned to four classes to evaluate dose–response relationships: Class 1 (0 ACEs), Class 2 (1 ACE), Class 3 (2 ACEs), and Class 4 (≥3 ACEs).
Data collection and ascertainment of covariates: Demographic covariates
Demographic and health-related data – such as age, gender, marital status, residence, education level, chronic disease history, smoking and drinking status, blood pressure (SBP/DBP), and BMI – were obtained from the baseline questionnaire in Wave 1.
Physical parameters were objectively measured by trained staff. BMI was calculated from standardized height and weight measurements, while blood pressure (SBP/DBP) was recorded as the average of three consecutive readings using an Omron HEM-7200 sphygmomanometer.
Statistical analysis
Data analysis was performed using SPSS (27.0), STATA/SE 16.0, and R version 4.3.0, with statistical significance set at P < 0.05. Continuous variables were presented as mean ± standard deviation (SD), while categorical variables were summarized as frequencies. Missing values were addressed via multiple imputation, with details provided in Supplementary Table S2 (Supplementary Material).
Group comparisons were conducted using ANOVA or t-tests for continuous variables and chi-square or Fisher’s exact tests for categorical variables. To examine the associations between ACEs and Chronic Sleep Disturbances, we employed univariate and multivariate logistic regression. Additionally, multivariate logistic regression was used to assess the impact of specific ACE types on Chronic Sleep Disturbances risk.
Subgroup analyses were stratified by: age (median cutoff), sex, residence information, education level, BMI (median cutoff), systolic blood pressure (median cutoff), and diastolic blood pressure (median cutoff). Interaction effects were evaluated using the Wald test (implemented in the R Programming Language).
Results
Baseline characteristics of participants
The study included 5,533 participants divided into four classes, presented in Table 1. The prevalence of Chronic Sleep Disturbances increased significantly across the classes (χ 2 = 48.88, P < 0.001), from 15.27% in Class 1 to 26.21% in Class 4. Significant differences were also observed in age, gender distribution, education level, and lifestyle factors such as drinking status (all P < 0.05).
Baseline characteristics of participants

Table 1. Long description
The table consists of 8 columns: Variables, Total (n = 5,664), Class 1 (n = 1,408), Class 2 (n = 1,803), Class 3 (n = 1,294), Class 4 (n = 1,159), Statistic, and P-value.
Key data points include:
* Chronic sleep disorders: Total 1,119 (19.76%), increasing from Class 1 (15.34%) to Class 4 (26.57%), P < .001.
* Age: Median is 63.00 across most groups, P = 0.013.
* Gender: Total 52.75% Male and 47.25% Female, P < .001.
* B M I: Total mean 110.01 plus or minus 4249.28, P = 0.489.
* S B P: Total mean 127.78 plus or minus 19.13, P = 0.296.
* D B P: Total mean 75.82 plus or minus 11.70, P = 0.034.
* Residence: 30.67% Urban and 69.33% Rural, P = 0.312.
* Marriage status: 14.05% Out of marriage and 85.95% In marriage, P = 0.970.
* Education: 58.83% Primary school or lower and 41.17% Secondary school or higher, P < .001.
* Drinking status: 62.02% No and 37.98% Yes, P = 0.006.
* Smoking status: 53.94% No and 46.06% Yes, P = 0.121.
* History of chronic diseases (P-values): Hypertension (0.375), Dyslipidemia (0.557), Diabetes or H B S (0.308), Chronic lung diseases (<.001), Liver disease (0.324), Stroke (0.008), Kidney disease (0.004), and Stomach disease (0.096).
Note: SBP, systolic blood pressure; DBP, diastolic blood pressure; BMI, body mass index. Continuous variables were expressed as mean ± standard deviation (SD) in case of normal distribution, otherwise were expressed as M: median (Q₁: first quartile, Q₃: third quartile) in case of unnormal distribution. Categorical variables were presented as counts (percentages). Continuous variables were compared between two groups by ANOVA test. If the count variable had a theoretical number <10, Fisher’s exact probability test was used. Categorical variables were compared by chi-square test. The significance of bold values are indicated statistical significance (P <0.05).
Regarding baseline health status, the distribution of certain covariates varied significantly across the four ACE groups. Specifically, differences were observed in the baseline prevalence of chronic lung diseases and kidney disease. These baseline imbalances necessitated their inclusion as adjusting covariates in the subsequent multivariable models. Conversely, no significant baseline differences were observed for BMI, blood pressure, residence, or other conditions such as hypertension, dyslipidemia, and liver disease.
Associations between ACEs and chronic sleep disturbances incidence in different classes
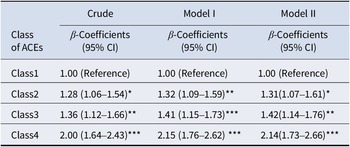
Our analysis revealed a significant graded association between ACEs exposure and chronic sleep disturbances risk across three progressively adjusted models presented in Table 2. In the crude model, compared to Class 1 (reference), Class 2 showed a 26% increased risk (OR = 1.26, 95% CI: 1.05–1.53, P = 0.010), Class 3 demonstrated a 34% higher risk (OR = 1.34, 95% CI: 1.10–1.64, P = 0.003), and Class 4 exhibited the strongest association with a 97% elevated risk (OR = 1.97, 95% CI: 1.62–2.40, P < 0.001). These associations remained significant after adjusting for age and gender in Model I (Class 2: OR = 1.30, P = 0.004; Class 3: OR = 1.39, P = 0.002; Class 4: OR = 2.15, P < 0.001) and further adjustment for sociodemographic and health-related factors in Model II (Class 2: OR = 1.30, P = 0.009; Class 3: OR = 1.39, P = 0.003; Class 4: OR = 2.10, P < 0.001).
Odds ratios for incident chronic sleep disorders in a different logistic regression model

Table 2. Long description
The table consists of four columns: Class of A C Es, Crude beta-Coefficients with 95 percent C I, Model I beta-Coefficients with 95 percent C I, and Model II beta-Coefficients with 95 percent C I.
* Class 1: Serves as the Reference group with a value of 1.00 across all three models.
* Class 2: Crude is 1.28 (1.06–1.54); Model I is 1.32 (1.09–1.59); Model II is 1.31 (1.07–1.61).
* Class 3: Crude is 1.36 (1.12–1.66); Model I is 1.41 (1.15–1.73); Model II is 1.42 (1.14–1.76).
* Class 4: Crude is 2.00 (1.64–2.43); Model I is 2.15 (1.76–2.62); Model II is 2.14 (1.73–2.66).
Statistical significance is indicated by asterisks where P is less than 0.05, 0.01, or 0.001. Model I is adjusted for age and gender. Model II is adjusted for age, gender, education, marriage status, residence, smoking status, drinking status, systolic blood pressure, diastolic blood pressure, and B M I.
Model I, adjusted for age and gender.
Model II, adjusted for age, gender, education, marriage status, residence, smoking status, drinking status, systolic blood pressure, diastolic blood pressure, and body mass index.
*P < 0.05, **P < 0.01, ***P < 0.001.
Associations between different types of ACEs and chronic sleep disturbances incidence
The analysis of individual ACE types revealed differential associations with chronic sleep disturbances incidence shown in Figure 2. Seven ACE types showed statistically significant associations: unsafe neighborhood (OR = 1.46, 95% CI: 1.15–1.84, P = 0.002), household mental illness (OR = 1.77, 95% CI: 1.53–2.06, P < 0.001), parental disability (OR = 1.41, 95% CI: 1.18–1.68, P < 0.001), domestic violence (OR = 1.28, 95% CI: 1.03–1.61, P = 0.029), and bullying (OR = 1.46, 95% CI: 1.23–1.73, P < 0.001) were associated with elevated risk. In contrast, parental separation/divorce, incarcerated household members, physical abuse, emotional neglect, household substance abuse, and sibling death showed no significant associations (all P > 0.05).
Association between different ACE indicator items and chronic sleep disturbances in a logistic regression model adjusted for sex and age. Note: OR, ‘odds ratio’; CI, ‘confidence interval’.

Figure 2. Long description
The forest plot consists of a table with columns for Variables, O R (95% C I), a visual plot, and P values. A vertical reference line is set at O R 1.00. Each variable compares a ‘No’ reference group (O R 1.00) to a ‘Yes’ group.
* Parental separation or divorce: O R 0.75 (0.26 to 2.18), P 0.598.
* Unsafe neighborhood: O R 1.46 (1.15 to 1.84), P 0.002.
* Incarcerated household member: O R 1.66 (0.64 to 4.28), P 0.297.
* Household mental illness: O R 1.77 (1.53 to 2.06), P less than .001.
* Parental disability: O R 1.41 (1.18 to 1.68), P less than .001.
* Physical abuse: O R 1.02 (0.88 to 1.18), P 0.758.
* Emotional Neglect: O R 1.11 (0.96 to 1.28), P 0.155.
* Domestic violence: O R 1.28 (1.03 to 1.61), P 0.029.
* Bullying: O R 1.46 (1.23 to 1.73), P less than .001.
* Household substance abuse: O R 2.08 (0.97 to 4.45), P 0.060.
* Sibling death: O R 0.93 (0.69 to 1.25), P 0.621.
* Parental death: O R 1.21 (1.01 to 1.45), P 0.044.
Significant positive associations (where the C I does not cross 1.00) are seen for unsafe neighborhood, household mental illness, parental disability, domestic violence, bullying, and parental death.
Subgroup analyses
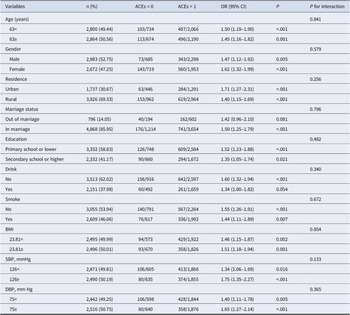
Subgroup analyses detailed in Table 3 revealed consistent positive associations between ACE exposure (≥1) and an increased risk of chronic sleep disturbances across most population strata, with no statistically significant interactions found for any of the subgroup variables (all P for interaction >0.05). The risk elevation was statistically significant in the majority of subgroups (OR range: 1.27–1.81, P < 0.05), with slightly more pronounced effect sizes observed among men (OR = 1.81 vs. women = 1.27), urban residents (OR = 1.47 vs. rural = 1.28), and individuals with elevated diastolic blood pressure (OR = 1.51 vs. normal = 1.34). Conversely, the associations did not reach statistical significance among rural residents (P = 0.074) and unmarried participants (P = 0.068).
Subgroup analysis of the associations between number of ACEs and chronic sleep disorders

Table 3. Long description
The table contains seven columns: Variables, n (percentage), A C E s equals 0, A C E s greater than 1, O R (95 percent C I), P, and P for interaction.
Key findings by variable group:
* Age (years): For those under 63, O R is 1.50. For those 63 and older, O R is 1.45. P for interaction is 0.841.
* Gender: Males show an O R of 1.47 (P equals 0.005) and females show an O R of 1.62 (P less than 0.001). P for interaction is 0.579.
* Residence: Urban residents have a higher O R of 1.71 compared to rural residents at 1.40. P for interaction is 0.256.
* Marriage status: Those in marriage show a significant association (O R 1.50, P less than 0.001), while those out of marriage do not (O R 1.42, P equals 0.081).
* Education: Primary school or lower (O R 1.52) and secondary school or higher (O R 1.35) both show significant associations.
* Lifestyle: Non-drinkers (O R 1.60) and non-smokers (O R 1.55) show significant associations with sleep disorders when A C E s are present.
* Health Metrics: B M I, S B P, and D B P subgroups all show significant O R values ranging from 1.34 to 1.75, with no significant interaction effects (all P for interaction greater than 0.05).
Initialisms used: A C E s (Adverse Childhood Experiences), O R (Odds Ratio), C I (Confidence Interval), B M I (Body Mass Index), S B P (Systolic Blood Pressure), D B P (Diastolic Blood Pressure).
Note: SBP, systolic blood pressure; DBP, diastolic blood pressure; BMI, body mass index; OR, odds ratio, CI, confidence interval.
Discussion
A growing body of evidence has established ACEs as significant predictors of various diseases and public health challenges (Dube, Reference Dube2024; Lin et al., Reference Lin, Wang, Lu, Chen and Guo2021). The present study extends this understanding by focusing on the understudied relationship between ACEs and Chronic Sleep Disturbances among Chinese older adults. Leveraging the CHARLS database, we systematically extracted and analyzed ACEs-related data from life history questionnaires to construct a well-characterized ACEs cohort, then linked these exposures to sleep outcomes. Our findings robustly demonstrate a dose–response relationship between ACEs exposure and sleep disturbance risk, with individuals in the highest ACEs class (Class 4) facing over twice the risk compared to those with minimal exposure (Class 1). To our knowledge, this is the first large-scale study to investigate the association between ACEs and sleep disturbances in a Chinese population, providing unique insights into the long-term impact of childhood adversity on sleep health in aging adults.
The analysis of Table 1 reveals distinct population characteristics across ACEs exposure groups. Notably, Chronic Sleep Disturbances showed a stepwise increase with higher ACEs frequency (15.27–26.21%). Other variables, including gender, education, and certain chronic diseases, also demonstrated significant differences (P < 0.05), warranting further investigation in future studies.
Further, logistic regression revealed a graded association between ACEs and Chronic Sleep Disturbances in Table 2. In the unadjusted model, higher ACE classes showed increased risk (Class 2: OR = 1.26; Class 3: OR = 1.34; Class 4: OR = 1.97; all P < 0.05). Adjusting for sex (hormonal influences) and age, as shown in Model I, yielded similar results (Class 4: OR = 2.15, P < 0.001). The association persisted in Model II after full adjustment for sociodemographic and health-related covariates (Class 4: OR = 2.10, P < 0.001), demonstrating robustness. The persistence of these significant associations across all models suggests a robust dose–response relationship between childhood adversity exposure and subsequent chronic sleep disturbances development.
The observed dose-dependent association (up to twofold increased risk) strongly suggests ACEs represent an independent risk factor for Chronic Sleep Disturbances. This relationship may be mediated through two interconnected pathways: (1) psychological sequelae – chronic stress from ACEs may lead to persistent hypervigilance and maladaptive coping mechanisms that disrupt sleep architecture; and (2) neuroendocrine dysregulation – particularly HPA axis hyperactivity, evidenced by elevated cortisol levels in ACEs-exposed individuals, which may alter circadian rhythms and sleep–wake regulation. The combination of these psychological and physiological disturbances likely creates a vicious cycle perpetuating sleep dysfunction into adulthood (Charles et al., Reference Charles, Mnatsakanova, Fekedulegn, Violanti, Gu and Andrew2022).
Our analysis identified multiple ACEs significantly associated with Chronic Sleep Disturbances, including household mental illness (OR = 1.77, 95% CI: 1.53–2.06), unsafe neighborhood (OR = 1.46, 1.15–1.84), parental disability (OR = 1.41, 1.18–1.68), bullying (OR = 1.46, 1.23–1.73), and domestic violence (OR = 1.28, 1.03–1.61). These findings suggest that chronic stressors – particularly those involving family dysfunction (mental illness and domestic violence), environmental instability (unsafe neighborhood), and interpersonal trauma (bullying) – may disrupt sleep through sustained activation of stress pathways. The strongest association with household mental illness aligns with evidence linking prolonged exposure to chaotic caregiving environments to dysregulated hypothalamic–pituitary–adrenal (HPA) axis function, while bullying’s impact may reflect long-term alterations in emotional regulation. Notably, parental disability – a less studied ACE – showed a robust effect, possibly due to caregiver stress or economic strain. The absence of significant associations for discrete events (e.g. parental death and separation) underscores the potential primacy of chronic, interpersonal adversities in sleep pathophysiology. Future research should explore mechanistic differences across ACE subtypes.
Subgroup analysis demonstrated consistent associations between ACEs and Chronic Sleep Disturbances across all demographic strata (all ORs >1.3, P < 0.05), with no significant interaction effects (all P-interaction >0.05). The robustness of these associations suggests that the detrimental impact of ACEs on sleep health persists regardless of age, gender, residence, or socioeconomic status.
This study has several limitations inherent to its observational design. First, retrospective reporting of ACEs may introduce recall bias, though we minimized this through standardized questionnaires and trained interviewers. Second, while we adjusted for key confounders, residual confounding from unmeasured factors (e.g. genetic influences) remains possible. Third, sleep disturbances were assessed via validated epidemiological survey items (derived from the CES-D-10 and self-reported duration) rather than formal clinical diagnosis. Although this is a standard and widely used methodological approach in CHARLS-related epidemiological research, and we rigorously excluded participants with known psychiatric and memory-related neurological diseases to minimize pathological confounding, self-reported symptom assessment inherently lacks the diagnostic precision of objective clinical tools like polysomnography. Fourth, the exclusion of participants with missing data could affect generalizability, though sensitivity analyses showed robust results. Finally, while CHARLS covers 28 provinces, its sampling framework may not fully represent all subpopulations, despite our adjustment for urban/rural residence. These limitations reflect common challenges in ACEs research, and we employed multiple methodological safeguards to enhance validity. Future studies incorporating longitudinal designs and objective sleep measures would further strengthen causal inference.
This study provides novel insights into the association between ACEs and Chronic Sleep Disturbances in a large, nationally representative Chinese population, addressing an important research gap in non-Western settings. Our findings demonstrate that specific ACEs – particularly household mental illness, bullying, and domestic violence – significantly increase the risk of sleep disturbances, with robust associations across demographic subgroups. These results highlight the potential for integrating ACE screening into public health strategies for sleep disturbances, enabling more targeted prevention and early intervention for high-risk individuals. However, further research is needed to elucidate the biological mechanisms linking ACEs to sleep dysregulation and to validate these findings in broader populations.
Abbreviations
- ACEs
-
adverse childhood experiences
- BMI
-
body mass index
- CHARLS
-
China Health and Retirement Longitudinal Study
- DBP
-
diastolic blood pressure
- OR
-
odds ratio
- SBP
-
systolic blood pressure
Supplementary material
The supplementary material for this article can be found at http://doi.org/10.1017/S0033291726106059.
Data availability statement
The raw data of this study can be accessed by contacting the corresponding author’s email address – zhaodizhou@mzxy4.wecom.work.
Acknowledgements
The authors would like to thank the China Health and Retirement Longitudinal Study team for providing data and training in using the datasets.
Author contribution
Hong Lu made major contributions to writing the manuscript and analyzing the patient data. Yi Wen made major contributions to interpreting the results and writing the manuscript. Hegao Yu made major contributions to preparing the tables. Chujun Wu made major contributions to preparing the Figures. Dizhou Zhao provided writing inspiration and quality control. All authors reviewed the manuscript.
Funding statement
Self-finance.
Competing interests
The authors declare no competing interests.
Ethics standards
Ethical approval for data collection was granted by the Biomedical Ethics Review Board of Peking University (IRB00001052-11015), with all participants providing informed consent by signing a consent form.





 Open access

