INTRODUCTION
Temperature and precipitation are the two major climatic factors that determine crop yields. Finland is a northern European high-latitude country where interannual fluctuation and regional variation in conditions are marked (Tuomenvirta Reference Tuomenvirta2004; Peltonen-Sainio et al. Reference Peltonen-Sainio, Jauhiainen and Hakala2009a). In addition to this, the climate is changing. Global surface temperatures have risen by, on average, 0·76°C during the last 100 years and the warming has accelerated in recent decades: 1995–2006 was the warmest period ever recorded (IPCC Reference Solomon, Qin, Manning, Chen, Marquis, Averyt, Tignor and Miller2007). In the north, temperatures have risen similarly, spring temperatures showing the largest and statistically most significant increase (Tuomenvirta Reference Tuomenvirta2004). Climate warming has already become manifested globally and in Europe has resulted in a decrease in the number of frost days and an increase in the number of warm summer days (temperatures >25°C), a decrease in the occurrence of cold nights and an increase in warm nights (Klein Tank & Können Reference Klein Tank and Können2003; Alexander et al. Reference Alexander, Zhang, Peterson, Caesar, Gleason, Klein Tank, Haylock, Collins, Trewin, Rahimzadeh, Tagipour, Rupa Kumar, Revadekar, Griffiths, Vincent, Stephenson, Burn, Aguilar, Brunet, Taylor, New, Zhai, Rusticucci and Vazquez-Aguirre2006). The world has generally become wetter over large areas, including northern Europe and eastern parts of the Americas, with extreme rain events significantly contributing to the increase in precipitation (Klein Tank & Können Reference Klein Tank and Können2003; Alexander et al. Reference Alexander, Zhang, Peterson, Caesar, Gleason, Klein Tank, Haylock, Collins, Trewin, Rahimzadeh, Tagipour, Rupa Kumar, Revadekar, Griffiths, Vincent, Stephenson, Burn, Aguilar, Brunet, Taylor, New, Zhai, Rusticucci and Vazquez-Aguirre2006; IPCC Reference Solomon, Qin, Manning, Chen, Marquis, Averyt, Tignor and Miller2007). On the other hand, a reduction in precipitation has been recorded in other regions such as the Mediterranean, southern Africa and southern Asia. In Finland, the growing season has become warmer and longer (Kaukoranta & Hakala Reference Kaukoranta and Hakala2008), but contrary to the general observations in northern Europe, precipitation has not increased (Klein Tank et al. Reference Klein Tank, Wijngaard, Können, Böhm, Demarée, Gocheva, Mileta, Pashiardis, Hejkrlik, Kern-Hansen, Heino, Bessemoulin, Müller-Westermeier, Tzanakou, Szalai, Pálsdóttir, Fitzgerald, Rubin, Capaldo, Maugeri, Leitass, Bukantis, Aberfeld, Van Engelen, Forland, Mietus, Coelho, Mares, Razuvaev, Nieplova, Cegnar, López, Dahlström, Moberg, Kirchhofer, Ceylan, Pachaliuk, Alexander and Petrovic2002).
As the last few decades have been exceptionally warm in Finland (Tuomenvirta Reference Tuomenvirta2004), the temperature regimes during many of the growing seasons have been comparable to those predicted for the near future decades (2010–39). In order to get a picture of what the effects of elevated temperatures per se may be in northern European long-day conditions, this study examined how crops have responded to warmer growing seasons through changes in their growth, determination of yield and formation of quality. The studies were carried out on spring and winter wheat (Triticum aestivum L.), oats (Avena sativa L.), barley (Hordeum vulgare L.), winter rye (Secale cereale L.), pea (Pisum sativum L.) and rapeseed (turnip rape, Brassica rapa L. and oilseed rape, B. napus L.). Temperature conditions are associated with water availability; therefore, crop responses to precipitation detectable in long-term data sets were also studied.
MATERIALS AND METHODS
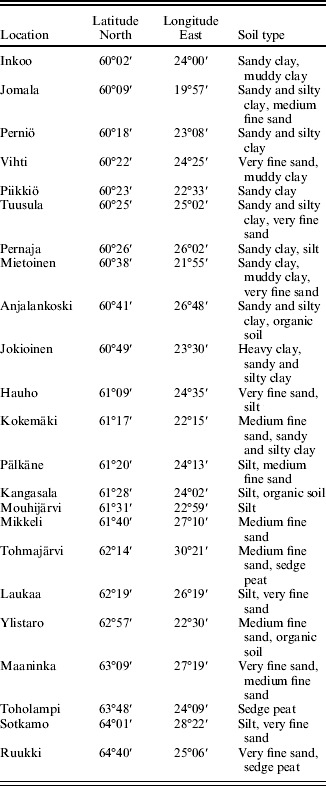
Long-term field experiments were conducted by Agrifood Research Finland (MTT) for cereals and pea in 1970–2007 and for rapeseed in 1976–2007 at various locations in Finland, depending on crop and production area (Table 1). The experiments were part of the MTT Official Variety Trials and all followed procedures specified for that purpose (Kangas et al. Reference Kangas, Laine, Niskanen, Salo, Vuorinen, Jauhiainen and Nikander2005). In addition to MTT Agrifood Research Finland, which has numerous regional research units in Finland, some of the experiments were organized by plant breeding companies and private agricultural research stations.
Locations for long-term experiments, their latitude, longitude and typical soil types

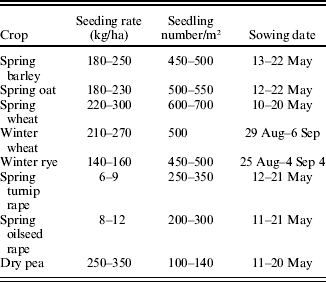
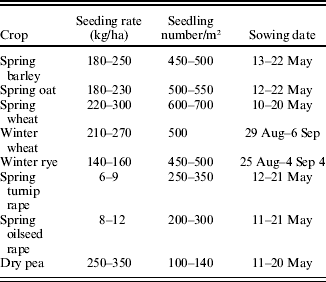
All experiments were arranged as randomized complete block designs or incomplete block designs. Three to four replicates were used. Each year the tested set of cultivars and breeding lines changed, but long-term control cultivars were used. The annual turnover of cultivars and breeding lines was usually less than 0·20, which made it possible to separate the effects of the environment and genotype. Plots were 7–10 m×1·25 m, depending on location and year. Seeding rate depended on crop, conforming to the commonly used seeding rates in Finland (Table 2). Weeds were chemically controlled with agents commonly used at each time period. Diseases were not routinely controlled with fungicides in order to allow differences among entries in disease resistance to be recorded. Fertilizer use depended on cropping history, soil type and fertility and was comparable with standard practices in Finland.
Typical ranges for seeding rates (kg/ha and number of seedlings targeted per square metre) and sowing dates for long-term experiments
Growth duration from sowing (BBCH00, Lancashire et al. Reference Lancashire, Bleiholder, Van Den Boom, Langeluddeke, Strauss, Weber and Witzenberger1991) to heading (BBCH55–57) or onset of flowering (BBCH60–61) (d) and from heading/onset of flowering to ripeness (BBCH87–89) (d) was monitored and the ratios of pre- to post-heading durations were calculated. In addition, the duration of flowering (d) from the onset to the end of flowering (BBCH67–69) was monitored in rapeseed. Plant height (m) was measured close to maturity as a mean of three measurements per plot (one from the beginning, one from the middle and one from the end of the plot). Lodging was measured close to harvest as the average proportion of the crop stand which was lodged (1·00 corresponding with total lodging). Cereals, rapeseed and pea were combine harvested and the yield weighed (t/ha) after removing straw, weed seeds and other particles. Grain or seed moisture content was determined by weighing seed samples before and after oven drying, or more recently by using a Dickey John apparatus. Seed yield was adjusted to 150, 90 and 150 g moisture/kg dry matter (DM) in cereals, rapeseed and pea, respectively. For cereals, single grain weight (mg/grain) was measured from five samples of 100 grains, disregarding the lowest and highest values from the mean. Numbers of grains/m2 were estimated by dividing grain yield/m2 by single grain weight. Grain protein content was analysed using the Kjeldahl method. Similar yield component and quality measurements were also carried out in pea and rapeseed. In rapeseed, the oil content was also determined with heptane–alcohol extraction and converted to dry matter and seed chlorophyll content (mg/kg) with spectrophotometry.
Before statistical analysis was undertaken, experiments were classified into two groups. The classification was based on the following sums of squares which were calculated for all experiments:
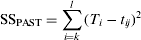
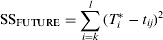
where t ij is the average temperature in the ith month in the jth year. Months included in equations depended on species: k=May for all species, l=August (cereals and pea) or September (rapeseed). T i is the mean of t ij during the period 1970–2000. T i* is predicted temperature for 2010–39 according to the consensus of 19 climatic models in SRES scenario A2 (IPCC Reference Nakicenovic and Swart2000). If SSPAST was smaller than SSFUTURE, the experiment represented the 1971–2000 seasons, otherwise it represented 2010–39. These periods are referred to in this paper as ‘1985’ and ‘2025’. Only a limited number of experiments had mean temperatures during their growth period high enough to be comparable with those estimated for 2040–69 (‘2055’), and hence, only ‘2025’ was included.
If all experiments at one site were classified as 1971–2000 or 2010–39, the site was not included in the statistical analysis. This occurred when the site had only a few experiments. After classification, all studied traits were analysed using the following statistical model:

where μ is the intercept, sitem, periodn and site×periodmn are the fixed effects of the mth experimental site, nth period (n=1971–2000 or 2010–39 depending on values of SSPAST and SSFUTURE), and their interaction, respectively. The set of cultivars varied between experiments and this variation was excluded by including the effect of cultivar in the model (cultivaro). Finally, experimentp and ε mnop are the random effects of experiment and unexplained variation (residual). Statistical analyses were performed using the SAS software (version 9.1, SAS 2004) and the MIXED procedure (REML estimation method).
Yield response to climatic parameters was tested using a simple regression model. Before regression, genetic variation was excluded using a two-way analysis of variance model that included the effect of cultivar and the effect of experiment. The growing season from sowing to yellow ripening was divided into four phases of equal accumulated temperatures (mean temperature >5°C). Precipitation, daily mean temperature and length of the phase (d) were calculated and these values were used as independent variables in the regression analyses. These analyses were performed using the SAS software (version 9.1) and the MIXED and REG procedures.
Because cereals responded positively to increases in precipitation during the early growth phases, the typical regional distribution and adequacy of rains were studied further, according to a predictive model developed for two-row barley under northern growing conditions (Peltonen-Sainio et al. Reference Peltonen-Sainio, Rajala and Kontturi2003, Reference Peltonen-Sainio, Kontturi, Rajala and Tuuri2005). The most critical period for yield determination in the model was 215–465°Cd from sowing. The 30-year mean precipitation for that particular period (but also from sowing to 215°Cd and during the harvest period, i.e. in August) was calculated for each rural district in Finland according to data provided by the Finnish Meteorological Institute. The estimated yield losses following inadequate precipitation were further estimated using the model.
RESULTS
Crop responses to warmer growing seasons
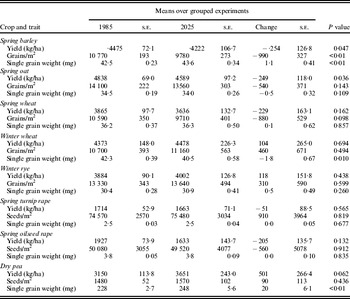
When comparing the mean yields in experiments with elevated temperatures to those having temperatures typical for ‘1985’, it was noted that yields of spring cereals and spring rapeseed tended to decrease in the warmer conditions. The decrease was c. 250 kg/ha (5–6%) for spring cereals and from 50 kg/ha (turnip rape) to 200 kg/ha (oilseed rape) for rapeseed (3–15%, respectively). The decrease was significant for barley (P=0·047) and oat (P=0·036, Table 3). For winter cereals and dry pea, the yields tended to increase at elevated temperatures, but the increase was significant (P=0·062) only for dry pea (500 kg/ha, corresponding to 16%). A significant yield decrease was achieved by a significant decrease in the number of grains or seeds/m2, while single grain weight was affected only slightly. However, the increase in yield of dry pea was accompanied by a significant increase (9%, P<0·01) in seed weight (Table 3).
Yield and yield components of principal field crops in MTT Official Variety Trial experiments grouped according to typical temperature conditions for the past three decades 1970–2000 (shown as ‘1985’) and typical conditions estimated for 2010–39 (shown as ‘2025’), according to SRES scenario A2 of IPCC. Temperature data from the Finnish Meteorological Institute

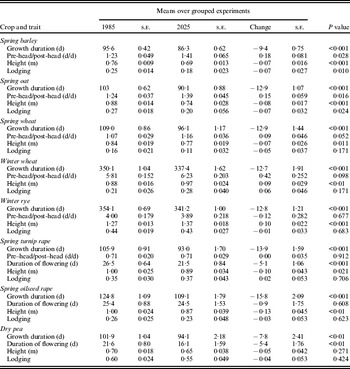
In all crops studied, growth duration in elevated temperatures was shortened compared to the typical temperature regime for ‘1985’, from 8 to 16 days depending on crop (Table 4). In all cereals except for winter rye, the ratio between pre- and post-heading phase was significantly (P=0·016–0·098) altered. In spring cereals, the ratio increased in elevated temperatures in favour of the pre-heading phase by 0·09–0·18 unit and in winter wheat by 0·42 unit (especially the long period prior to heading). In turnip rape, no changes in ratio of pre- and post-flowering period were recorded, although the duration of flowering was shortened in the warmer seasons. Similar responses were found for pea. All spring-sown crops were shorter under elevated temperatures than under typical ‘1985’ temperature conditions, although the reduction was not significant for pea. In parallel, lodging was reduced significantly in barley and oat. In contrast to spring-sown crops, higher temperature conditions resulted in significantly increased height (by almost 0·1 m) in winter wheat and rye, but without affecting lodging (Table 4).
Growth response of principal field crops in MTT Official Variety Trial experiments grouped according to typical temperature conditions for the past three decades 1970–2000 (shown as ‘1985’) and typical conditions estimated for 2010–39 (shown as ‘2025’), according to SRES scenario A2 of IPCC. Temperature data from the Finnish Meteorological Institute

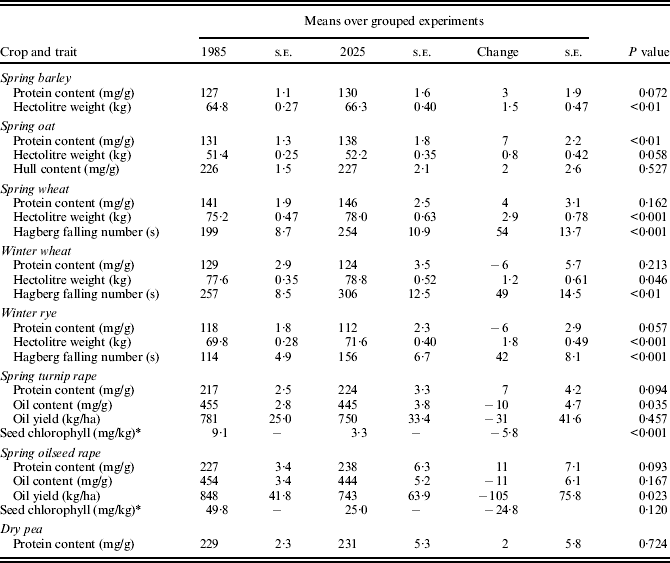
Regarding quality traits other than grain size, grain protein content tended to be slightly higher under elevated growing season temperatures for all spring-sown crops: the change was significant in barley and oat (Table 5). In winter cereals, the tendency was the opposite of that for spring-sown crops but significant only for rye. Hectolitre weight of cereals was significantly higher in the warmer seasons, the increase ranging from 0·8 to 1·8 kg/hl. The hull content of oat was not affected by seasonal temperature conditions. In both turnip rape and oilseed rape, the seed oil content declined due to elevated temperatures by 1%, the decline being significant (P=0·035) only for turnip rape. The oil yield/ha decreased significantly, by more than 100 kg/ha in oilseed rape. On the other hand, for turnip rape seed chlorophyll content declined significantly under warm conditions (P<0·001). There was also a large, though not significant, decrease in chlorophyll content in oilseed rape, but because of the high initial value the final content was still extremely high (25 mg/kg) (Table 5).
Quality response of principal field crops in MTT Official Variety Trial experiments grouped according to typical temperature conditions for the past three decades 1970–2000 (shown as ‘1985’) and typical conditions estimated for 2010–39 (shown as ‘2025’), according to SRES scenario A2 of IPCC. Temperature data from the Finnish Meteorological Institute
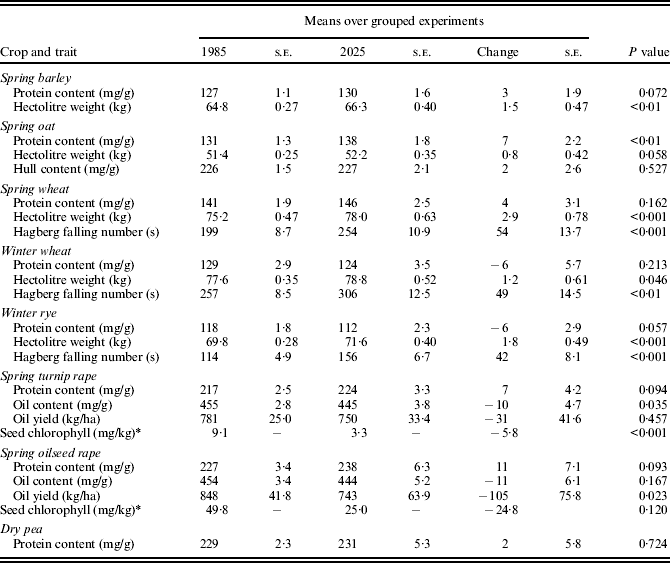
* Log (seed chlorophyll content).
Timing effects of temperature and precipitation changes
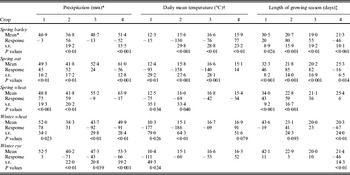
The temperature and precipitation responses of the crops were studied by dividing their growth into four phases of equal accumulated temperature (degree days). In the pre-heading phases (1 and 2) for spring cereals, the response to mean period temperature increase was negative and in most cases significant (Table 6). In the first phase (including seedling and plant stand establishment and covering the vegetative development phase as a whole), oat responded to a 1 °C increase in mean temperature with a yield reduction of 93 kg/ha, while for spring wheat the reduction was 75 kg/ha. However, in barley and oat, in particular, the yield responses to elevated temperatures were highest in phase 2 (just prior to heading) with 130 and 158 kg/ha yield reductions, respectively. Similarly, yields were reduced in phase 3 (early grain filling) by 76 and 140 kg/ha for barley and oat, respectively. Close to maturity (phase 4) only barley responded significantly (P<0·01) and positively to increased temperatures, with a 77 kg/ha increase in yield/1°C increase in the mean temperature. The response of winter cereals to mean temperature changes was generally analogous to that of spring cereals. Grain yield of winter wheat was especially sensitive to increase in temperature in phases 1 and 2, with 177 and 186 kg/ha yield declines/1°C increase in phase mean temperature, respectively. Lengthening of each of the phases 1 to 3 by 1 day increased the yield of all cereals except for winter rye, though not significantly for spring wheat in phase 3 and winter cereals in phases 1–3. The effect of lengthening the growing season on yield was greatest in phase 2 for all spring cereals, ranging from 59 to 85 kg/ha/1 day increase in the phase length (Table 6).
Yield response to precipitation, daily mean temperature and length of growth period in days for spring and winter cereals. The growth period of each crop is divided into four phases that are identical in length in degree days. For spring cereals heading took place at transition from phase 2 to phase 3 (within ±2 days). Data from long-term multi-location MTT Official Variety Trials and the Finnish Meteorological Institute

* Responses shown are for an increase in precipitation of 10 mm.
† Responses shown are for an increase in daily mean temperature by 1°C.
‡ Responses shown are for an increase in length of the growing season by 1 day.
Spring cereals responded differently to the increase in precipitation depending on growth phase. In phase 1 (for oat and wheat) and phase 2 (for all crops), an increase in precipitation of 10 mm corresponded to an increase in grain yield of 45–75 kg/ha (Table 6). However, increased precipitation in phase 4 (close to maturity) decreased grain yields by some 55 kg/ha per 10 mm increase in precipitation in spring barley and oat, while no significant effects were detected in phase 3 (early grain-filling). Winter wheat also responded negatively to precipitation during the late growth phases (3 and 4), while the response of rye was negative from phase 2 onwards. In general, accumulated precipitation was lowest in growth phase 2 and highest in phase 4, which was also true for rapeseed and pea (Table 7).
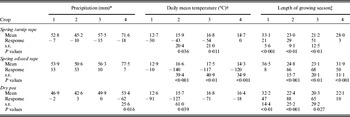
Yield response to precipitation, daily mean temperature and length of the growth period in days for spring rapeseed and dry pea. The growth period of each crop is divided into four phases that are identical in length in degree days. Data from long-term multi-location MTT Official Variety Trials and the Finnish Meteorological Institute

* Responses shown are for an increase in precipitation of 10 mm.
† Responses shown are for an increase in daily mean temperature by 1°C.
‡ Responses shown are for an increase in length of the growing season by 1 day.
No significant responses to precipitation were recorded for spring turnip rape and oilseed rape, in contrast to spring and winter cereals. A negative response was recorded for pea in phase 4, when increase in precipitation of 10 mm reduced seed yield by 62 kg/ha (Table 7). Increase in the mean temperature of each phase tended to reduce yield in rapeseed and pea; this was particularly significant (P=0·001–0·039) during phase 2 and, in rapeseed, also during phase 3. Increase in length of the growth phase typically increased yield: significantly (P=0·001–0·027) at phases 1–3 in turnip rape and pea, and in phases 2–4 in oilseed rape (P<0·01). When responses were significant, they ranged from 21 to 88 kg/ha/1 day increase in the length of each phase, depending on the crop.
Regional distribution and adequacy of precipitation
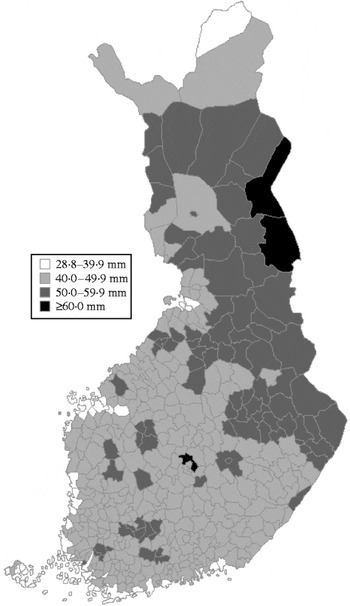
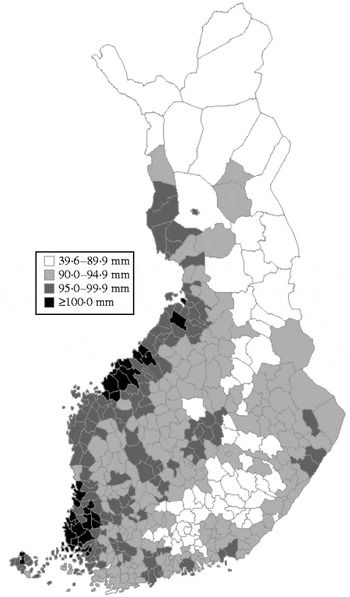
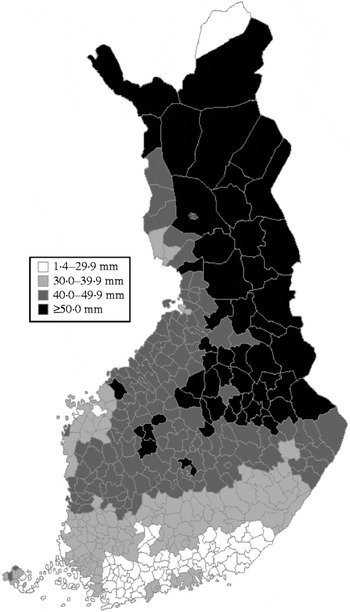
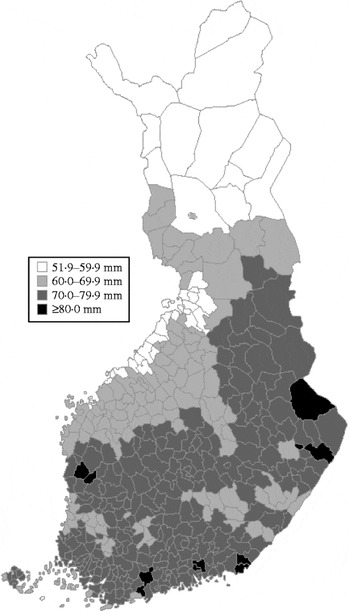
When further studying the typical regional distribution and adequacy of rains at the critical period of yield determination (215–465°Cd) with the predictive model, it was established that precipitation varied markedly from one region to another, from 29 to 64 mm (Fig. 1). The average precipitation over 30 years was clearly insufficient for two-row malting barley according to the model developed for Finnish conditions (Peltonen-Sainio et al. Reference Peltonen-Sainio, Rajala and Kontturi2003, Reference Peltonen-Sainio, Kontturi, Rajala and Tuuri2005), where 100 mm precipitation is needed for non-water limited yield determination. Only 0·29–0·64 of this was realized, depending on the region. If only those regions typical for cereal production were considered, the range of precipitation was only 0·29–0·50 of that needed by plant stands. On the other hand, accumulated evaporation at the phase of 215–465°Cd from sowing ranged from 40 mm to over 100 mm, depending on the region (Fig. 2). Similarly, there were large-range regional variations in precipitation at crop establishment and the vegetative phase of spring cereals (from sowing to 215°Cd), with less than 30 mm precipitation in southernmost Finland and up to 50 mm precipitation in cereal-producing regions (Fig. 3). When estimating the regional yield losses resulting from inadequate precipitation as a 30-year mean, they ranged from 0·07 to 0·17 according to the predictive model. Risks related to overabundant rains close to harvest (August) varied according to region, from c. 50 to 80 mm on average over 30 years (Fig. 4). Hence, all these results from long-term meteorological data sets emphasize the typical nature of uneven precipitation under northern European growing conditions.
Thirty-year mean of accumulated precipitation (1971–2000) for the most critical phase of yield determination in barley (from 215°Cd to 465°Cd from sowing) in different rural districts of Finland. Barley is mainly grown below 64°N. The critical period was determined from the model used for the prediction of malting barley yield and quality in Finland (published on the internet https://portal.mtt.fi/portal/page/portal/www_en/Research/Plants). Precipitation data were from the Finnish Meteorological Institute. Actual sowing times were from the Information Centre of the Ministry of Agriculture and Forestry in Finland (TIKE).

Thirty-year mean of evaporation sum (1971–2000) for the most critical phase of yield determination in barley (from 215°Cd to 465°Cd from sowing) in different rural districts of Finland. Data from the Finnish Meteorological Institute.

Thirty-year mean of precipitation (1971–2000) at early crop establishment covering the vegetative growth phase as a whole just prior to major yield determination phase (prior to 215°Cd). Data from the Finnish Meteorological Institute.

Thirty-year mean of accumulated precipitation (1971–2000) in August, when cereal, rapeseed and dry pea stands mature and are harvested. Data from the Finnish Meteorological Institute.

DISCUSSION
The spring cereal and rapeseed cultivars studied are adapted to the growing conditions typical of Finland, the northernmost European crop production region (Peltonen-Sainio et al. Reference Peltonen-Sainio, Rajala, Känkänen, Hakala, Sadras and Calderini2009b). Conditions are characterized by cold winters with snowfall, cool summers and precipitation throughout the year (modified Köppen climate classification, see e.g. http://www.fao.org/nr/climpag/globgrids/KC_classification_en.asp, http://koeppen-geiger.vu-wien.ac.at/ (verified 26 August 2010); Peltonen-Sainio et al. Reference Peltonen-Sainio, Rajala, Känkänen, Hakala, Sadras and Calderini2009b). When long-term MTT Official Variety Trial experiments were grouped according to temperature conditions, the crops were no more successful and productive at elevated temperatures when compared with temperature conditions typical of recent decades. The response of pea was, however, different from the other crops in this exercise, with seed yield enhancement in elevated temperatures compared to the typical temperature for ‘1985’ (Table 3). When comparing changes in the major yield components, the number of grains or seeds/m2 and single grain or seed weight, the only significant trade-off between them was found in barley. That is, under elevated temperature conditions, up to 1000 grains less were set/m2 compared to ‘1985’ conditions and single grain weight compensated for this, increasing by about 3%. Ugarte et al. (Reference Ugarte, Calderini and Slafer2007) found both yield components responded negatively to elevated temperatures in more southern regions.
Typically, an increase in temperature results in hastened developmental and growth rates of crops. This is especially critical under northern growing conditions where development progresses rapidly due to long days (Peltonen-Sainio & Rajala Reference Peltonen-Sainio and Rajala2007; Peltonen-Sainio et al. Reference Peltonen-Sainio, Rajala, Känkänen, Hakala, Sadras and Calderini2009b). Under such conditions, spring barley is the cereal most prone to yield losses as it matures earliest. Barley has the least time and capacity to compensate for the reduced floret number (reduced yield potential) resulting from an increased pre-anthesis developmental rate, especially when it occurs at the most critical phase of yield determination (Peltonen-Sainio et al. Reference Peltonen-Sainio, Rajala, Känkänen, Hakala, Sadras and Calderini2009b). Spring oat matures at about 60°Cd and wheat at 100°Cd later than barley (Peltonen-Sainio et al. Reference Peltonen-Sainio, Rajala, Känkänen, Hakala, Sadras and Calderini2009b). This is in general in agreement with the findings of this study, as yield losses of barley, despite the significant but small compensation in grain size (Table 3), were most severe (254 kg/ha in elevated temperatures compared to temperatures typical for ‘1985’) compared to oat (249 kg/ha) and spring wheat, for which the yield losses were not significant (Table 3). Winter cereals tended to benefit from higher-temperature conditions, although the differences between temperature conditions were neither significant, nor was the tendency of negative yield response in rapeseed.
In general, growth duration from sowing to maturity was reduced in all crops studied under elevated temperature conditions (Table 4). In spring cereals and winter wheat, this was associated with an increased ratio between pre-heading to post-heading growth duration (Table 4). With additional analyses of yield responses to temperature and lengthening of the growing season (Table 6), it was noted that increases in daily mean temperature at pre-heading (phases 1 and 2) and early grain-filling (phase 3) markedly reduced both spring and winter cereal grain yields: by up to c. 190 kg/ha/1°C increase in mean temperature of the particular phase. This supports the conclusion that hastened development and growth rates at elevated temperatures also harm yield formation in the generally cool growing conditions of northern Europe (Peltonen-Sainio et al. Reference Peltonen-Sainio, Rajala, Känkänen, Hakala, Sadras and Calderini2009b), both for the formation of yield potential prior to flowering and for its realization at early grain fill. This was evident when studying the effect of prolongation of different growth phases in spring cereals: in all phases except for grain filling in spring wheat, a 1-day prolongation resulted in yield improvements of 20–85 kg/ha (Table 6). Rapeseed generally responded similarly – both in terms of increase in mean phase temperatures and prolongation of the phase length. Furthermore, especially in spring turnip rape, the duration of flowering was reduced by about 5 days at elevated temperatures; similarly for pea (Table 4). Hence, the results on growth duration emphasize the significant role of a shortened growth period on yield losses. It also explains the absence of significant yield responses in cereals and rapeseed in terms of elevated temperature conditions and indicates that temperature elevation is harmful not only for generally warmer growing regions but also for cool seasons of Finland.
Although the experiments were grouped according to temperature conditions, it is likely that other climatic parameters were also altered. In this study, elevated temperatures typical for ‘2025’ were associated with reduced precipitation (by 7%) when compared with experiments having typical ‘1985’ temperature conditions (data not shown). Therefore, it is likely that the recorded yield losses, or at least lack of positive response to elevated temperatures, not only resulted from a damaging faster developmental rate but also from problems following decreased precipitation. Reduction of plant height (and associated reductions in lodging, though significant only for barley and oat, Table 4) is one indication of these effects and evident in ‘2025’ elevated temperature experiments for all spring-sown crops. Winter cereals responded differently, with significantly higher plants under warmer conditions. Such a difference between winter- and spring-sown crops probably results from an improved capacity of winter-sown crops to take up water from deeper soil layers due to their well-developed root systems, thereby better avoiding drought limitations to growth.
Despite negative or lack of significant effects on yield of cereals and rapeseed, some changes in grain and seed quality were found when comparing experiments with elevated and ‘1985’ typical temperature regimes (Table 5). The recorded changes were associated with those recorded for yield. As an example, grain protein content was slightly increased in barley and oat under elevated temperatures, while grain yields declined, hectolitre weight increased in all cereals, as did falling number of spring and winter wheat and winter rye. Hence, no reductions in yield quality were evident for cereals following temperature increases that were associated with more shortened grain-filling periods compared to the pre-heading period critical for yield determination. However, in rapeseed under elevated temperature conditions, seeds tended to contain less oil and/or produce lower oil yield/ha (Table 5). However, seed chlorophyll content, which is currently very critical for rapeseed quality in northern growing regions (Peltonen-Sainio et al. Reference Peltonen-Sainio, Jauhiainen and Venäläinen2009c), was reduced compared to experiments that experienced typical ‘1985’ temperature conditions.
When further studying the role of temperature and precipitation by dividing the growth period of cereals, rapeseed and pea into four phases (according to accumulated degree days), a general trend was noted: in all spring cereals, increases in early summer precipitation increased yields by 45–75 kg/ha/10 mm increase in precipitation, but often reduced yields during the last growth phase (Table 6). When monitoring the probabilities of having sufficient rains during the most critical phases of yield determination in barley with an additional case study, it was noted that on average over the three previous decades, only c. 0·30–0·60 of the precipitation needed for undisturbed yield formation fell, the effect depending on the region (Figs 1 and 2). Such constant water deficit resulted in yield losses averaging 7–17% over a 30-year period, again depending on the region, but being most marked in the areas where cereal production is concentrated. In contrast to cereals, rapeseed did not respond significantly to precipitation during any of the four growth phases. For pea, yield losses followed increases in precipitation at late seed filling (Table 7). Rains are becoming increasingly frequent in Finland during the late maturity phase and at harvest (Fig. 4). The situation may worsen with climate change (Jylhä et al. Reference Jylhä, Tuomenvirta and Ruosteenoja2004; IPCC Reference Solomon, Qin, Manning, Chen, Marquis, Averyt, Tignor and Miller2007) and will not make the future climate more favourable for quality formation and harvesting.
Increases in precipitation were disadvantageous to winter rye from phase 2, in contrast to the situation for spring cereals (Table 6). Increases in precipitation decreased grain yields by 71 kg/ha/10 mm increase in precipitation. This may result from the long straw of rye that makes it very sensitive to lodging (Table 4). Precipitation in phase 2 probably enhanced straw elongation, increasing the risk of lodging. In winter wheat, having shorter straw than rye, increases in precipitation were beneficial in phase 1, when re-growth following over-wintering was sustained, but were damaging in phases 3 and 4.
In conclusion, long-term experiments carried out in the generally cool growing seasons of the northernmost agricultural region of Europe indicated that the experiments with elevated temperature conditions resulted in no increases in yield, but rather yield penalties, except for pea. Elevated temperatures were damaging for both formation and realization of yield potential and especially for spring barley and oat. This is likely associated with reduced water availability. As elevated temperatures typically hastened development and growth, it is essential that cultivars are bred for adaptation to elevated temperatures that will hence, be less sensitive to increases in developmental rate induced by long-day conditions (Gonzalez et al. Reference Gonzalez, Slafer and Miralles2003, Reference Gonzalez, Slafer and Miralles2005; Slafer et al. Reference Slafer, Araus, Royo and Garcia Del Moral2005). They should also have improved water-use efficiency.
The authors are grateful to the numerous partners who participated in organizing the MTT Official Cultivar Trials since 1970. The work was financed by Finnish Ministry of Agriculture and Forestry and MTT Agrifood Research Finland as a part of on-going consortium projects entitled Adaptation of Finnish Agro-food Sector to Climate Change (ILMASOPU), which belongs to National Climate Change Adaptation Program, ISTO as well as Compensatory allowance system 2010 (LFA2010). The authors are grateful to Ari Venäläinen at Finnish Meteorological Institute for providing the datasets on regional precipitation and evaporation for LFA 2010 project and to Hannu Ojanen at MTT for producing the maps.