


Dielectric materials having high-dielectric constant (k ~ 10–1000 s) are critical to enable the next generation of electronic devices [e.g., Complementary metal-oxide-semiconductor (CMOS)] in which the dielectric constant will ultimately decide the degree of scaling following Moore's law.[Reference Moore1] In addition, high-k materials may greatly impact the development of a new generation of supercapacitors for high-frequency devices[Reference Pint, Nicholas, Xu, Sun, Tour, Schmidt, Gordon and Hauge2] and energy storage systems.[Reference Meng and Ding3] Very high-dielectric constants (k ≥ 1000) has been observed in ferroelectric materials that exhibit spontaneously created dipole moments,[Reference Osada, Akatsuka, Ebina, Funakubo, Ono, Takada and Sasaki4] or in an oxide with relaxor behavior characterized by a ferroelectric response under high-electric fields at low temperature but without macroscopic spontaneous polarization,[Reference Sanchez, Kumar, Ortega, Katiyar and Scott5] or some oxides with colossal dielectric constant such as La1.875Sr0.125NiO4[Reference Podpirka and Ramanathan6] and CaCu3Ti4O12[Reference Homes, Vogt, Shapiro, Wakimoto and Ramirez7] in which the giant dielectric constant has been generally characterized by a semiconducting bulk and highly resistive grain boundary.[Reference Podpirka and Ramanathan6, Reference Homes, Vogt, Shapiro, Wakimoto and Ramirez7] Recently, our group reported the development of nanolaminates (NLs) thin-film structure consisting of Al2O3 and TiOx layers (TAO) with sublayer thickness of below 1 nm.[Reference Lee, Lai, Phatak, Katiyar and Auciello8, Reference Lee, Lai, Phatak, Katiyar and Auciello9] The TAO NL structure exhibited k values of up to 1000 at lower frequencies (0.1–1 MHz), induced by the tailored materials and interfaces.[Reference Lee, Lai, Phatak, Katiyar and Auciello8, Reference Lee, Lai, Phatak, Katiyar and Auciello9] The recent research on the TAO NL[Reference Lee, Lai, Phatak, Katiyar and Auciello8, Reference Lee, Lai, Phatak, Katiyar and Auciello9] revealed that the relatively high leakage currents (~10−3 A/cm2) observed in the initial TAO NL[Reference Li, Auciello, Premnath and Kabius10] can be reduced by orders of magnitude (to ~10−8–10−9 A/cm2) by introducing an insulating Al2O3 layer at the interface of the TAO NL and the metallic top electrode with optimum thickness <5 nm.[Reference Lee, Lai, Phatak, Katiyar and Auciello8, Reference Lee, Lai, Phatak, Katiyar and Auciello9] The excellent performance of the TAO-based super-capacitors with giant dielectric constant and low leakage and losses up to frequencies of about 1 MHz is relevant to a broad range of solid-state super capacitor, very important for the performance of many devices and system that need energy storage components, as many medical devices that deliver electrical pulses in different parts of the human body, which operate at very low frequencies (30–300 Hz), or medium frequencies (300 KHz–3 MHz). For example, remote electrical stimulation by implanted devices used the high-current signal from high-frequency alternating current devices (in the range of 10–1 MHz).[Reference Ivorra11] The unique dielectric properties of the TAO NL have been explained by the interfacial boundary layer capacitance model, namely Maxwell–Wagner (MW) polarization effect,[Reference Li, Auciello, Premnath and Kabius10, Reference Li, Chen, Premnath, Kabius and Auciello12] which is induced by the unique TAO NL structure with interfacial boundary layer between the electrically insulating Al2O3 layer and the semiconducting TiOx layer, which control charge transfer responsible for the MW polarization effect.
In this study, we investigated the dielectric and electric properties—dielectric constant, loss, and leakage current density, respectively—closely related to the structural or phase change of the NL thin-film structures. The studies discussed here focused on investigating the structural changes in the TAO NL films and the resulting dielectric and electrical properties for the structures: TiOx (0.5 nm thick)/Al2O3 (0.5 nm thick) (named 0.5T–0.5A) to TiOx (0.9 nm thick)/Al2O3 (0.1 nm thick) (named 0.9T–0.1A). The nanostructures of the TAO NL were controlled at the nanoscale using atomic layer deposition (ALD). As the thickness of the TiOx layer increases to 0.9 nm and the Al2O3 layer thickness decreases to 0.1 nm, the amorphous TiOx layer changed to the anatase crystalline TiO2 phase, even at the ALD growth temperature of 300 °C. Concurrently with the phase change, the leakage current density as well as the dielectric loss were reduced by about two orders of magnitude but still having abnormally high-dielectric constant (k ~ 600) up to the MHz frequency range.
The TAO NLs (150 nm in thickness) were grown at 300 °C on Pt/TiO2/SiO2/Si substrates, using trimethylaluminum [Al(CH3)3] and titanium tetrachloride (TiCl4) as Al and Ti precursors for ALD growth, respectively, and water as the oxidant. Deposition rates for TAO were about 1.0 Å per cycle and 1.0 Å per three cycles, respectively, in good agreement with TAO NL grown previously.[Reference Lee, Lai, Phatak, Katiyar and Auciello8, Reference Lee, Lai, Phatak, Katiyar and Auciello9] The first layer grown on the bottom Pt electrode layer was Al2O3, as always done in the prior work to minimize the leakage current. Pt top and bottom electrodes were grown by radio frequency (rf)-magnetron sputtering at room temperature to produce the metal–insulator–metal capacitor structure. The thickness and diameter of the top electrodes, defined through a shadow mask and measured using optical and scanning electron microscopy after deposition on the NL surface, were about 100 nm and 250 µm, respectively. Transmission electron microscopy (TEM, FEI Tecnai F20ST TEM/STEM) revealed the cross-sectional structure of the TAO NLs thin films. Capacitance and loss were measured using an Agilent 4294A precision impedance analyzer at room temperature in the 100 Hz–1 MHz frequency range, whereas the leakage current was measured using a Keithley 237 instrument. The dielectric constant k was determined from the capacitance, using the relation C = kA/t, where C is the measured capacitance, A is the area of top electrode (250 µm in diameter), and t is the total thickness of NLs (150 nm).
Figure 1 shows the relative dielectric constant (i.e., electric permittivity) and loss values of each TAO NL capacitor. The total thickness of each NL was kept as 150 nm and pair sublayer thickness at 1 nm (i.e., the total thickness of a TAO bilayer), but changed each sublayer thickness of TiOx as 0.5, 0.7, and 0.9 nm (corresponding to 0.5, 0.3, and 0.1 nm-thick Al2O3 layers, respectively) as in Figs. 1(a)–1(c). The insets of Figs. 1(a)–1(c) show the laminate structure schematics of each TAO NL with the same TAO individual layer thickness of 1 nm. All the three samples show a giant dielectric constant near 1000 at the low frequency range (<~10 kHz). In detail, 0.5T–0.5A TAO NL shows high k (~1000), which, however, starts to decrease abruptly at 80 kHz. On the other hand, both the 0.7T–0.3A and 0.9T–0.1A NLs show a constant value of k (600–900) for the entire measured frequency range up to 1 MHz. The reason for this behavior was discussed and modeled in the prior papers.[Reference Lee, Lai, Phatak, Katiyar and Auciello8, Reference Lee, Lai, Phatak, Katiyar and Auciello9] Briefly, in Ref. Reference Lee, Lai, Phatak, Katiyar and Auciello9, a model was developed which expressed the cut-off frequency for uniform dielectric constant for TAO NL as
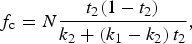 $${\,f_{\rm c}}=N\displaystyle{{{t_2}\lpar 1 - {t_2}\rpar } \over {{k_2}+\lpar {k_1} - {k_2}\rpar \, {t_2}}}\comma \;$$
where N is a numerical constant. From the analysis of equations (1)–(3) in Ref. Reference Lee, Lai, Phatak, Katiyar and Auciello9, which relates f c to C = kA/t, and R = ρt/A, it was determined that the constant N depends on the electrical resistivity (ρ) of Al2O3 and TiO2. The cut-off frequency f c was expressed as a function of t 2 (thickness of the TiOx sublayer) and dielectric constant of each material [k 1 (TiOx) and k 2 (Al2O3)]. Figure 3(d) of Ref. Reference Lee, Lai, Phatak, Katiyar and Auciello9 shows graphs of equation (1) plotted applying various known dielectric constants of Al2O3 and TiO2. The maximum value of f c occurs for the TiO2 layer of 0.7 nm thick, in excellent agreement with the experimental results shown in Fig. 3(a) of Ref. Reference Lee, Lai, Phatak, Katiyar and Auciello9. The comparison of the model and experimental data strongly indicates that the cut-off frequency is mainly determined by the dielectric relaxation process resulting from the TiOx layer, which is directly related to the amount of a charge carrier arising from the conductive and defective TiOx layer. These results motivated the studies discussed in this paper.
Dielectric constant and loss of: (a) 0.5 nm TiOx–0.5 nm Al2O3 NL, (b) 0.7 nm TiOx–0.3 nm Al2O3 NL, (c) 0.9 nm TiOx–0.1 nm Al2O3 NL, and (d) leakage current density of these three samples.

The interesting point of these measurements relates to the electrical loss behavior. Strangely, even when the thickness of the electrically conducting TiOx layer increases from 0.5 nm (0.5T) to 0.9 nm (0.9T), the loss value was reduced by more than two orders of magnitude as shown in Figs. 1(a)–1(c), especially, at the low frequency of 100 Hz. Typically low-frequency loss is affected by dc-conductivity.[Reference Prodromakis and Papavassiliou13] This means, as the amount of TiOx increase, the dc-conductivity of the TAO NLs should increase accordingly, however, it decreases, as shown in Fig. 1. Figure 1(d) shows the reduction of dc-conductivity with about two orders of magnitude less leakage current density for the 0.9T–0.1A TAO NLs, in comparison with the 0.7T–03A and 0.5T–0.5A TAO NLs for the excitation voltage ≤0.5 V. These leakage current measurements were done by applying voltages up to 5 V for 5 s, in which the scanning time is sufficiently slow to emulate a steady-state current measurement.
In order to understand this unusual behavior, we decided to study more in detail the microstructure of the TAO NLs. These studies revealed, first of all, that there is substantial change in the surface structure of the TiOx layer when the thickness increase from 0.5T to 0.9T, as shown in Figs. 2(a)–2(c), which are topological images taken by atomic forced microscopy (AFM). As grown 0.5T–0.5A and 0.7T–0.3A TAO NLs have very smooth surface morphology [Figs. 2(a) and 2(b)] with root-mean-square (rms) roughness of <2 nm [Fig. 2(d)]. However, the TAO NL with 0.9T–0.1A layers shows a relatively rough surface [Fig. 2(c)] with rms roughness of more than 50 nm [Fig. 2(d)]. So, the AFM data on surface roughness of the NLs elicited the question: what is the mechanism responsible for the surface roughening? In order to answer that question, x-ray diffraction [Fig. 2(e)] and Raman spectroscopy analysis [Fig. 2(f)] were performed. These analyses confirmed that there is clear phase change in the TiOx layer. Specifically, the amorphous TiOx phase changes to crystalline anatase TiO2 when the thickness of TiOx layer reaches 0.9 nm in thickness.
AFM topographical surface images of: (a) 0.5 nm TiOx–0.5 nm Al2O3 NL, (b) 0.7 nm TiOx–0.3 nm Al2O3 NL, and (c) 0.9 nm TiOx–0.1 nm Al2O3 NL (note that the light dots in this image correspond to the TiO2 phases). (d) Rms surface roughness of the samples described in panels (a), (b), and (c). (e) XRD [showing the TiO2 phase in sample (c)]. (f) Raman spectroscopy spectrum of these three samples [the red curve shows peaks corresponding to the TiO2 phase in sample (c)].
Figure 3 shows the cross-sectional microstructures of each TAO NLs thin film deposited on Pt/Si substrates, observed by TEM. There is no discernable crystalline phase or boundary area in the 0.5T–0.5A and 0.7T–0.3A TAO NLs in low-magnified TEM images as shown in Figs. 3(a) and 3(b). In addition, high-resolution TEM (HRTEM) images and associated diffraction patterns, taken on the 0.5T–0.5A and 0.7T–0.3A TAO NLs, shown in Figs. 3(e) and 3(f), reveal that the individual layers of the NLs are amorphous, which is confirmed by Fourier-transformed peaks of the TEM electron diffraction and by inversed Fourier-transformed images as shown in the insets of Figs. 3(e) and 3(f), respectively. However, for the 0.9T–0.1A NLs, for which a low-resolution TEM image is shown in Figs. 3(c) and 3(d), a crystalline phase and its boundary are clearly observed through the entire thickness of the TiOx layer, which seems to be nucleated on the Pt bottom electrode or in the middle of the NL structure, respectively. HRTEM obtained on the 0.9T–0.1A TAO NLs clearly revealed amorphous and localized crystalline phases in the TiOx layer, which are confirmed by diffraction patterns as in the inset of Fig. 3(g). Thus, the TEM data show that a substantial microstructural change occurred in localized areas of the TiOx layer during the ALD film growth. In addition to the structural change, there is a morphological change as well at the TAO interface.
Low-magnification TEM images of: (a) 0.5 nm TiOx–0.5 nm Al2O3 NL, (b) 0.7 nm TiOx–0.3 nm Al2O3 NL, (c) and (d) 0.9 nm TiOx–0.1 nm Al2O3 NL; and HRTEM images of: (e) 0.5 nm TiOx–0.5 nm Al2O3 NL, (f) 0.7 nm TiOx–0.3 nm Al2O3 NL, and (g) 0.9 nm TiOx–0.1 nm Al2O3 NL.
The phase transformation observed in the TiOx layer, which results in boundary (or interface) changes at the TAO interfaces, induces changes in the dielectric and electric properties of the TAO NLs. As confirmed by the HRTEM, there are clear boundaries between the TAO layers for 0.5T–0.5A and 0.7T–0.3A TAO NLs, as schematically shown in Figs. 4(a) and 4(b). For 0.9T–0.1A TAO NL, however, there are no clear boundaries between the TAO layers except for the localized boundary observed between the amorphous and crystalline phase [Fig. 3(g)]. Actually, a lamellar structure like that shown in Fig. 4(c) was expected. However, from the TEM images shown in Figs. 3(c) and 3(g), a more accurate schematic, representing the 0.9T–0.1A TAO NL, is like that shown in Fig. 4(d). Research from several groups[Reference Aarik, Aidla, MaE`ndar and Uustare:14–Reference Kim, Hoffmann-Eifert, Reiners and Waser16] has shown that phase change in TiOx (or TiO2) films from amorphous to crystalline can occur when the thickness of the film surpass a critical value when growing films by ALD. This process may dependent on the deposition conditions, but typically is observed in layers with thickness less than several tens of nanometer,[Reference Pore, Ritala, Leskelä, Saukkonen and Järn17] to minimize its free energy thermodynamically.[Reference López, Acosta, Martínez and Santiago:18] For the case of the TAO NLs discussed in this paper, as the Al2O3 layer becomes too thin (down to 0.1 nm), the Al2O3 layer may not any longer be continuous. Thus, the TiOx layers can connect continuously throughout the thickness range of the TAO NLs up to the total 150 nm in thickness, in the localized regions where the Al2O3 layer continuity breaks down, thus inducing the TiOx layer to achieve the critical thickness value that has been shown to induce phase transformation. The fact that the amorphous TiOx to anatase TiO2 phase change is localized as seen in Figs. 3(c) and 3(g), supports this hypothesis. Although there are small localized regions that break the continuity in the TAO NLs as shown in the real films [Figs. 3(c) and 3(g)] and in the corresponding schematic [Fig. 4(d)], still there may be larger areas with TAO NL continuity to still induce the high-dielectric constant (k ~ 600) as measured in the 0.9T–0.1A NLs [Fig. 1(c)]. The high k could not happen if the pure anatase TiO2 or amorphous or crystalline Al2O3 were the dominant phase across the whole NLs.[Reference Kim, Choi, Lee, Seo, Lee, Han, Ahn, Han and Hwang19] Thus, the high k can only be explained by the existence of extensive TAO capacitive interfaces, sustaining the MW polarization that explains the high k, as previously observed in Refs. Reference Lee, Lai, Phatak, Katiyar and Auciello8 and Reference Lee, Lai, Phatak, Katiyar and Auciello9.
Schematic NL structures of: (a) 0.5 nm TiOx–0.5 nm Al2O3 NL, (b) 0.7 nm TiOx–0.3 nm Al2O3 NL, (c) and (d) 0.9 nm TiOx–0.1 nm Al2O3 NL.
The other effect that needs to be explained is that although the TiOx may be extending across the NLs boundaries, thus providing oxygen-deficient TiOx electrically conductive phase, still the leakage current is about two orders of magnitude smaller (~10−4 A/cm2) than would be expected (~10−2 A/cm2) if the TiOx phase were the dominant phase[Reference Lee, Lai, Phatak, Katiyar and Auciello8, Reference Lee, Lai, Phatak, Katiyar and Auciello9] across the breakthrough regions in the Al2O3 layers of the NLs. The explanation for the low leakage is that the TiOx phase has changed into stoichiometric crystalline TiO2 phase, thus greatly reducing the conductive areas that would exist based on Figs. 3(g) and 4(d). The effects described above explain the difference of leakage current of each sample as shown in Fig. 1(d) as well. That is, by increasing the thickness of the TiOx layer with decreasing Al2O3 layer thickness, thus inducing the phase change from TiOx to TiO2, the result is the relatively low loss and low leakage current characteristics, and still having very high-k value as the deposited state.
In summary, we have investigated the dielectric properties related to the structural or phase change in TAO NL thin-film structures with several thickness combination of TAO sublayer. As the thickness of TiOx layer increases to ~0.9 nm and the Al2O3 layer thickness decreases to ~0.1 nm, this results in localized regions where the Al2O3 layer is discontinuous and the TiOx layer punches through, achieving a threshold thickness to induce a phase change to anatase crystalline TiO2 bulk phase. The effect of the localized TiOx phase change into TiO2 bulk phase is responsible for the two orders of magnitude reduction in the leakage current and dielectric loss observed in the NLs although the TAO are not continuous as in the prior work.[Reference Lee, Lai, Phatak, Katiyar and Auciello8, Reference Lee, Lai, Phatak, Katiyar and Auciello9] In addition, because the extensive regions of the TAO NLs still exhibit the NL structure, sustaining the MW polarization mechanism, the dielectric constant k is still relatively high (~600) up to the MHz frequency range. The results presented here have promising implications for the next generation of electronic memories such as the capacitive part of dynamic random access memories (DRAMs) and gate oxide of CMOS devices, or static electric energy storage devices with ultra-high capacitance such as solid-state super capacitors.
Acknowledgments
This work was supported by NSF grant (NSF-RII-EPS-1002410) to Professor R. Katiyar, and NSF SBIR grant (award no. 0924659) to B-K. Lai, and the University of Texas at Dallas initiation grant for Professor Auciello. The work of C. Phatak was supported by a grant from the US Department of Energy, BES-Materials Sciences, under Contract No. DE-AC02-06CH11357 to perform the TEM studies in the Electron Microscopy Center at Argonne National Laboratory.



