1. Introduction
Kernel density estimation is one of the widely used non-parametric estimation techniques for estimating the probability density function of a random variable. For a univariate random variable X with unknown density f(x), if we draw a sample of n independent and identically distributed observations x 1, x 2,…, xn, the kernel density estimator is given by (Wand & Jones, Reference Wand and Jones1995)
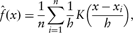
where h is the bandwidth that controls the amount of smoothness, and K(·) is the kernel function which is usually chosen to be a symmetric density function. Wand et al. (Reference Wand, Marron and Ruppert1991) argued that the classical kernel density estimator does not perform well when the underlying density is asymmetric because such an estimation requires different amounts of smoothing at different locations. Therefore, they proposed to transform the data with the intention that the use of a global bandwidth is appropriate for the kernel density estimator after transformation. The power transformation is one such transformation for this purpose.
There are a number of alternative transformation methods that have been studied in the literature. For example, Hjort & Glad (Reference Hjort and Glad1995) advocated a semi-parametric estimator with a parametric start. Clements et al. (Reference Clements, Hurn and Lindsay2003) introduced the Mobius-like transformation. Buch-Larsen et al. (Reference Buch-Larsen, Nielsen, Guillén and Bolancé2005) proposed an estimator obtained by transforming the data with a modification of the Champernowne cumulative density function and then estimating the density of the transformed data through the kernel density estimator. These transformation methods are particularly useful with insurance data because the distributions of insurance claim data are often skewed and present heavy-tailed features. However, these transformations often involve some parameters, which have to be determined before the kernel density estimation is conducted. In this paper, we aim to present a sampling algorithm to estimate the bandwidth and transformation parameters simultaneously.
It is well established in the literature that the performance of a kernel density estimator is largely determined by the choice of bandwidth and only in a minor way, by kernel choice (see for example, Izenman, Reference Izenman1991; Scott, Reference Scott1992; Simonoff, Reference Simonoff1996). Many data-driven methods for bandwidth selection have been proposed and studied in the literature (see for example, Marron, Reference Marron1988; Sheather & Jones, Reference Sheather and Jones1991; Scott, Reference Scott1992; Bowman & Azzalini, Reference Bowman and Azzalini1997). However, Zhang et al. (Reference Zhang, King and Hyndman2006) indicated that kernel density estimation for multivariate data has received significantly less attention than its univariate counterpart due to the increased difficulty in deriving an optimal data-driven bandwidth as the dimension of the data increases. They proposed MCMC algorithms to estimate bandwidth parameters for multivariate kernel density estimation.
The data set we use in this paper has two dimensions, and therefore we could use the sampling algorithm presented by Zhang et al. (Reference Zhang, King and Hyndman2006) to estimate bandwidth parameters. However, their algorithm has so far only been used to estimate a density for directly observed data. As our data are highly positively skewed and have to be transformed for the purpose of density estimation, we extend their MCMC algorithm so that it estimates not only the bandwidth parameters but also the transformation parameters for the bivariate insurance claim data. Bolancé et al. (Reference Bolancé, Guillén, Pelican and Vernic2008) analysed this data set using the kernel density estimation via transformations. This approach captures a certain degree of correlation between the two dimensions by using the product kernel. However, the parameters involved in the transformed kernel density estimator were estimated by dealing with each dimension individually, and this is likely to underestimate the correlation between the two dimensions. In this paper, we present MCMC algorithms for estimating the bandwidth and transformation parameters for not only univariate data but also bivariate data. We investigate the differences in estimated correlations calculated through both sampling algorithms.
The rest of the paper is organised as follows. In Section 2, we provide a brief summary of the data and demonstrate the motivation for the paper. Section 3 presents MCMC algorithms for estimating bandwidth parameters and transformation parameters for kernel density estimation via transformations for univariate and bivariate data. In Section 4, we examine the performance of our MCMC algorithms in choosing bandwidths and estimating transformation parameters for the bivariate insurance claim data. Section 5 concludes the paper.
2. Data and motivation
Our data set is the one analysed by Bolancé et al. (Reference Bolancé, Guillén, Pelican and Vernic2008), whose data were collected from a major automobile insurance company in Spain. The data contain 518 paired claims. Each claim contains two types of losses, which are respectively, property damage X 1 and medical expenses X 2. It is intuitive that a serious car accident might cause serious damage to the cars, and the passengers involved in the accident might also be seriously injured. Therefore, we expect that the two types of claims are positively correlated.
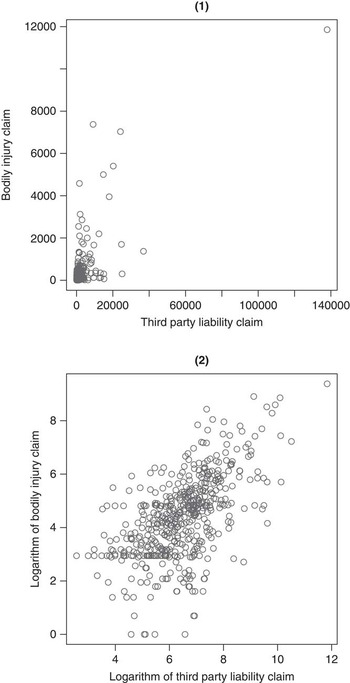
Figure 1 presents a scatter plot of claims of bodily injury costs against property damage costs, as well as a scatter plot of the logarithms of such claim costs. The two graphs suggest that there exists an obvious positive correlation between the two types of costs.
(1) Scatter plot of bodily injury claims versus third party liability claims; and (2) Scatter plot of logarithmic bodily injury claims versus logarithmic third party liability claims.

Bolancé et al. (Reference Bolancé, Guillén, Pelican and Vernic2008) investigated modelling the data using both the classical kernel density estimation method and the transformed kernel density estimation method. They found that the transformed kernel estimation approach obviously performs better than the classical kernel estimation method in terms of calculating the conditional tail expectation (CTE). They firstly estimated the transformation parameters by looking at each dimension of the bivariate costs, and then used the product kernel for the kernel density estimator for the bivariate transformed data. The use of the product kernel can capture a certain degree of correlation between the two dimensions. We wish to see whether there is an improvement in the correlation captured if we take both dimensions into account during the parameter estimation process. In this paper, we propose to estimate the bandwidths and transformation parameters for the bivariate data through our new Bayesian sampling algorithm.
3. Bayesian sampling algorithms
3.1. Kernel density estimation for transformed data
The kernel density estimation technique is often of great interest in estimating the density for a set of data. However, when the underlying true density has heavy tails, the kernel density estimator (with a global bandwidth being used) can perform quite poorly. Wand et al. (Reference Wand, Marron and Ruppert1991) suggested transforming the data and obtaining the kernel density estimator for the transformed data. The density estimator for the untransformed data is the derived kernel density estimator for the transformed data multiplied by the Jacobian of such a transformation. Wand et al. (Reference Wand, Marron and Ruppert1991) found that compared to working with kernel density estimation for untransformed data, significant gains can be achieved by working with density estimation for transformed data.
The shifted power transformation is one such transformation that is effective in changing the degree of positive skewness in data (see for example, Wand et al., Reference Wand, Marron and Ruppert1991). Such a transformation is given by

where λ 1 > −min {x 1, x 2, … , xn}, and λ 2 < 1. To ensure that this transformation is scale preserving,  is further transformed as
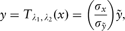
where  and
 are the variances of x and
 , respectively.
 , for i = 1, 2, … , n. The kernel density estimator for the univariate transformed data is
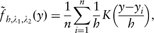
and the kernel density estimator for the untransformed data is

Wand et al. (Reference Wand, Marron and Ruppert1991) investigated data-driven selection methods for the choice of transformation parameters and bandwidth or smoothing parameter for univariate data. However, the transformation parameters have to be pre-determined for chosen bandwidths. Moreover, when the dimension of data increases, the estimation of these parameters becomes increasingly difficult. In this paper, we aim to estimate the transformation parameters and bandwidth parameters simultaneously.
3.2. Bivariate kernel density estimation via transformation
Let X = (X 1, X 2)⊤ denote a bivariate random vector with density f(x), and let xi=(xi 1, xi 2)⊤, for i = 1, 2, … , n, be an independent random sample drawn from f(x). The transformed data are denoted as  , for i = 1, 2, … , n. The kernel density estimator for the bivariate transformed data is given by

where h 1 and h 2 are bandwidths for the two dimensions, and  (·,·) is a bivariate kernel function which is usually the product of two univariate kernels. Therefore, this bivariate kernel estimator can be re-written as

The bivariate kernel density estimator for the original data is

where x = (x 1, x 2)⊤, h = (h 1, h 2)⊤ is a vector of bandwidths, λ1 = (λ 11, λ 21)⊤ is a vector of transformation parameters for x 1, and λ2 = (λ 12, λ 22)⊤ is a vector of transformation parameters for x 2.
In the current literature, there are two limitations in using the kernel density estimation via transformations. First, the transformation parameters have to be pre-determined so that bandwidth parameters can be chosen through some currently available method. Second, when estimating the density of the insurance claim data, Bolancé et al. (Reference Bolancé, Guillén, Pelican and Vernic2008) obtained the marginal kernel density estimator for each dimension via transformations. They derived the CTE through the estimated marginal densities. Their approach does capture a certain degree of correlation between the two dimensions by using the product kernel, while their parameter estimations was conducted for each dimension individually. In this paper, we aim to derive the posterior density of the transformation parameters and bandwidths and present a Metropolis-Hastings sampling algorithm to sample both types of parameters from their posterior density.
3.3. Bayesian sampling algorithms
Zhang et al. (Reference Zhang, King and Hyndman2006) presented an MCMC sampling algorithm for estimating bandwidth parameters for kernel density estimation based on untransformed data. Treating bandwidths as parameters, they derived the posterior density of the bandwidths through the likelihood cross-validation criterion. This criterion involves choosing an optimal bandwidth that minimises the Kullback-Leibler information, which is a measure of the discrepancy between the true underlying density f(y) and the density estimator  and is defined as
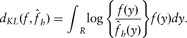
Zhang et al. (Reference Zhang, King and Hyndman2006) showed that minimising Kullback-Leibler information is approximately equivalent to maximising

with respect to h. However, if we directly maximise (4) with respect to h, the resulting bandwidth would be zero. One way of dealing with this problem is to estimate fh(yi) based on the observations without yi, and to approximate  by (Härdle, Reference Härdle1991)

where  is the leave-one-out estimator given by

The log-likelihood of {y 1, y 2, … , yn} for given h could be approximated by nL(y 1, y 2, … , yn|h). Therefore, the posterior density of h is proportional to the product of the prior density of h and this likelihood function.
The Bayesian sampling algorithm proposed by Zhang et al. (Reference Zhang, King and Hyndman2006) is mainly used for estimating bandwidths in kernel density estimation for untransformed data. As our data are highly positively skewed, the original data should be transformed for the purpose of density estimation. We extend the sampling algorithm of Zhang et al. (Reference Zhang, King and Hyndman2006) by deriving the posterior density of the bandwidth parameters and transformation parameters. Thus, we can estimate not only the bandwidth parameters but also the transformation parameters simultaneously for our kernel density estimator of the transformed data. When data are transformed through some transformation parameters, the kernel-form density estimator of the original data is given by (3), which is a function of bandwidth parameters and transformation parameters. We find that the sampling algorithm of Zhang et al. (Reference Zhang, King and Hyndman2006) can be extended by including additional transformation parameters to sample both types of parameters from their posterior density constructed through (3).
3.3.1. Univariate kernel density estimation
We now investigate the issue of using Bayesian sampling techniques to estimate the transformation parameters, λ 1k and λ 2k, and the bandwidth, hk, based on univariate data, (x 1k, … , xnk)⊤, for k = 1 and 2, respectively. As the parameters are estimated for each of the two dimensions respectively, any possible correlation between the two dimensions can only be captured through the use of the product kernel. For each dimension, we have three unknown parameters, namely hk (the bandwidth), λ 1k and λ 2k (the transformation parameters for shifted power transformation family). The posterior density of these three parameters can be obtained through the likelihood cross-validation criterion in the same way as in Zhang et al. (Reference Zhang, King and Hyndman2006). We assume the prior density of Hk, whose realised value is hk, is a normal density given by
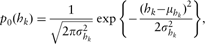
which is truncated at 0 so as to maintain the domain of positive bandwidths, for k = 1 and 2. The prior density of Λ1k is assumed to be the normal density given by
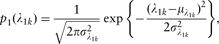
which is left truncated at -min {x 1k, x 2k, … , xnk}, for k = 1 and 2. The prior density of Λ2k is assumed to be the uniform density on (−ak,1) given by

for k = 1 and 2. Therefore, the joint prior density of (Hk, Λ1k, Λ2k) is

where the hyperparameters are  and ak, for k = 1 and 2. The likelihood is approximated as

where  denotes the leave-one-out estimator of the density of xik (see for example, Zhang et al., Reference Zhang, King and Hyndman2006) given by

for k = 1 and 2.
According to Bayes theorem, the posterior density of (Hk, Λ2k, Λ2k) is (up to a normalising constant)

for k = 1 and 2. Using the random-walk Metropolis-Hastings algorithm, we are able to sample (h 1, λ 11, λ 21) and (h 2, λ 12, λ 22) from (6) with k = 1 and 2, respectively. The ergodic average (or the posterior mean) of each parameter acts as an estimate of that parameter. In terms of univariate kernel density estimation discussed here, our contribution is to present a sampling algorithm that aims to estimate the bandwidth and transformation parameters within a Bayesian sampling procedure for univariate data. Hereafter, we call this sampling algorithm the univariate sampling algorithm.
3.3.2. Bivariate kernel density estimation
Given bivariate observations denoted as xi, for i = 1, 2, … , n, and the parameter vector denoted as (h,λ 1,λ 2), which were defined immediately after (3), the likelihood function is approximated as (Härdle, Reference Härdle1991)

where

the leave-one-out estimator of the density of X computed at x i, for i = 1, 2, … , n.
Let the joint prior density of (H, Λ1, Λ2) be denoted as p(h, λ1, λ2), which is the product of marginal priors defined in Section 3.3.1. Then the posterior density of (H, Λ1, Λ2) is (up to a normalising constant)

from which we can sample (h,λ 1,λ 2) through an appropriate Bayesian sampling algorithm such as the Metropolis-Hastings sampling algorithm described as follows.
i) Conditional on (λ1, λ2), we sample h from (9) using the Metropolis-Hastings algorithm.
ii) Conditional on h, we sample (λ1, λ2) from (9) using the Metropolis-Hastings algorithm.
The sampling algorithm in the first step is the same as the one presented by Zhang et al. (Reference Zhang, King and Hyndman2006) for directly observed data. Alternatively, we can sample (h, λ1, λ2) directly from its posterior density given by (9) using the Metropolis-Hastings algorithm. Hereafter, we call this sampling algorithm the bivariate sampling algorithm.
3.4. An application to bivariate insurance claim data
In order to explore the benefits that could be gained by estimating the parameters using bivariate data instead of separately estimating density for each dimension of data, we apply the MCMC algorithms proposed in Section 3.3 in two ways and compare the two sets of results.
First, we estimated (hk, λ 1k, λ 2k) for the kernel density estimator of each variable based on univariate data {x 1k, x 2k, … , xnk}, for k = 1 and 2, using the sampling algorithm presented in Section 3.3.1. The hyperparameters were chosen to be  and
 , for k = 1 and 2, and
 and ak = 6, for k = 1 and 2. In terms of the normal prior densities, the standard deviation values were deliberately chosen as large values, such that the normal prior densities are very flat. As we did not know the central locations of these normal prior densities, we tried a few values for these central locations by initially running the sampling algorithm several times. In terms of the uniform prior, we actually put a constraint through a reference to Bolancé et al. (Reference Bolancé, Guillén, Pelican and Vernic2008). No matter what values were chosen for these hyperparameters, a resulting sampler should produce the best mixing performance.
Second, we estimated the bandwidth vector h = (h 1, h 2)⊤, the transformation parameter vectors λ1 and λ2 in the bivariate density estimator for the bivariate data using the sampling algorithm presented in Section 3.3.2. The hyperparameters were chosen to be  for k = 1 and 2,
 , a 1 = 5 and a 2 = 2. We actually followed the same rule as the above-mentioned in choosing values for these hyperparameters.
We are particularly interested in the correlation coefficient captured through both sampling algorithms. We wish to know whether the correlation between the two dimensions can be better captured using the bivariate sampling algorithm than with the univariate sampling algorithm. We calculate the Pearson's correlation coefficient between X 1 and X 2 using the estimated densities with the formula

where  ,
 , for i = 1 and 2, and
 . Using the rectangle method, we wrote R functions to numerically approximate the integrals and the double integral in the above expression. Our programs allow for controlling the accuracy of the integrals. We tested our numerical computation on bivariate normal distributions with known densities and found that the error is less than 0.01%.
4. Results and discussion
4.1. MCMC results
As previously discussed in Section 3.2, we executed both the the univariate and bivariate sampling algorithms. Table 1 presents the results obtained by running the univariate sampling algorithm for each of the two dimensions, respectively. Any possible correlation between the two dimensions is only captured through the use of product kernel, while the parameter estimation procedure did not take the correlation into account. Table 2 provides the results derived by running the bivariate sampling algorithm for the bivariate data.
MCMC results obtained through the univariate sampling algorithm.

MCMC results obtained through the bivariate sampling algorithm.

To prevent false impressions of convergence, we chose the tuning parameter in the random-walk Metropolis-Hastings algorithm so that the acceptance rate was between 0.2 and 0.3 (see for example, Tse et al., Reference Tse, Zhang and Yu2004). The burn-in period was chosen to contain 5,000 iterations, and the number of total recorded iterations was 10,000. The simulation inefficiency factor (SIF) was used to check the mixing performance of the sampling algorithm (see for example, Roberts, Reference Roberts1996). The SIF can be approximated as the number of consecutive draws needed so as to derive independent draws. For example, if the SIF value is 20, we should retain one draw for every 20 draws so that the retained draws are independent (see for example, Kim et al., Reference Kim, Shephard and Chib1998; Meyer & Yu, Reference Meyer and Yu2000; Zhang et al., Reference Zhang, Brooks and King2009).
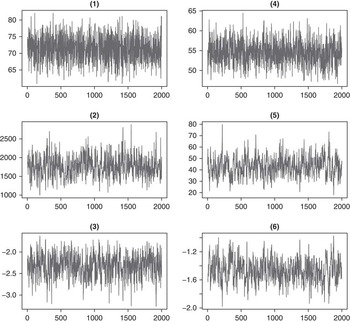
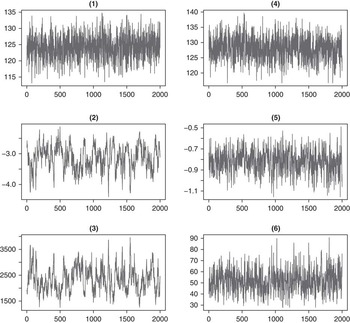
Figure 2 provides graphs for simulated chains based on univariate data, and Figure 3 presents graphs for simulated chains based on bivariate data. In each graph, we plotted the simulated chains for the bandwidth and transformation parameters. According to the SIF values presented in Table 1 and the graphs of the simulated chains presented in Figure 2, we found that the simulated chains of parameters for both variables have achieved very good mixing performance.
Plots of simulated chains based on univariate data series. The left column contains the simulated chains of (h, λ 1, λ 2) based on the first series, and the right column contains the simulated chains of the same set of parameters based on the second series. In each of the six graphs, the horizontal axis represents the serial number of draws which retained one draw for every five draws; and the vertical axis represents parameters values.

Plots of simulated chains based on bivariate data series. The left column contains the simulated chains of (h, λ 11, λ 12), and the right column contains the simulated chains of (h, λ 21, λ 22). In each of the six graphs, the horizontal axis represents the serial number of draws which retained one draw for every five draws; and the vertical axis represents parameters values.

Table 2 and the graphs of the simulated chains presented in Figure 3 show that the simulated chains of parameters for the bivariate density estimator have achieved reasonable mixing performance. Even though the SIF values of λ 11 and λ 21 are larger than those of the other parameters, they are well below 100, which is usually considered as a benchmark for a reasonable mixing performance. Therefore we could conclude that the inefficiency of the simulated Markov chains is tolerable in view of the number of iterations.
4.2. Accuracy of results obtained through the MCMC algorithms
Let M 1 denote the univariate sampling algorithm proposed in Section 3.3.1 and M 2 denote the bivariate sampling algorithm proposed in Section 3.3.2. In order to examine the performance of the two algorithms for the estimation of bandwidth parameters and transformation parameters, we computed the value of the correlation coefficient given by (10) and the value of log-likelihood function given by (7) based on parameter estimates obtained through M 1 and M 2, respectively.
The log-likelihood value calculated through parameter estimates given in Table 1 is -9501.00, and log-likelihood calculated through parameter values given in Table 2 is -7636.26. This indicates a dramatic increase of the log-likelihood value obtained through M 2 against M 1.
The correlation coefficients approximated through the density estimator given by (3) with parameters estimated through M 1 and M 2 are 0.2 and 0.26, respectively. This indicates that the bivariate sampling algorithm can better capture the correlation between X 1 and X 2 than the univariate sampling algorithm. As the sample measures of Pearson's correlation coefficient and Spearman's rank correlation coefficient are respectively, 0.73 and 0.58, we have to say that both M 1 and M 2 tend to underestimate the correlation between the two dimensions. The reason for this outcome is likely to be the use of the product kernel, or equivalently, the use of a diagonal bandwidth matrix for the bivariate Gaussian kernel. A possible remedy to this problem is to use a full bandwidth matrix at the expense of increased complexity of the resulting bivariate density estimator. We leave this for future research.
5. Conclusions
This paper presents Bayesian sampling algorithms for estimating bandwidths and transformation parameters in the kernel density estimation via transformations for bivariate data. The proposed sampling algorithms can estimate not only the bandwidth parameters but also the transformation parameters through a Metropolis-Hastings sampling procedure. Our sampling algorithms have achieved very good mixing performance. When estimating the density of bivariate insurance claim data, we have found that our bivariate sampling algorithm has an improvement over what Bolancé et al. (Reference Bolancé, Guillén, Pelican and Vernic2008) did, where the transformation parameters were estimated by dealing with each variable separately. We calculate the correlation coefficient through our bivariate sampling algorithm in comparison with that calculated through the univariate sampling algorithm. We have found that the correlation between the two dimensions is better captured via the bivariate sampling algorithm than the univariate sampling algorithm.
We have also computed the conditional tail expectation as in Bolancé et al. (Reference Bolancé, Guillén, Pelican and Vernic2008). However, our results tend to underestimate the empirical conditional tail expectations. This is not surprising because our sampling algorithms were developed based on the Kullback-Leibler information, under which our results are optimal in terms of the entire density rather than the tails of the density. Further research could focus on finding the optimal bandwidth and transformation parameters for bivariate kernel density estimation via transformations, which give a more accurate estimate of the tail of the joint density. The third author acknowledges financial support from the Australian Research Council under the discovery project DP1095838.
6. Acknowledgements
We wish to thank the Editor Angus Macdonald and two anonymous referees for their very constructive comments that have substantially improved the paper. We also extend our thanks to Professor Montserrat Guillén from the University of Barcelona for providing the automobile insurance data used in the paper. The third author acknowledges financial support from the Australian Research Council under the discovery project DP1095838.